. 2019 Dec:225:119537.
doi: 10.1016/j.biomaterials.2019.119537. Epub 2019 Oct 8.

A customizable microfluidic platform for medium-throughput modeling of neuromuscular circuits

Affiliations

A customizable microfluidic platform for medium-throughput modeling of neuromuscular circuits

Jessica Bellmann et al. Biomaterials. 2019 Dec.

Abstract

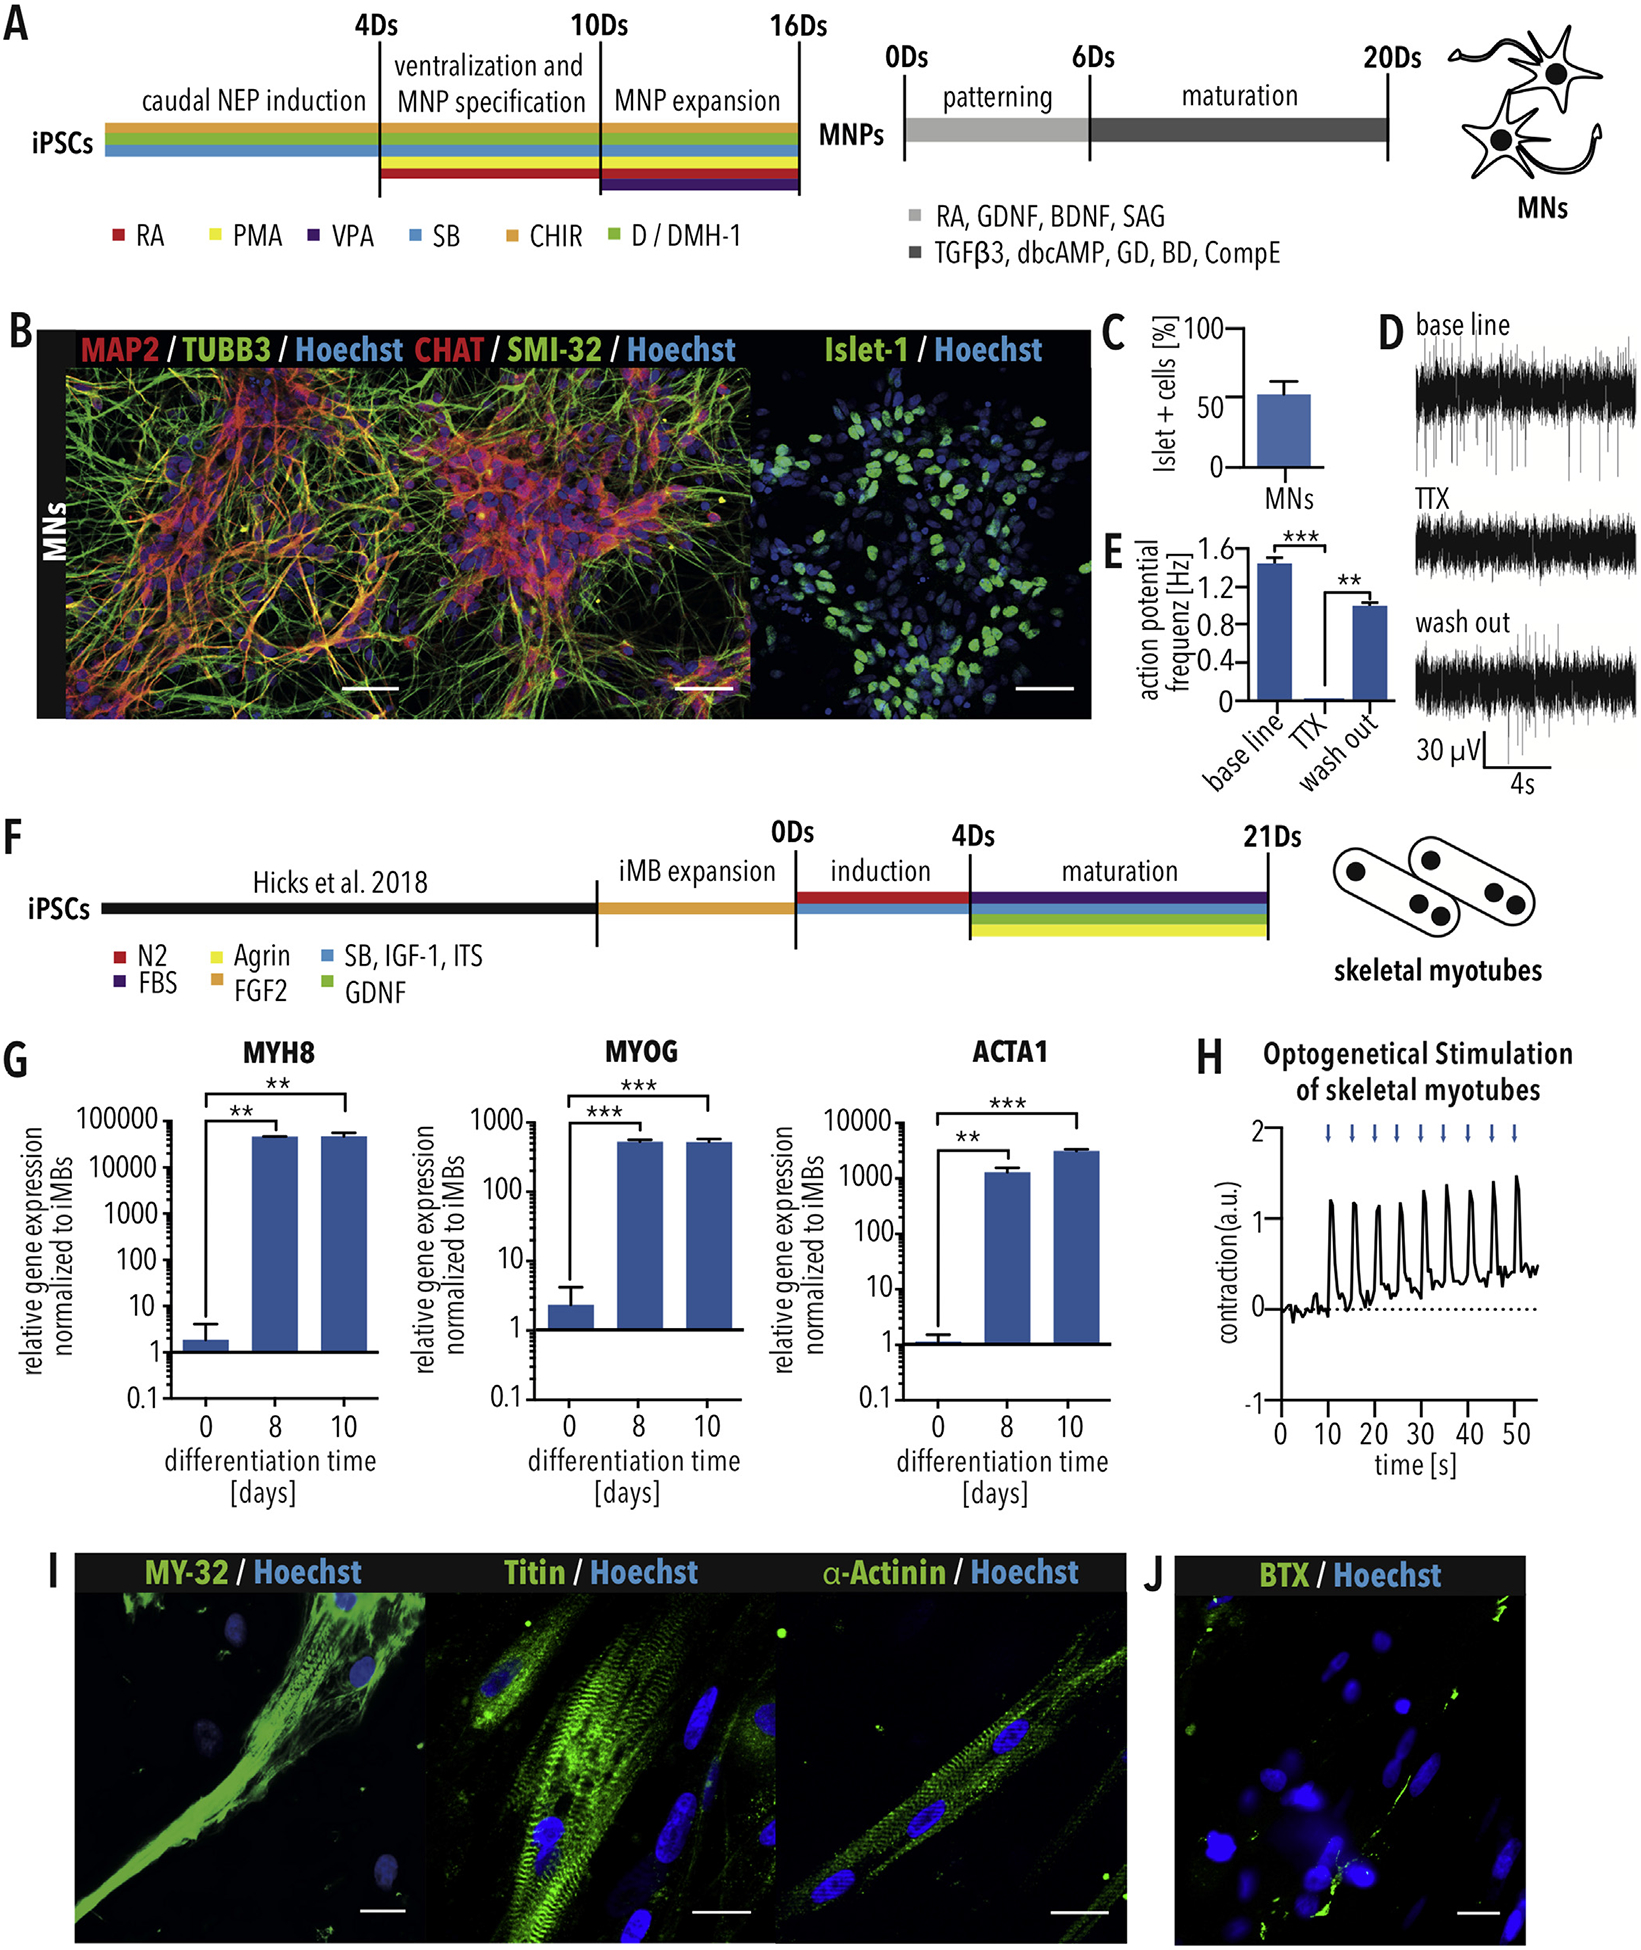
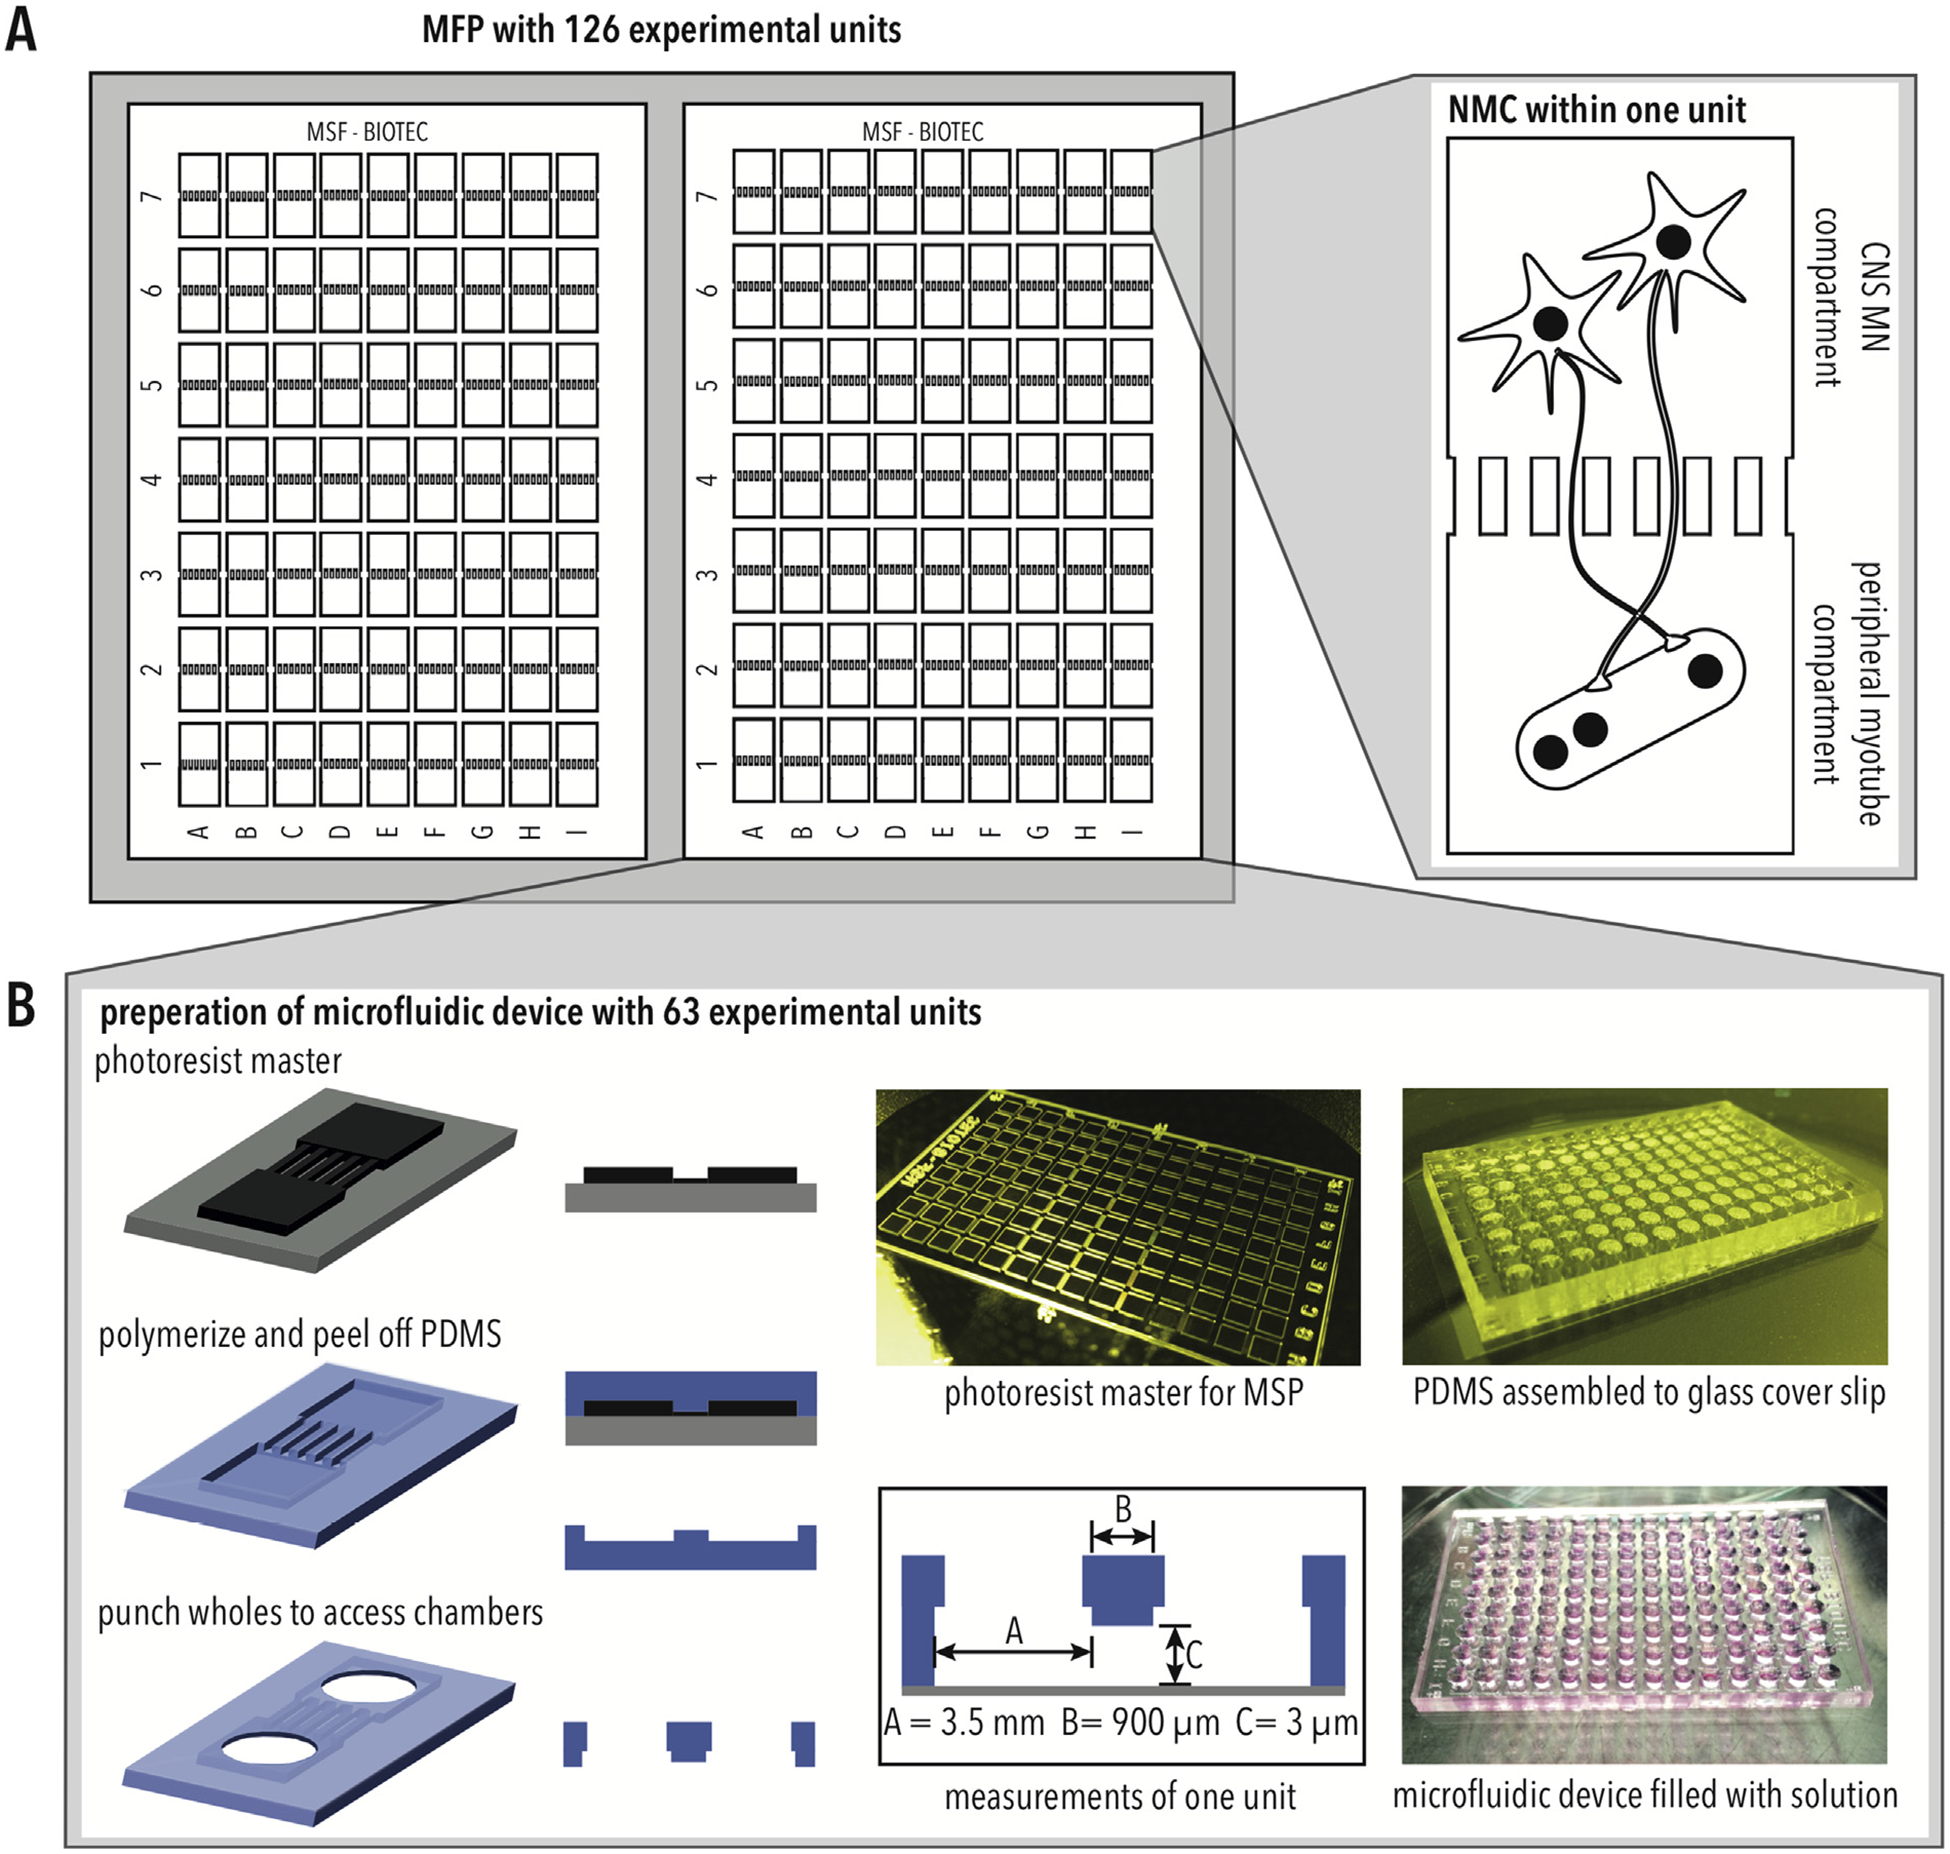
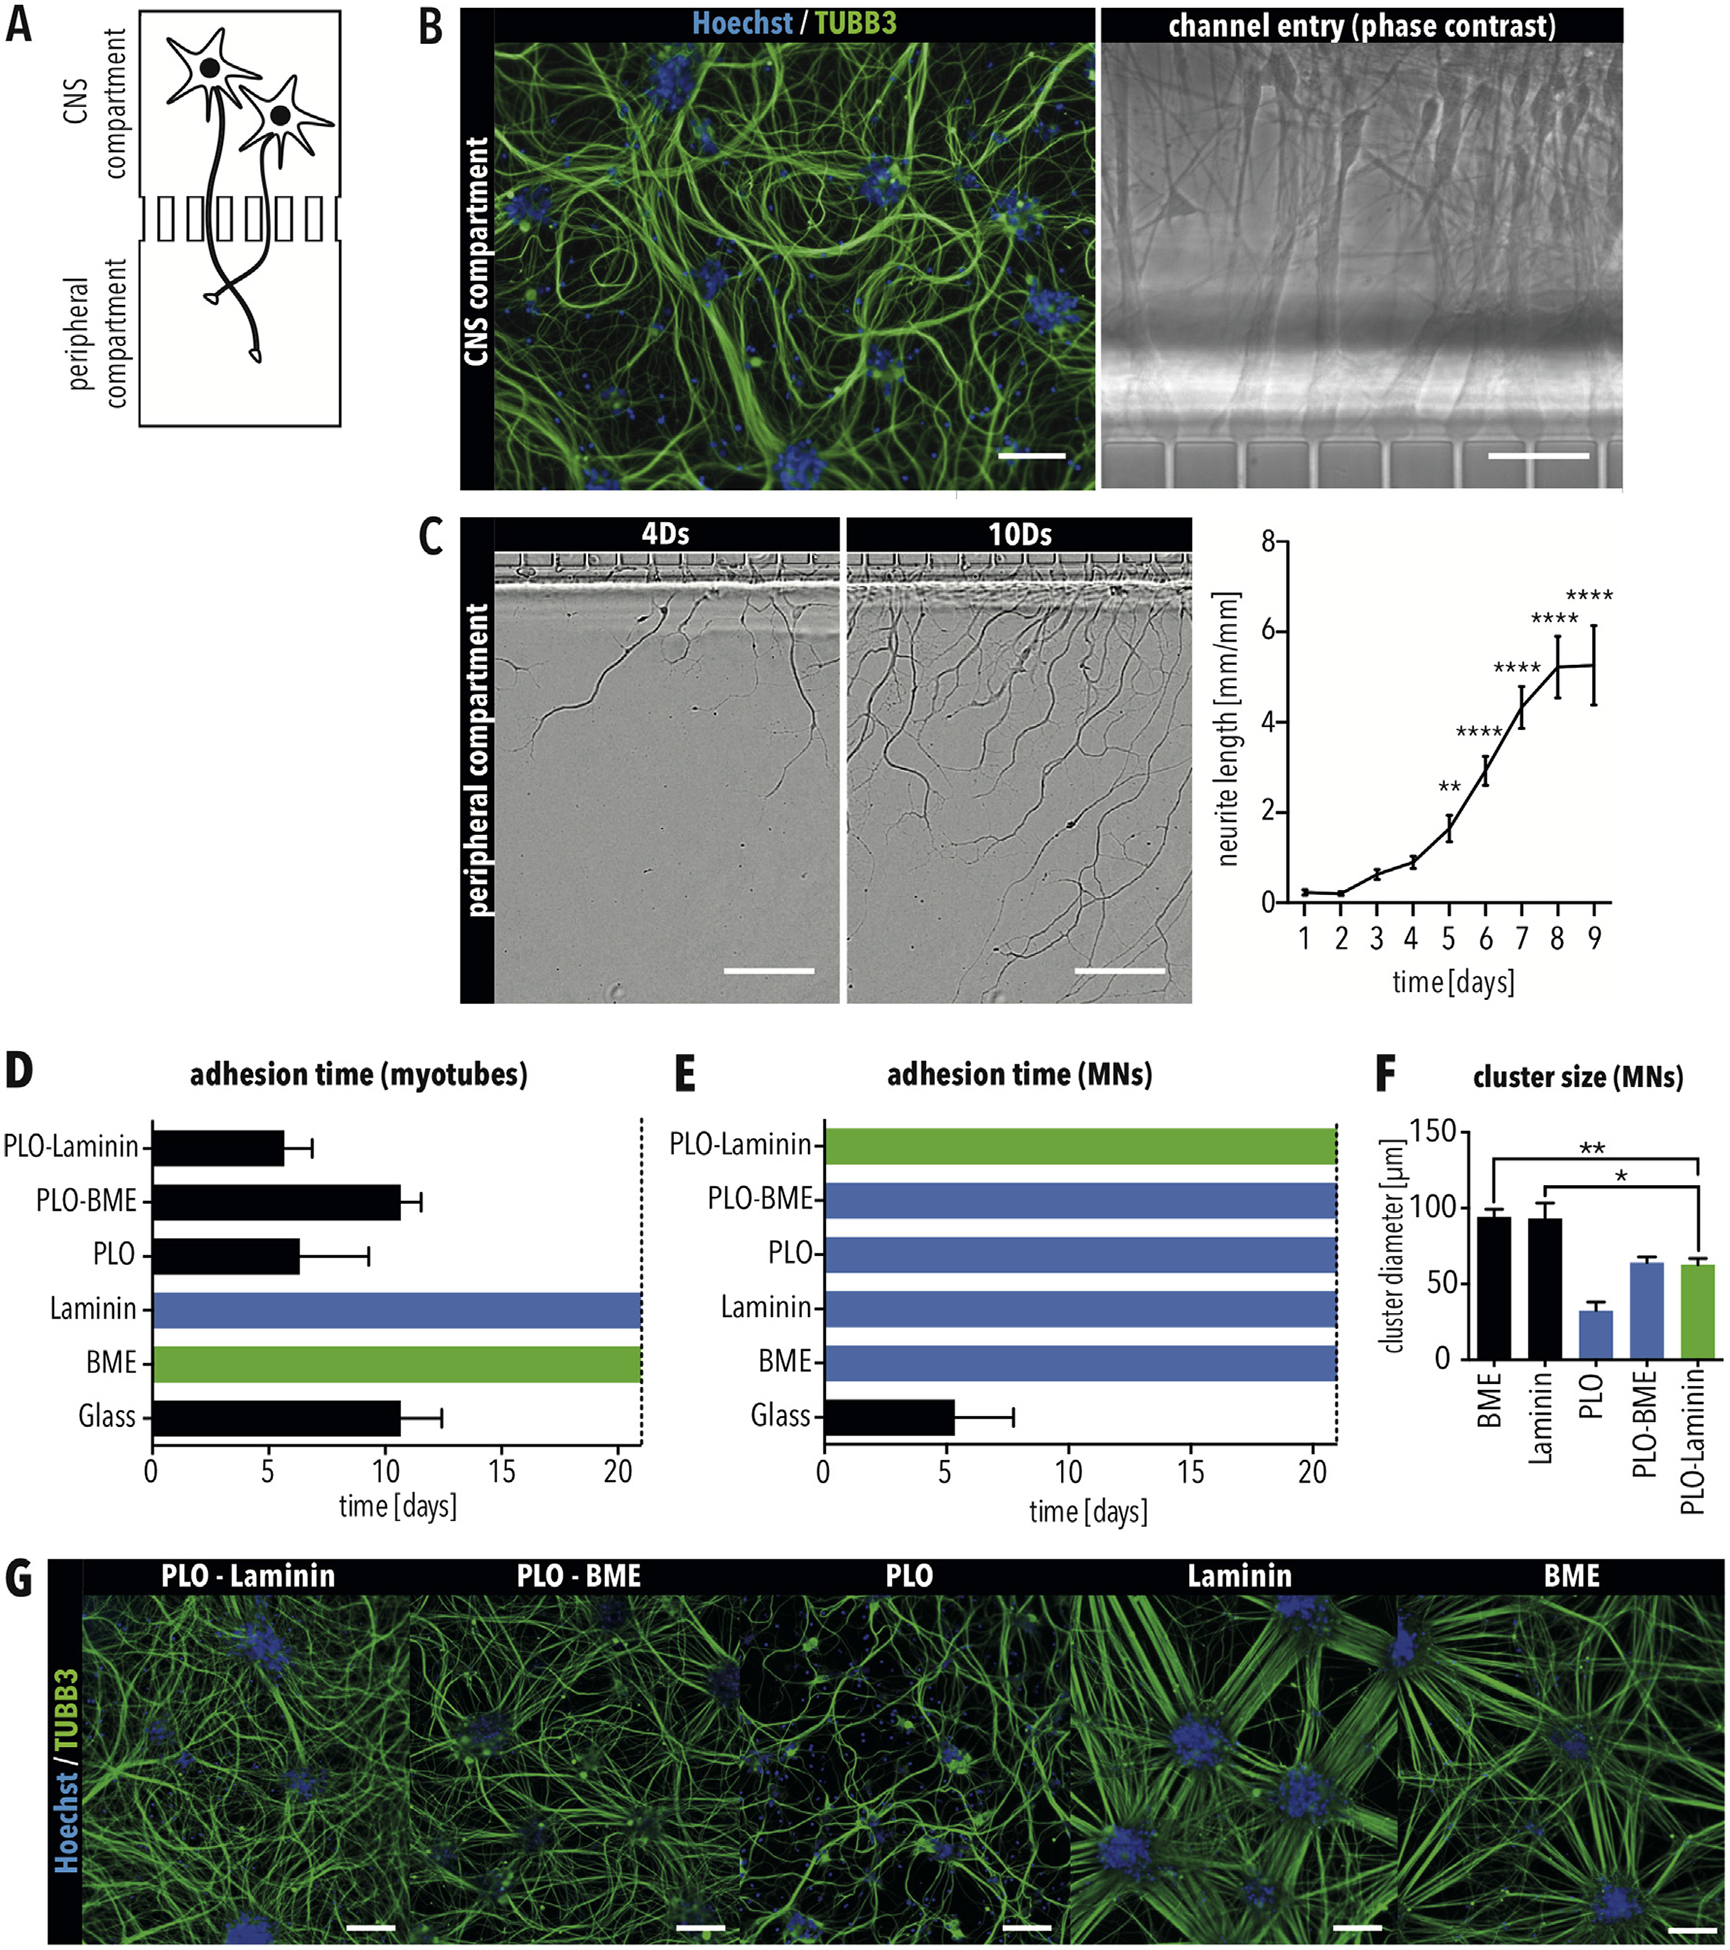
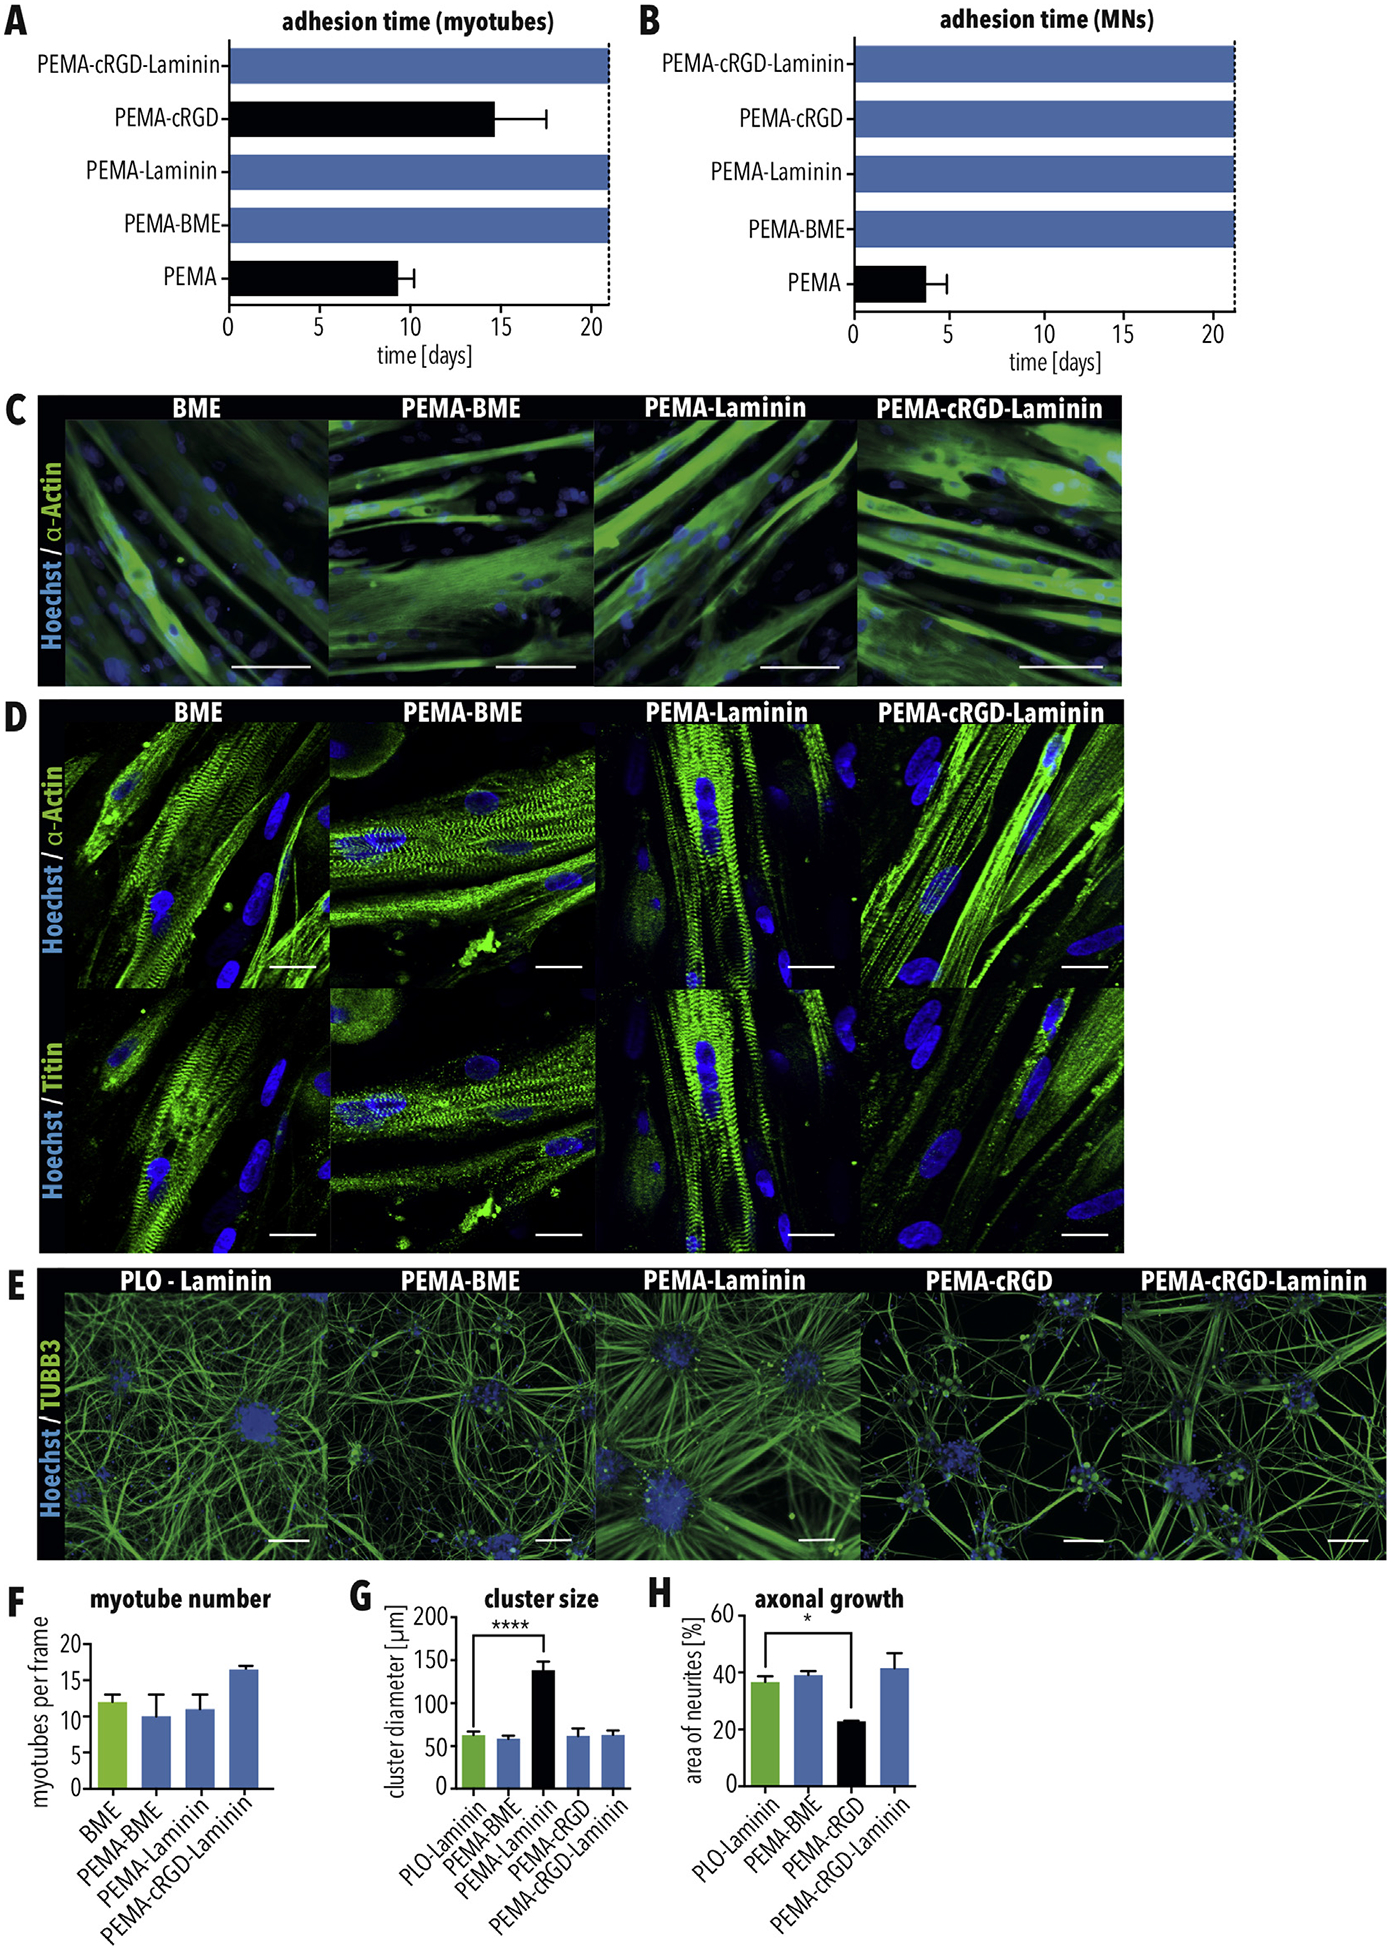
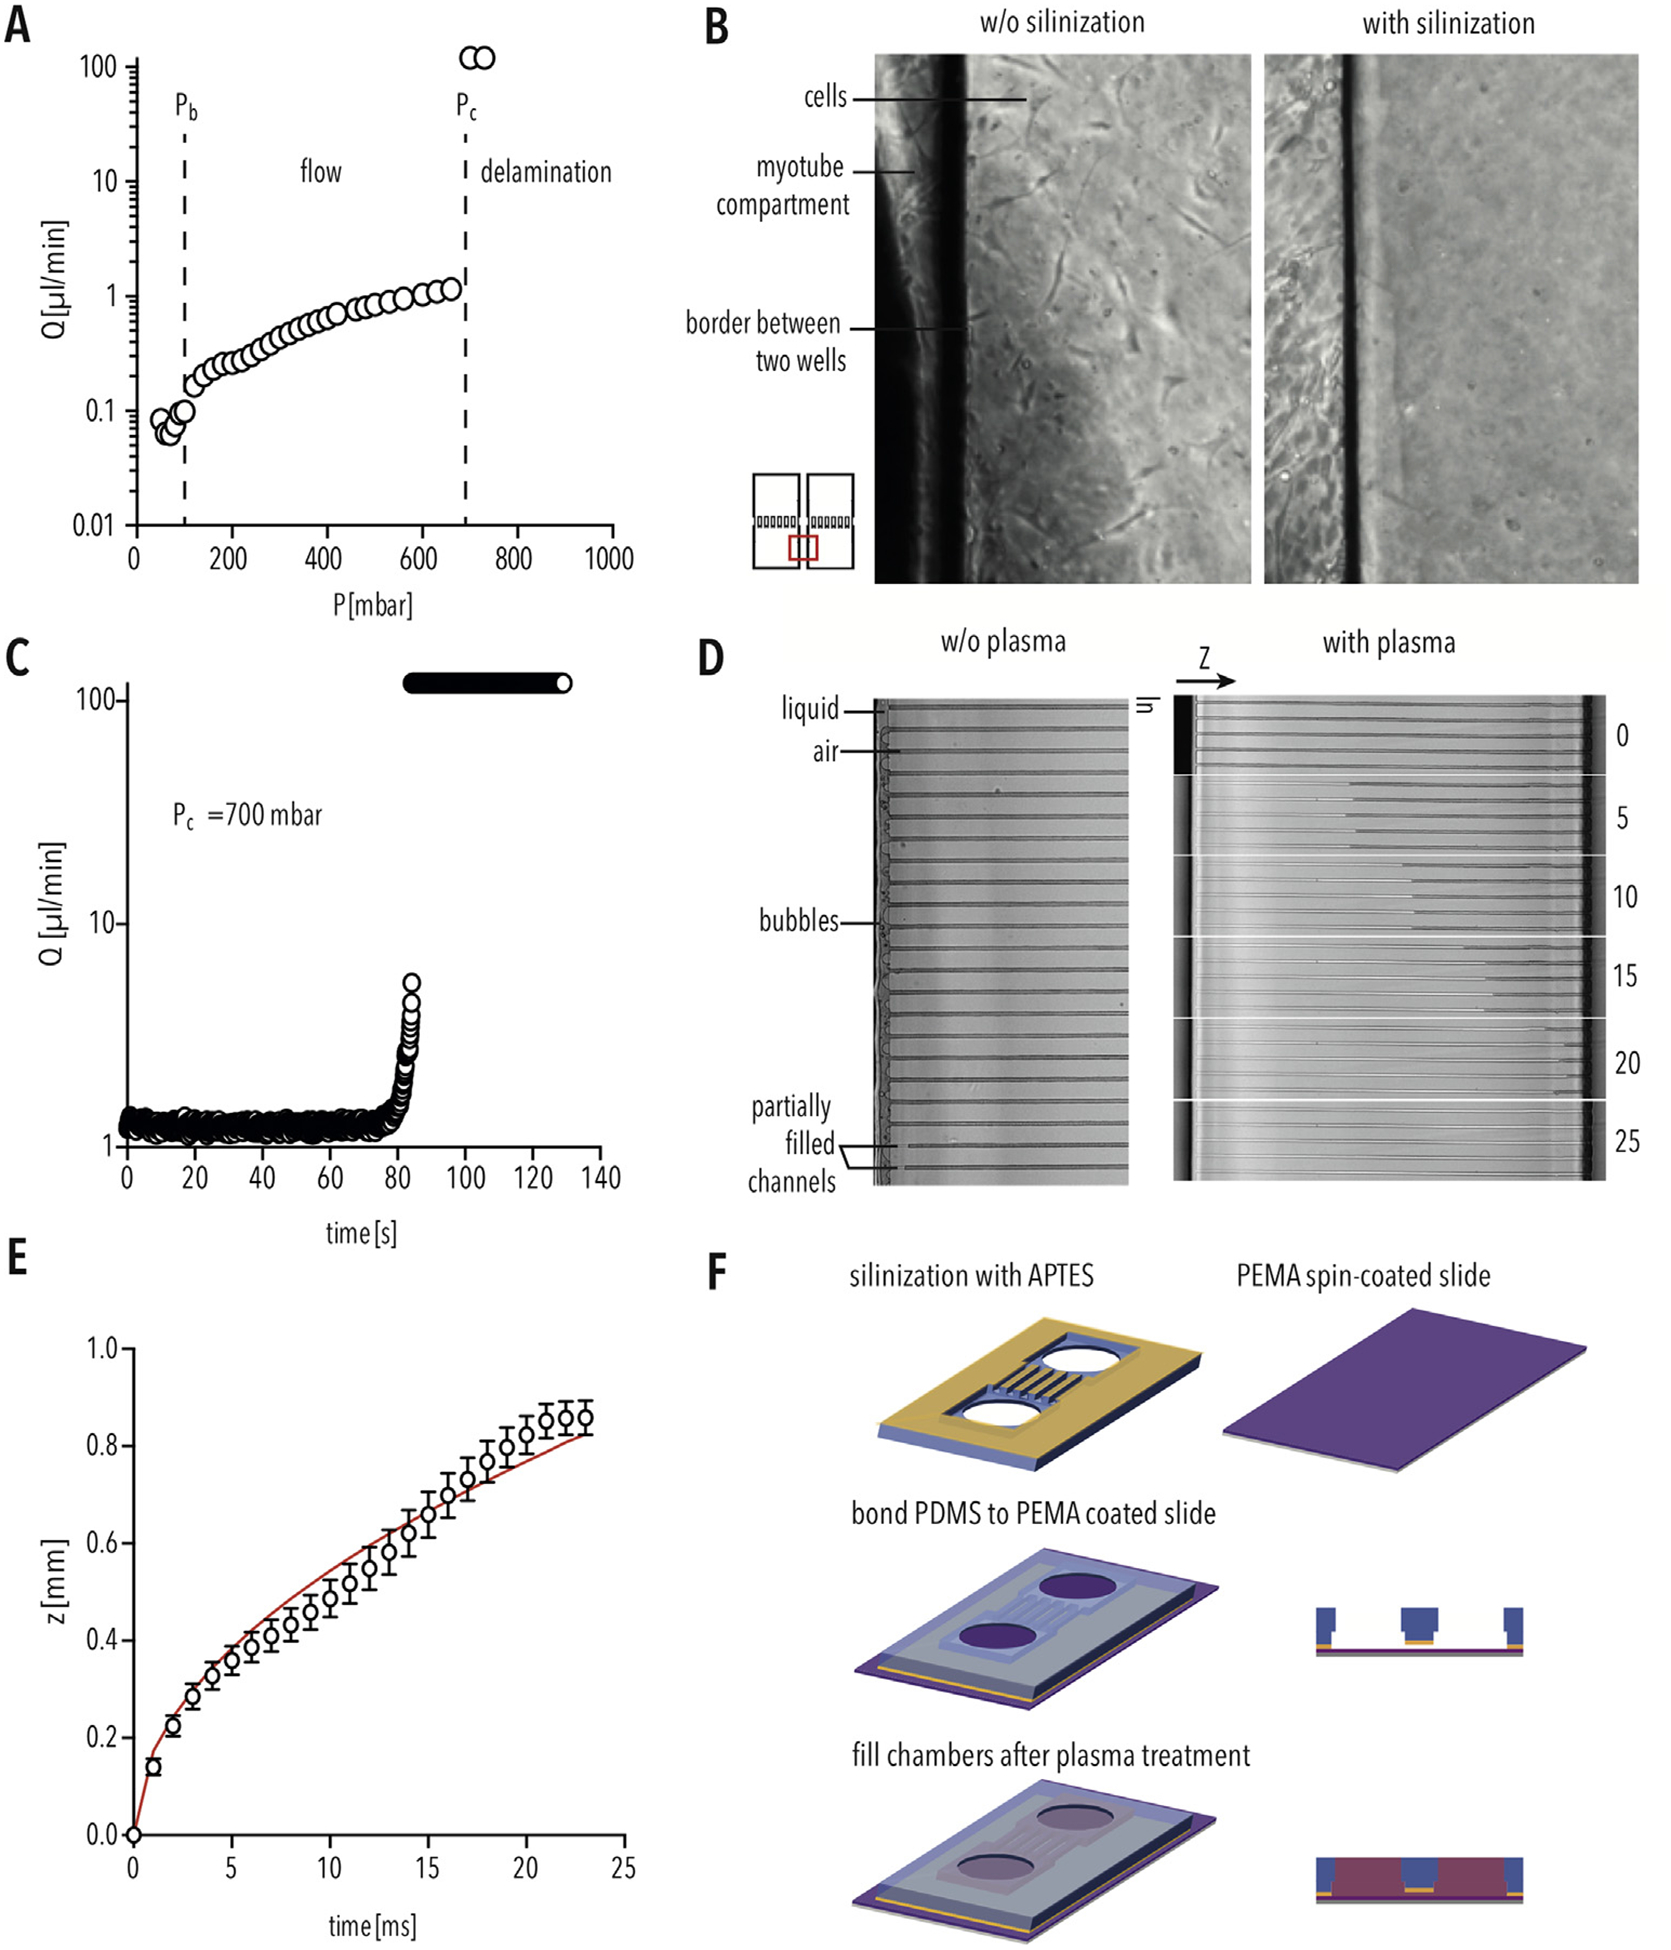
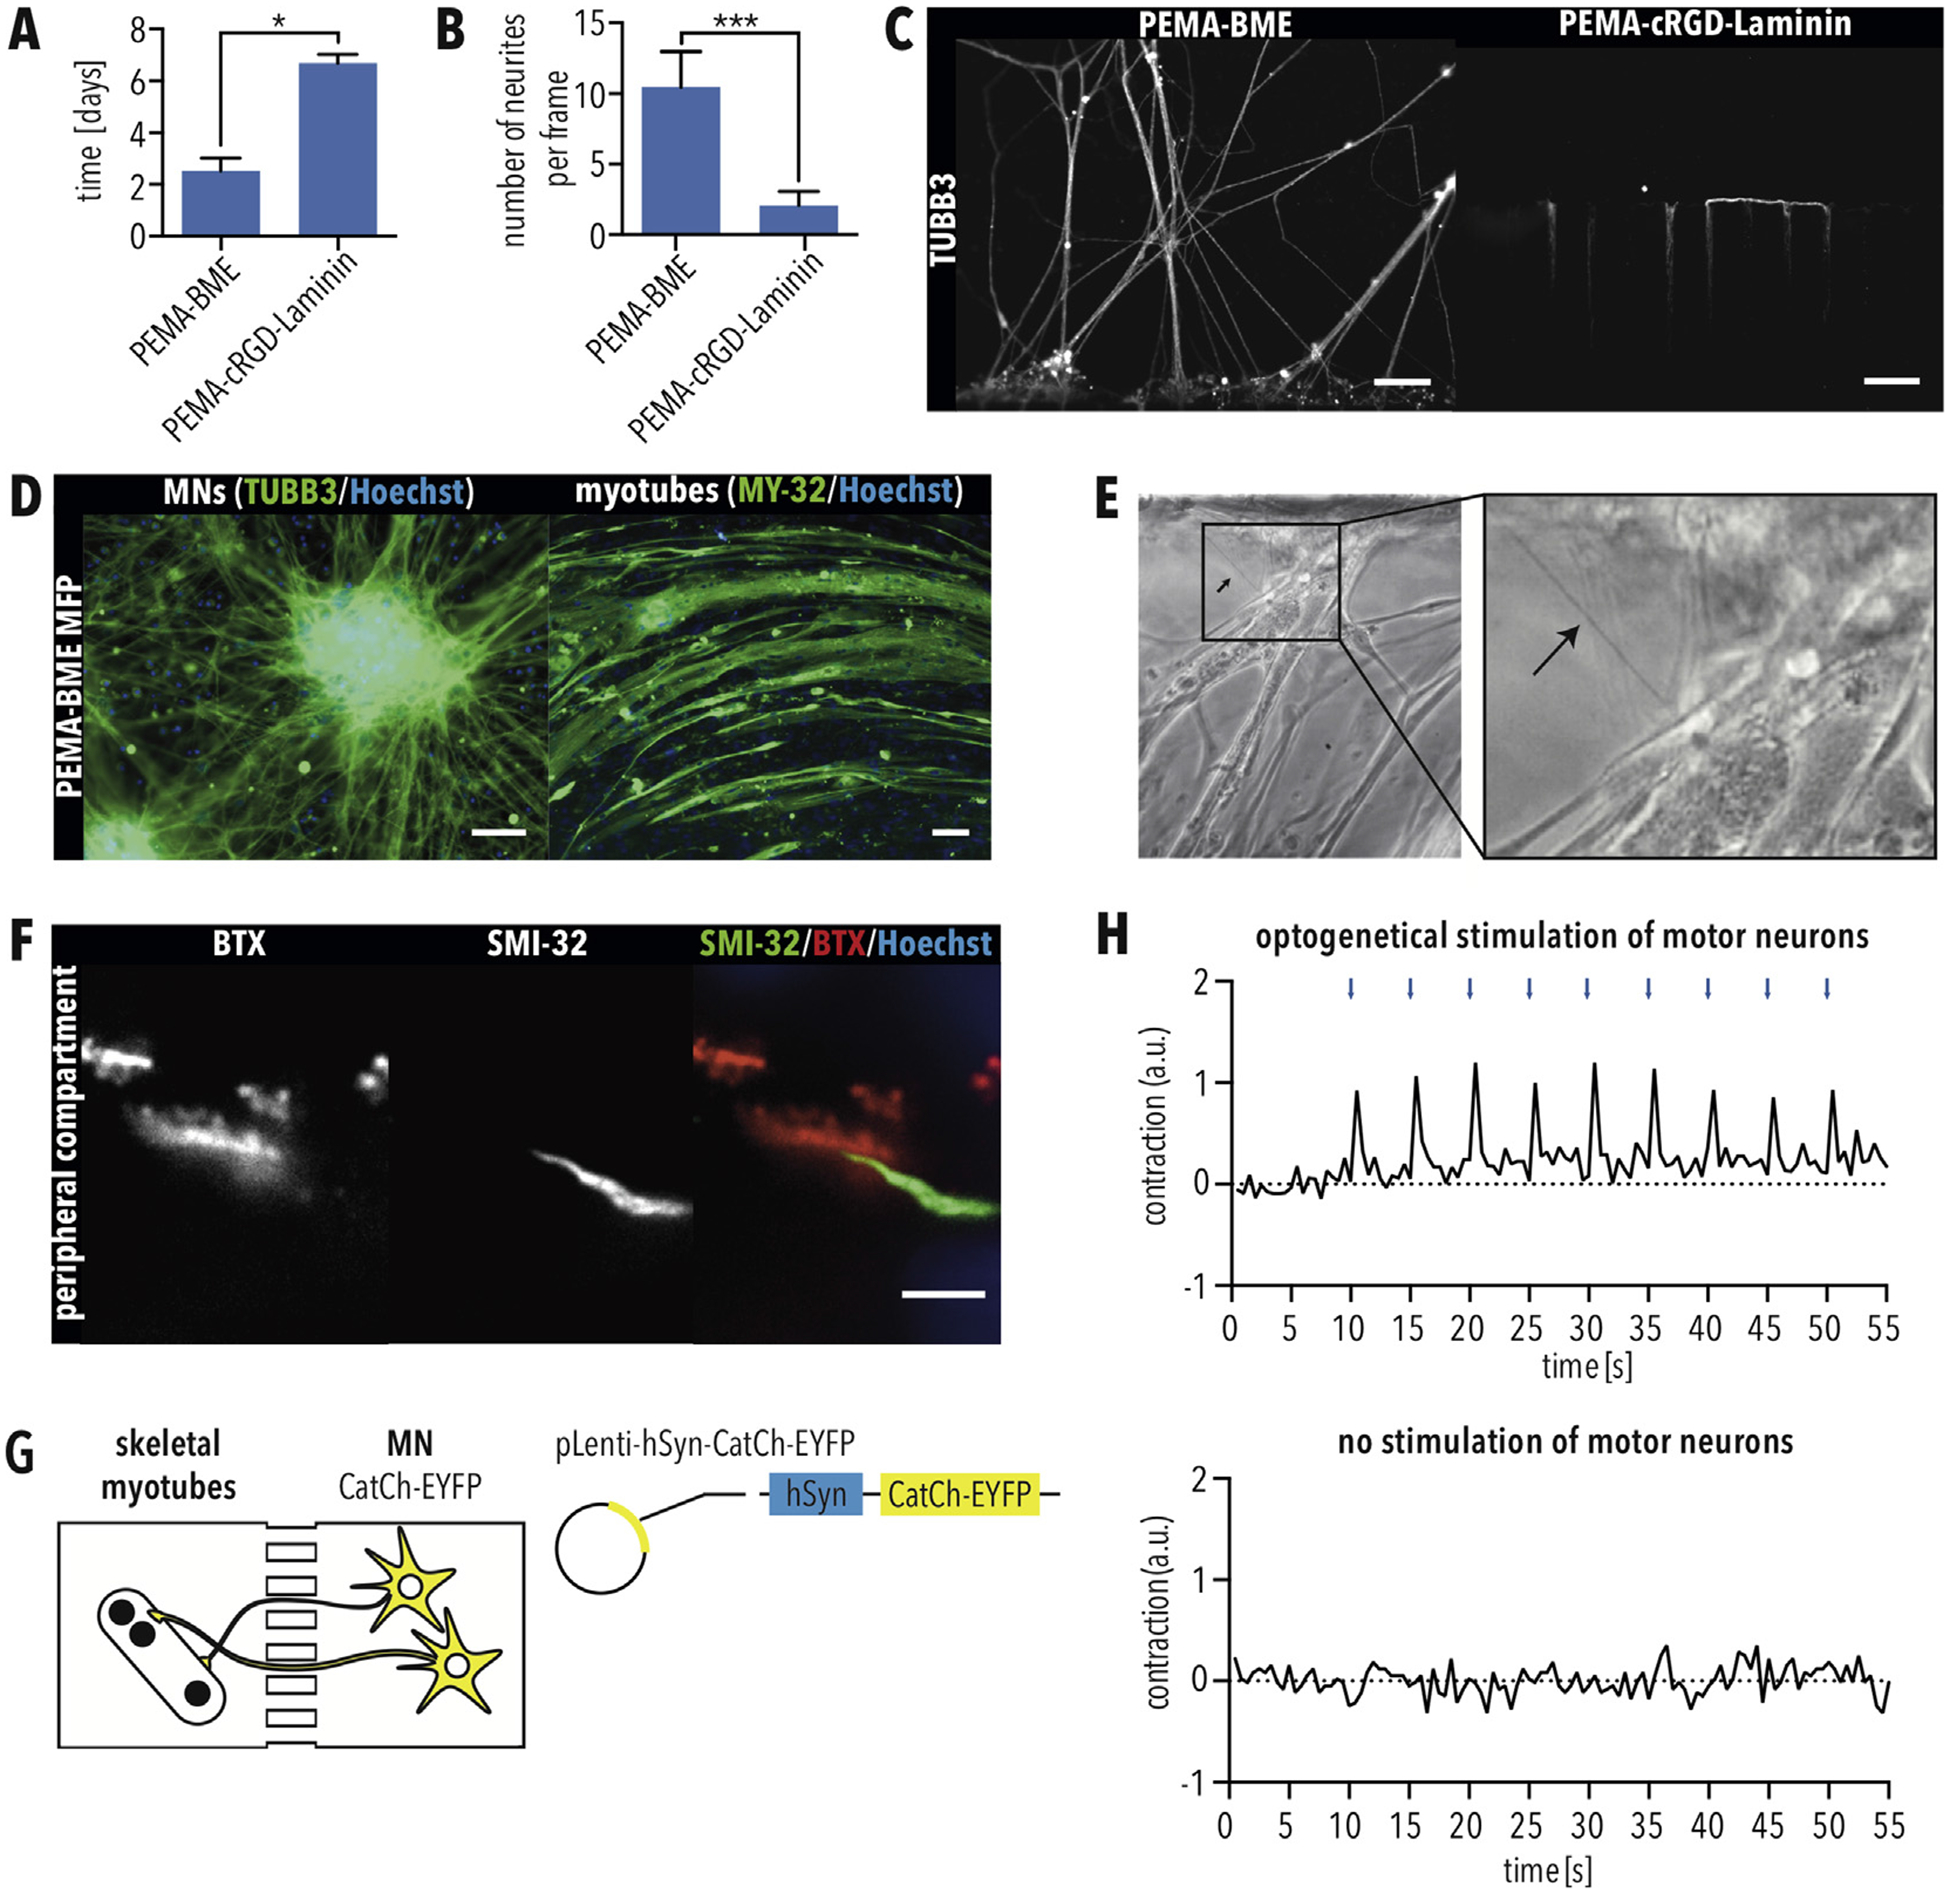
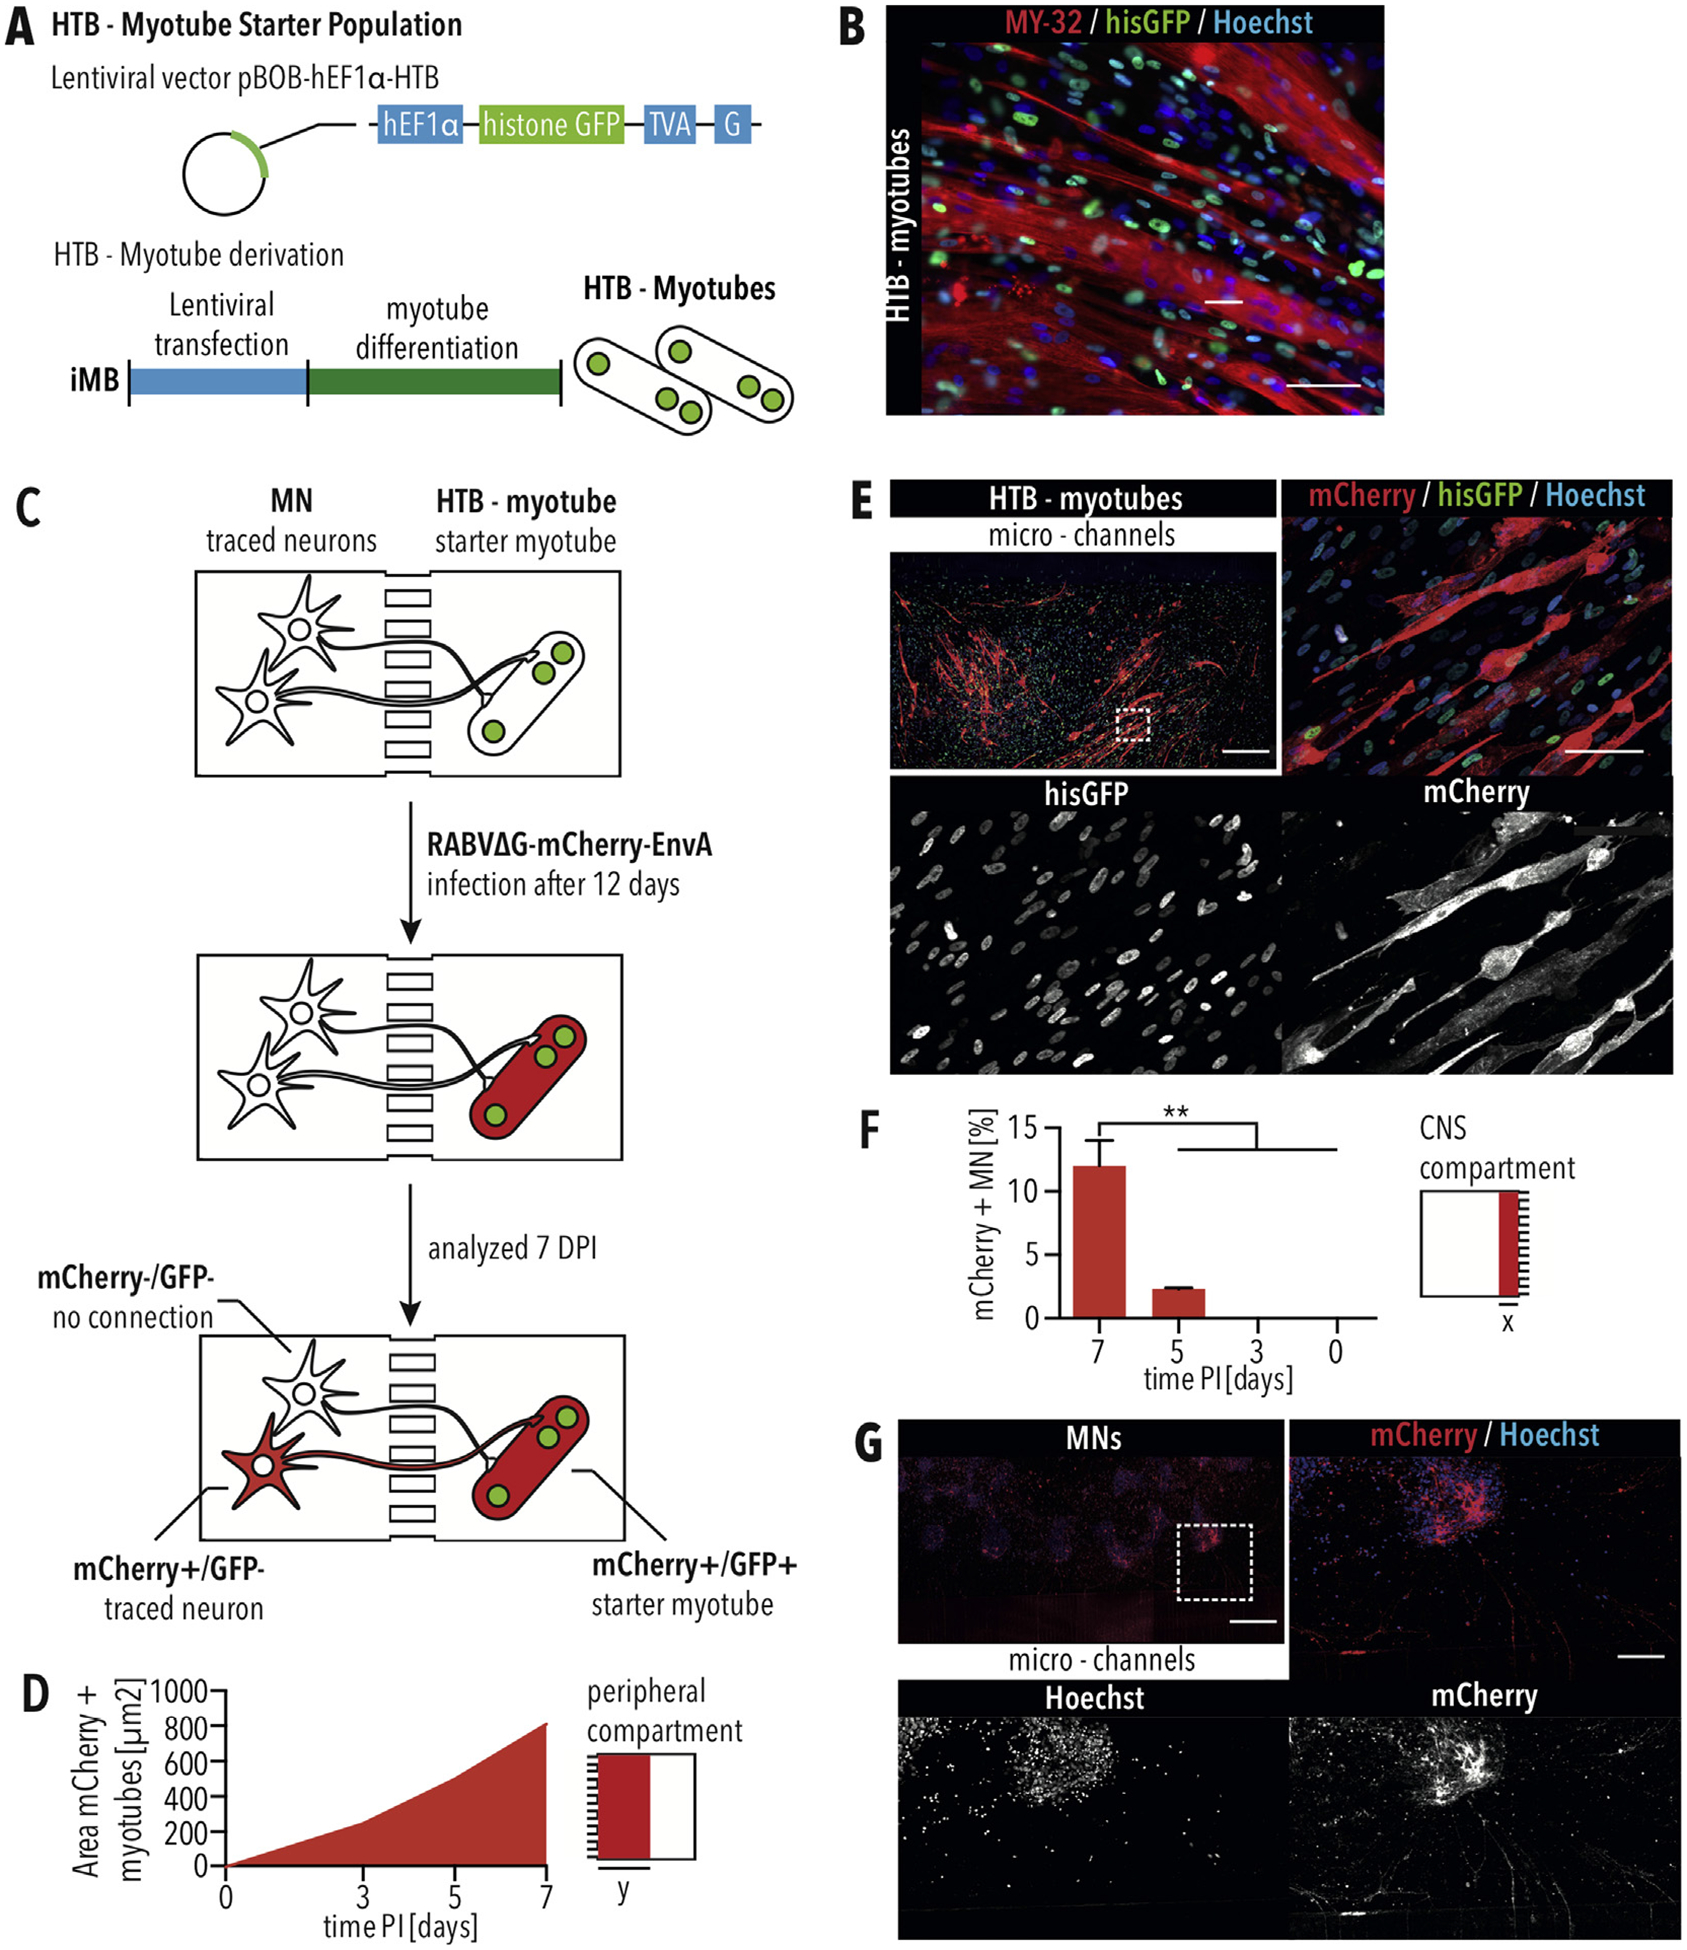
Neuromuscular circuits (NMCs) are vital for voluntary movement, and effective models of NMCs are needed to understand the pathogenesis of, as well as to identify effective treatments for, multiple diseases, including Duchenne's muscular dystrophy and amyotrophic lateral sclerosis. Microfluidics are ideal for recapitulating the central and peripheral compartments of NMCs, but myotubes often detach before functional NMCs are formed. In addition, microfluidic systems are often limited to a single experimental unit, which significantly limits their application in disease modeling and drug discovery. Here, we developed a microfluidic platform (MFP) containing over 100 experimental units, making it suitable for medium-throughput applications. To overcome detachment, we incorporated a reactive polymer surface allowing customization of the environment to culture different cell types. Using this approach, we identified conditions that enable long-term co-culture of human motor neurons and myotubes differentiated from human induced pluripotent stem cells inside our MFP. Optogenetics demonstrated the formation of functional NMCs. Furthermore, we developed a novel application of the rabies tracing assay to efficiently identify NMCs in our MFP. Therefore, our MFP enables large-scale generation and quantification of functional NMCs for disease modeling and pharmacological drug targeting.

Keywords: Microfluidics; Motor unit; Neuromuscular circuit; Rabies viral tracing; Skeletal muscle; poly(ethylene-alt-maleic anhydride).


Conflict of interest statement

Declaration of competing interest

The authors have no competing interests to declare.

Figures

Fig. 1.
Fig. 1.
Derivation of MNs and skeletal myotubes from iPSCs (A) Schematic of MN differentiation protocol. MNPs = motor neuron progenitors. (B) Immunostaining of iPSC-derived MNs for the neuronal markers MAP2 and TUBB3 and the MN markers CHAT, SMI-32 and Islet-1. Scale bar = 50 μm. (C) Quantification of MN differentiation efficiency using Islet-1 immunostaining. n = 3. Error bars show SEM. (D) Multi-electrode array recording of MNs showing spontaneous activity (base line), which can be blocked using 1 μM tetrodotoxin (TTX) treatment and recovered by washing out (E) Quantification of action potential frequency shows significant effect of TTX, which proves electrical activity of neurons. (F) Schematic of skeletal myotube differentiation protocol. Bars indicated SEM. ** and *** indicate p < 0.01 and 0.001, respectively, according to t-test. (G) Quantitative RT-PCR showing increased expression of the indicated skeletal myotube markers. Bars indicated SEM. * and ** indicate p < 0.05 and 0.01, respectively, according to one-way ANOVA and Dunnett’s multiple comparisons test. (H) Myotube contraction after contraction optogenetic stimulation using ChR2-EYFP with 20 ms blue light pulses (475 nm) at 0.2 Hz. (I) Skeletal myotubes differentiated from myoblasts show skeletal muscle marker expression (MY-32, titin, α-actinin) and striation. Scale bar = 25 μm. (J) Skeletal myotubes display acetylcholine receptor clusters visualized with fluorescently conjugated α-bungarotoxin (BTX). (For interpretation of the references to colour in this figure legend, the reader is referred to the Web version of this article.)
Fig. 2.
Fig. 2.
Microfluidic platform for modeling NMCs (A) Schematic of MFP design, including 126 experimental units each with two chambers. (B) The MFP is manufactured by polymerizing PDMS on a photoresist master, punching to access chambers, and assembled with a glass cover slip.
Fig. 3.
Fig. 3.
Motor neurons and skeletal myotubes have different adhesion requirements (A) Schematic of the CNS compartment inside one experimental unit of the MFP. (B) Immunostaining for TUBB3 of MNs inside the CNS compartment. Scale bar = 100 μm. Axons enter the micro-channels towards the peripheral compartment. Scale bar = 25 μm. (C) Axons of MNs exit the micro-channels into the peripheral compartment four days (4Ds) after plating in the CNS compartment. Scale bar = 50 μm. (D–E) Number of days that (D) skeletal myotubes and (E) MNs were attached on glass cover slips functionalized as indicated. (F) Size of clusters formed by MNs in MFPs using glass cover slips functionalized as indicated. Bars in all graphs indicate SEM. Green bars indicate the positive control condition. Black bars indicate coatings resulting in cell detachment. Blue bars indicate conditions selected for further testing. * and ** indicate p < 0.05 and 0.01, respectively, according to ordinary one-way ANOVA and Dunnett’s multiple comparisons test. (G) Immunostaining for TUBB3 of MNs in the CNS compartment using the indicated condition. Scale bar = 100 μm. (For interpretation of the references to colour in this figure legend, the reader is referred to the Web version of this article.)
Fig. 4.
Fig. 4.
PEMA-BME and PEMA-cRGD-Laminin are suitable coatings for culturing MNs and skeletal myotubes (A–B) Quantification of how long (A) myotubes and (B) MNs were attached when cultured as indicated. (C–D) Immunostaining of (C) myotubes for MY-32 (MyHC) (scale bar = 100 μm), which marks skeletal muscle, and (D) titin and α-actinin (scale bar = 25 μm) which marks sarcomeres which were cultured on glass cover slips functionalized as indicated. (E) Immunostaining of MNs for TUBB3, which were cultured on glass cover slips functionalized as indicated. Scale bar = 100 μm. (F) Quantification of myotubes after 21 days of culture as indicated. (G–H) Quantification of (G) cluster size and (H) axonal growth of MNs when cultured as indicated. Bars in all graphs indicate SEM. Green bars indicate the positive control condition. Black bars indicate coatings resulting in cell detachment. Blue bars indicate conditions selected for further testing. * and **** indicate p < 0.05 and 0.0001, respectively, according to ordinary one-way ANOVA and Dunnett’s multiple comparisons test. (For interpretation of the references to colour in this figure legend, the reader is referred to the Web version of this article.)
Fig. 5.
Fig. 5.
PEMA MFP device preparation using PDMS silanization and plasma treatment (A) Flowrate (μl/min) inside the PEMA-PDMS device corresponding to the applied pressure (mbar). Pb indicates capillarity back-pressure, the pressure required to fill the well. Pc indicates the critical pressure, the pressure at which the PDMS delaminates from the PEMA-coated cover slip. (B) Silanization of PDMS results in sufficient bonding to prevent cell growth between the compartments. (C) Flowrate (μl/min) inside the PEMA-PDMS device over the time period (s) at constant critical pressure (Pc) of 700 mbar. (D) Bright-field image of filling the micro-channels without (left) and with (right) air plasma treatment. (E) Covered length (z) for water penetration inside the air plasma treated micro-channels over a time period (ms). The solid red line is the best fit curve by z = A∙(time)0.5 [24]. Bars indicate SD. (F) Schematic of PEMA MFP preparation. (For interpretation of the references to colour in this figure legend, the reader is referred to the Web version of this article.)
Fig. 6.
Fig. 6.
Formation of functional motor units using MFPs with PEMA-BME (A–B) Quantification of (A) days required for MN axons to grow through the micro-channels and (B) number of MN axons per image. Error bars indicate SEM. * and *** indicate p < 0.05 and 0.001, respectively, according to unpaired T-test with Welch’s correction. (C) Immunostaining for TUBB3 of MNs axons exiting the micro-channels when cultured as indicated. Scale bar = 50 μm. (D) Immunostaining of MNs and myotubes for TUBB3 and MY-32, respectively, when cultured in MFPs with PEMA-BME for 21 days. Scale bar = 50 μm. (E) Phase contrast image showing axons of MNs exiting micro-channels and attaching to myotubes in the peripheral compartment. (F) Immunostaining of neuromuscular junctions (NMJs) using the MN marker SMI-32 as well as fluorescently conjugated BTX, which labels acetylcholine receptors. Scale bar = 5 μm. (G) Schematic of optogenetic set up. MNs and myotubes were cultivated in the PEMA-BME MFP, and MNs were infected with a lentivirus carrying CatCh-EYFP under a Synapsin promotor (SynP). (H) 10 days after infection cultures were illuminated with 200 ms blue light (475 nm) pulses every 5 s (0.2 Hz). Contraction was quantified by change in pixel. Myotubes showed contraction in response to light pulses. Contraction was not recorded without stimulation. (For interpretation of the references to colour in this figure legend, the reader is referred to the Web version of this article.)
Fig. 7.
Fig. 7.
Rabies tracing of NMCs using MFPs with PEMA-BME (A) The starter skeletal myotubes are derived by transfecting myoblast cells with the pBOB-hEF1α-HTB lentivector carrying the EnvA receptor (TVA), histone GFP (hisGFP), and the RABV G protein under the control of a hEF1α promotor followed by differentiation into skeletal myotubes. (B) The HTB-myotube starter population shows nuclear GFP and expresses the skeletal muscle marker MY-32. Scale bar = 50 μm. (C) Diagram of retrograde monosynaptic tracing inside the microfluidic platform. (D) Quantification of the mCherry-positive area within the peripheral compartment of 1700 μm (y) from the micro-channels for myotubes expressing the mCherry reporter. (E) mCherry-positive myotubes within the peripheral compartment seven days following infection. Scale bar of tile scan = 500 μm. Dashed square marks position of close up. Scale bar of close up = 100 μm. (F) Quantification of traced MNs, which are mCherry-positive, in an area of 725 μm (x) from the micro-channels. The greatest number of traced MNs were detected seven days following infecting the HTB-myotubes with RABVΔG-mCherry-EnvA. Error bars indicate standard error of the mean (SEM). ** indicates p < 0.01, according to one-way ANOVA and Dunnett’s multiple comparisons test. (G) mCherry-positive traced MNs in the CNS compartment seven days following infection. Scale bar of tile scan = 500 μm. Dashed square marks position of close up. Scale bar of close up = 100 μm.

References

    1. Parone PA, Da Cruz S, Han JS, McAlonis-Downes M, Vetto AP, Lee SK, Tseng E, Cleveland DW, Enhancing mitochondrial calcium buffering capacity reduces aggregation of misfolded SOD1 and motor neuron cell death without extending survival in mouse models of inherited amyotrophic lateral sclerosis, J. Neurosci 33 (11) (2013) 4657–4671. - PMC - PubMed
    1. Kanning KC, Kaplan A, Henderson CE, Motor neuron diversity in development and disease, Annu. Rev. Neurosci 33 (2010) 409–440. - PubMed
    1. McGreevy JW, Hakim CH, McIntosh MA, Duan D, Animal models of Duchenne muscular dystrophy: from basic mechanisms to gene therapy, Dis. Model Mech 8 (3) (2015) 195–213. - PMC - PubMed
    1. Wells DJ, Tracking progress: an update on animal models for Duchenne muscular dystrophy, Dis. Model Mech 11 (6) (2018). - PMC - PubMed
    1. Edens BM, Ajroud-Driss S, Ma L, Ma YC, Molecular mechanisms and animal models of spinal muscular atrophy, Biochim. Biophys. Acta 1852 (4) (2015) 685–692. - PubMed

Publication types

MeSH terms