

A systematic survey of regional multi-taxon biodiversity: evaluating strategies and coverage
- PMID: 31615504
- PMCID: PMC6792264
- DOI: 10.1186/s12898-019-0260-x
A systematic survey of regional multi-taxon biodiversity: evaluating strategies and coverage
Abstract
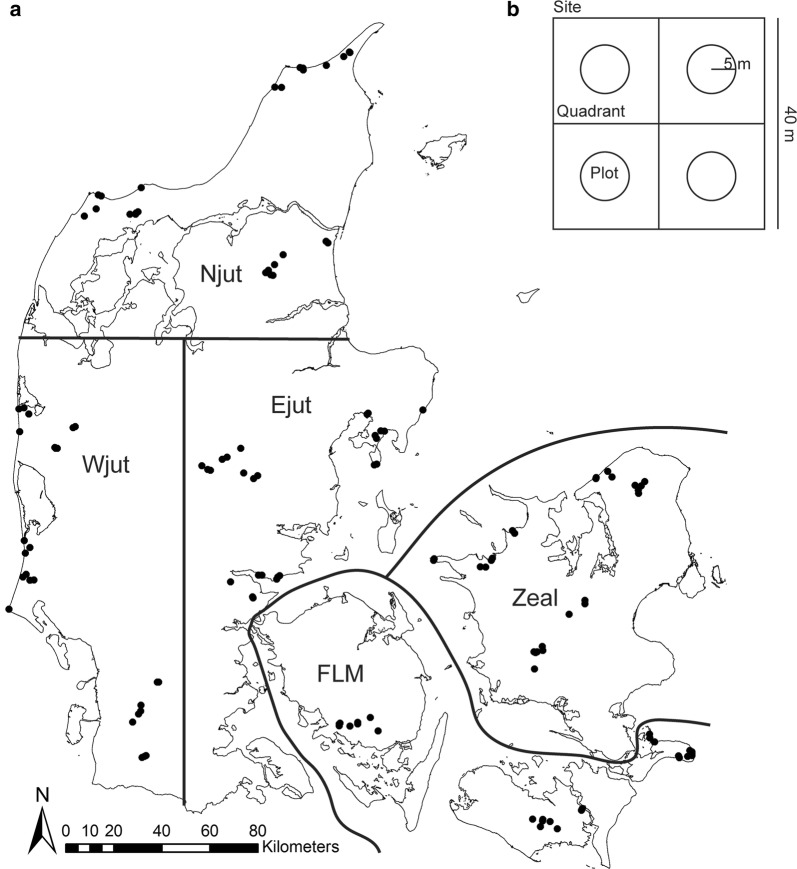
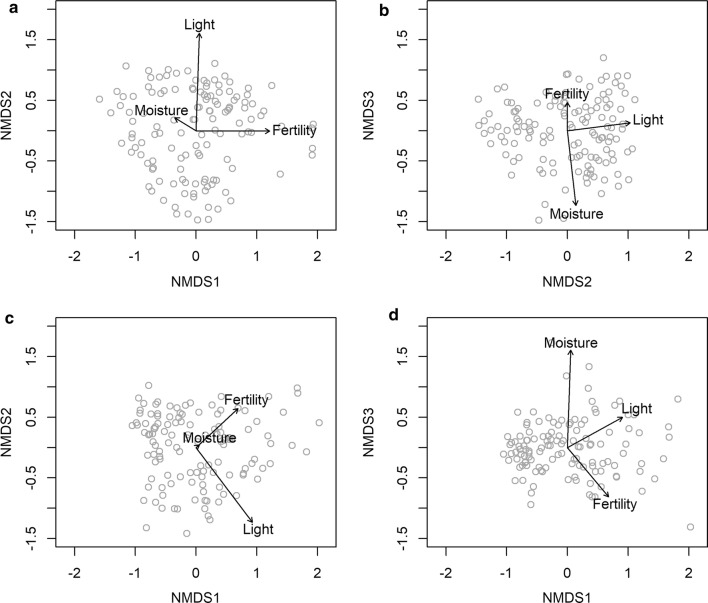
Background: In light of the biodiversity crisis and our limited ability to explain variation in biodiversity, tools to quantify spatial and temporal variation in biodiversity and its underlying drivers are critically needed. Inspired by the recently published ecospace framework, we developed and tested a sampling design for environmental and biotic mapping. We selected 130 study sites (40 × 40 m) across Denmark using stratified random sampling along the major environmental gradients underlying biotic variation. Using standardized methods, we collected site species data on vascular plants, bryophytes, macrofungi, lichens, gastropods and arthropods. To evaluate sampling efficiency, we calculated regional coverage (relative to the known species number per taxonomic group), and site scale coverage (i.e., sample completeness per taxonomic group at each site). To extend taxonomic coverage to organisms that are difficult to sample by classical inventories (e.g., nematodes and non-fruiting fungi), we collected soil for metabarcoding. Finally, to assess site conditions, we mapped abiotic conditions, biotic resources and habitat continuity.
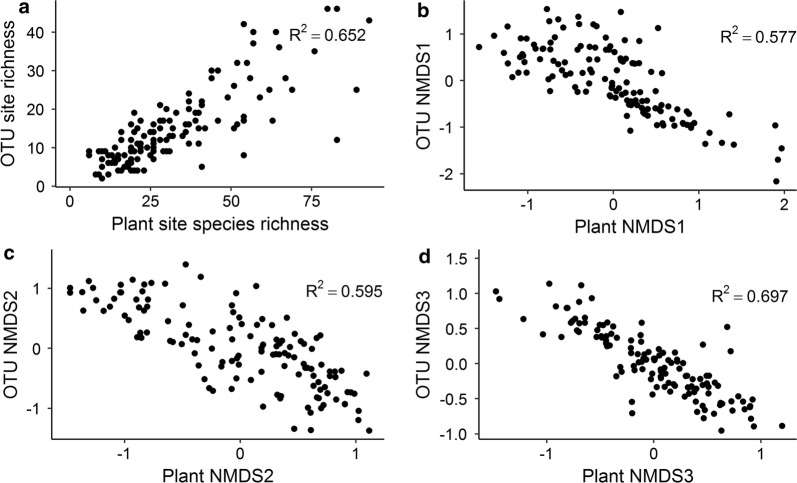
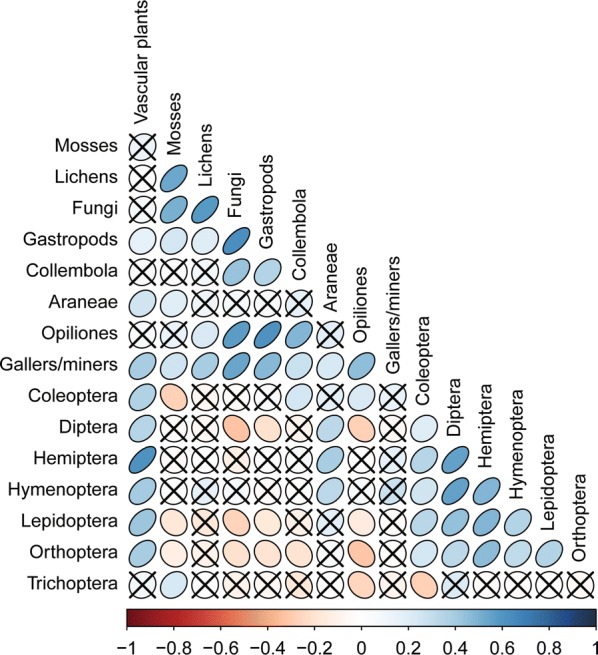
Results: Despite the 130 study sites only covering a minute fraction (0.0005%) of the total Danish terrestrial area, we found 1774 species of macrofungi (54% of the Danish fungal species pool), 663 vascular plant species (42%), 254 bryophyte species (41%) and 200 lichen species (19%). For arthropods, we observed 330 spider species (58%), 123 carabid beetle species (37%) and 99 hoverfly species (33%). Overall, sample coverage was remarkably high across taxonomic groups and sufficient to capture substantial spatial variation in biodiversity across Denmark. This inventory is nationally unprecedented in detail and resulted in the discovery of 143 species with no previous record for Denmark. Comparison between plant OTUs detected in soil DNA and observed plant species confirmed the usefulness of carefully curated environmental DNA-data. Correlations among species richness for taxonomic groups were predominantly positive, but did not correlate well among all taxa suggesting differential and complex biotic responses to environmental variation.
Conclusions: We successfully and adequately sampled a wide range of diverse taxa along key environmental gradients across Denmark using an approach that includes multi-taxon biodiversity assessment and ecospace mapping. Our approach is applicable to assessments of biodiversity in other regions and biomes where species are structured along environmental gradient.
Keywords: Abiotic gradients; Biotic factors; Continuity; Denmark; Disturbance; Moisture; Productivity; eDNA.
Conflict of interest statement
The authors declare that they have no competing interests.
Figures
References
-
- Jetz W, McPherson JM, Guralnick RP. Integrating biodiversity distribution knowledge: toward a global map of life. Trends Ecol Evol. 2012;27(3):151–159. - PubMed
-
- Isaac NJB, van Strien AJ, August TA, de Zeeuw MP, Roy DB. Statistics for citizen science: extracting signals of change from noisy ecological data. Methods Ecol Evol. 2014;5(10):1052–1060.
-
- Nichols JD, Williams BK. Monitoring for conservation. Trends Ecol Evol. 2006;21(12):668–673. - PubMed
-
- Taberlet P, Coissac E, Pompanon F, Brochmann C, Willerslev E. Towards next-generation biodiversity assessment using DNA metabarcoding. Mol Ecol. 2012;21(8):2045–2050. - PubMed
Publication types
MeSH terms
LinkOut - more resources
Full Text Sources
Other Literature Sources
