. 2019 Oct 15;26(11):436-448.
doi: 10.1101/lm.049866.119. Print 2019 Nov.

Developmental changes in plasticity, synaptic, glia, and connectivity protein levels in rat basolateral amygdala

Affiliations

Developmental changes in plasticity, synaptic, glia, and connectivity protein levels in rat basolateral amygdala

Benjamin Bessières et al. Learn Mem. .

Abstract

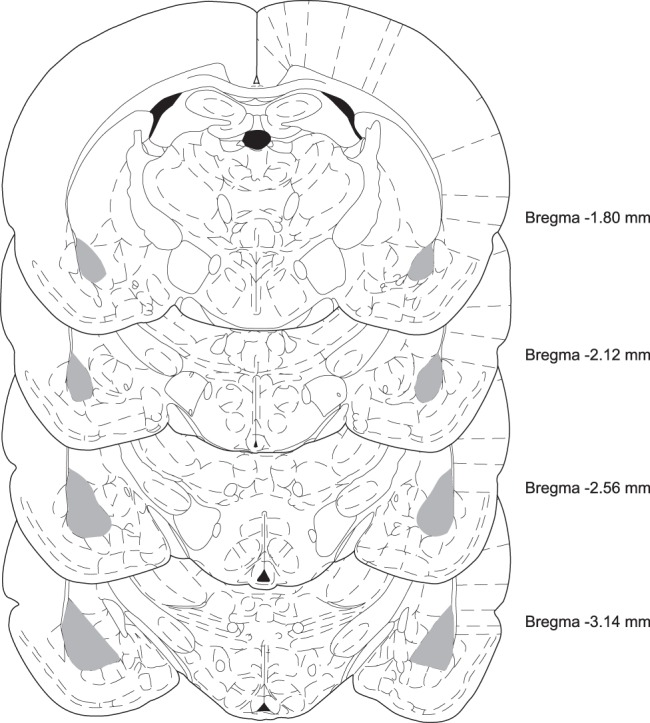
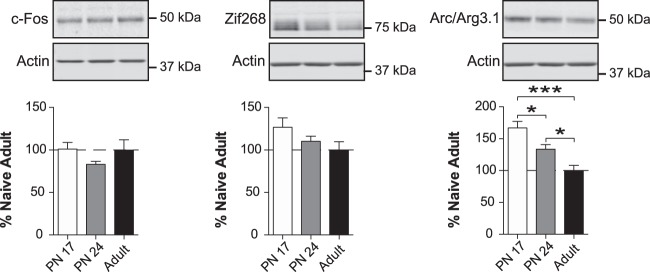
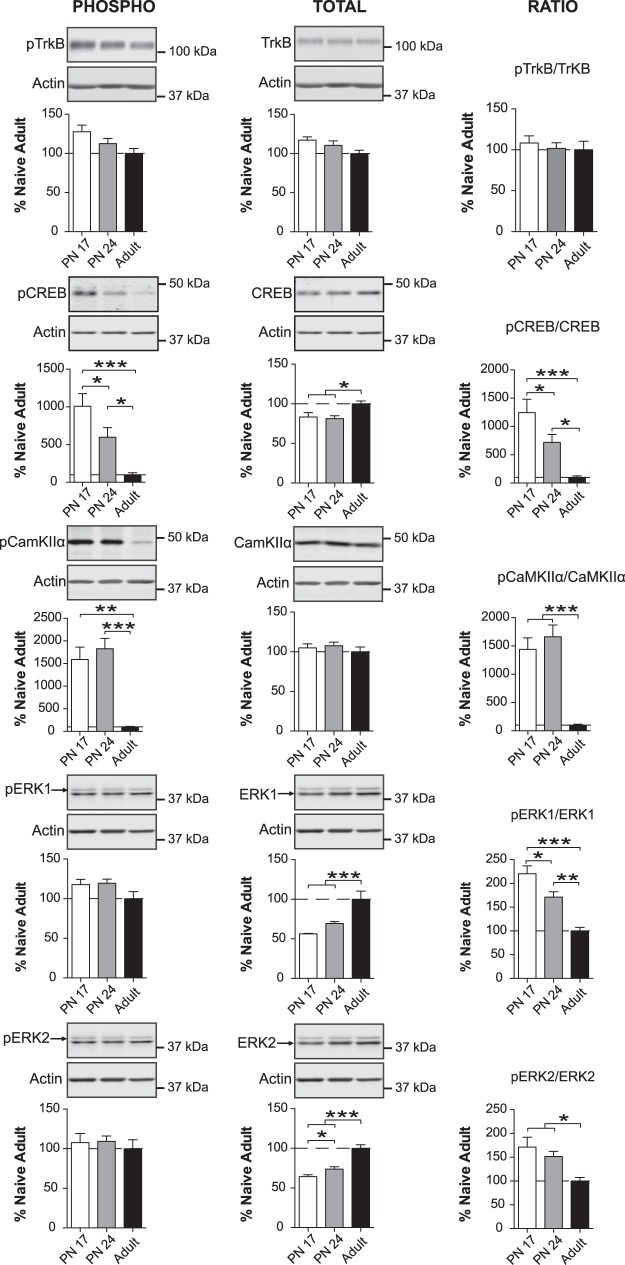
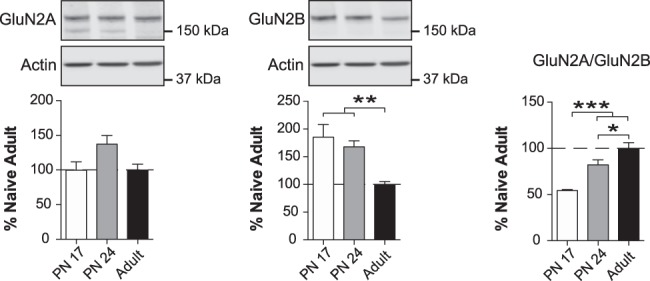
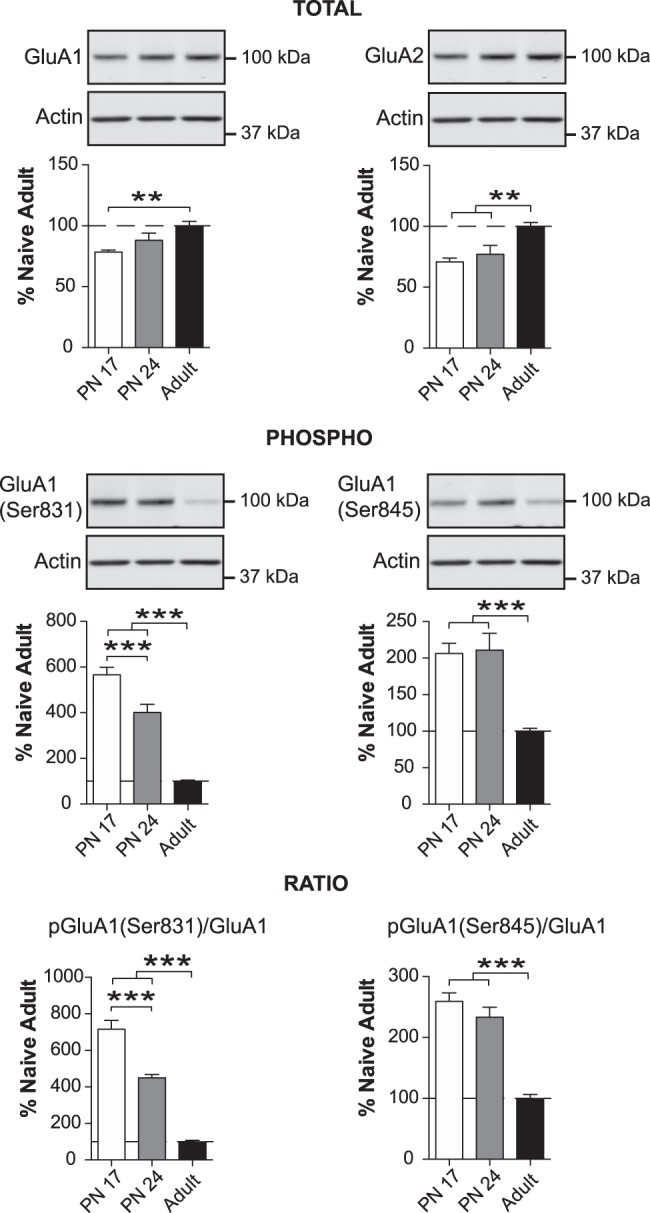
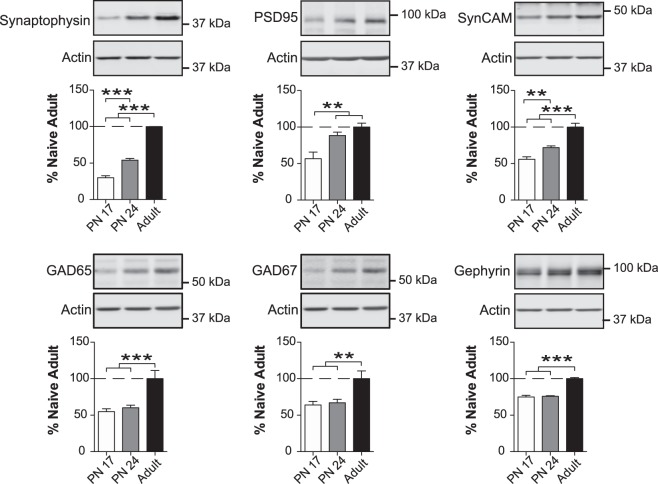
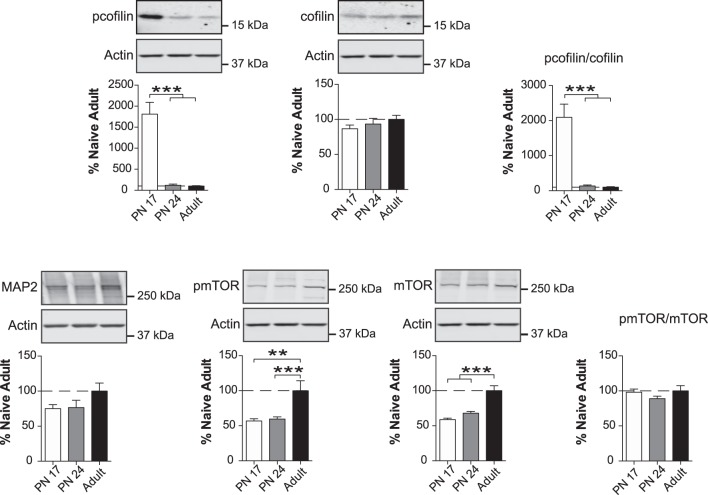
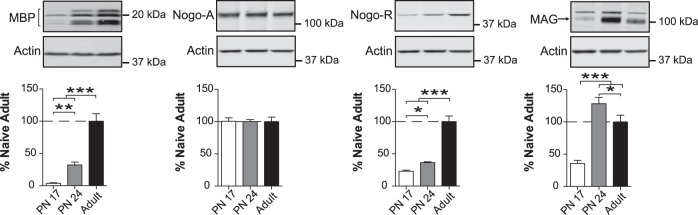
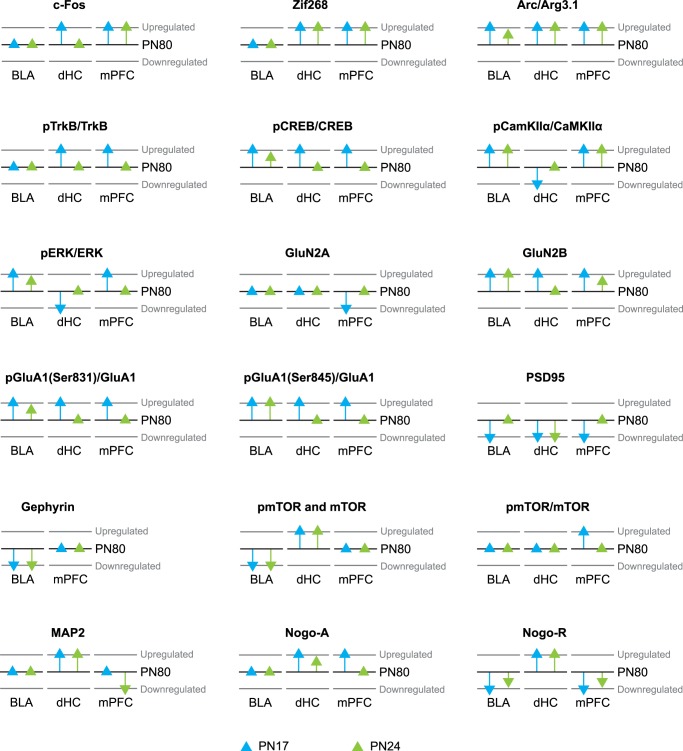
The basolateral complex of amygdala (BLA) processes emotionally arousing aversive and rewarding experiences. The BLA is critical for acquisition and storage of threat-based memories and the modulation of the consolidation of arousing explicit memories, that is, the memories that are encoded and stored by the medial temporal lobe. In addition, in conjunction with the medial prefrontal cortex (mPFC), the BLA plays an important role in fear memory extinction. The BLA develops relatively early in life, but little is known about the molecular changes that accompany its development. Here, we quantified relative basal expression levels of sets of plasticity, synaptic, glia, and connectivity proteins in the rat BLA at various developmental ages: postnatal day 17 (PN17, infants), PN24 (juveniles), and PN80 (young adults). We found that the levels of activation markers of brain plasticity, including phosphorylation of CREB at Ser133, CamKIIα at Thr286, pERK1/pERK2 at Thr202/Tyr204, and GluA1 at Ser831 and Ser845, were significantly higher in infant and juvenile compared with adult brain. In contrast, age increase was accompanied by a significant augmentation in the levels of proteins that mark synaptogenesis and synapse maturation, such as synaptophysin, PSD95, SynCAM, GAD65, GAD67, and GluN2A/GluN2B ratio. Finally, we observed significant age-associated changes in structural markers, including MAP2, MBP, and MAG, suggesting that the structural connectivity of the BLA increases over time. The biological differences in the BLA between developmental ages compared with adulthood suggest the need for caution in extrapolating conclusions based on BLA-related brain plasticity and behavioral studies conducted at different developmental stages.


Figures

Figure 1.
Figure 1.
Coordinates of rat basolateral amygdala (BLA) (modified from Paxinos and Watson 2005), indicating the area isolated by micropunches (in gray) in adult (PN80) brains. The BLAs at all ages were identified and collected using the same anatomical references in each coronal section: the shape of dHC, medial eminence, third ventricle, rhinal fissure, external capsule, and optic tract.
Figure 2.
Figure 2.
The level of Arc, but not Zif268 or c-Fos, decreased from early development to adulthood. Densitometric western blot analyses were performed on total protein extracts of BLA obtained from rats euthanized at PN17 (white, n = 6), PN24 (gray, n = 7), or PN80 (adult; black, n = 4). Data are expressed as mean percentage ± SEM of adult rat levels. One-way ANOVA followed by Newman–Keuls post-hoc tests: (*) P < 0.05; (***) P < 0.001.
Figure 3.
Figure 3.
pCREB/CREB, pCamKII/CamKII, pERK1/ERK1, and pERK2/ERK2 ratios decrease massively from early development to adulthood. Densitometric western blot analyses were performed on total protein extracts of BLA from rats euthanized at PN17 (white, n = 6), PN24 (gray, n = 6–7), or PN80 (adult; black, n = 4–5). Data are expressed as mean percentage ± SEM of adult rat levels. One-way ANOVA followed by Newman–Keuls post-hoc tests: (*) P < 0.05; (**) P < 0.01; (***) P < 0.001.
Figure 4.
Figure 4.
The GluN2A/GluN2B NMDAR subunit ratio increases over the course of development. Densitometric western blot analyses were performed on total protein extracts of BLA from rats euthanized at PN17 (white, n = 6), PN24 (gray, n = 7), or PN80 (adult; black, n = 7). Data are expressed as mean percentage ± SEM of adult rat levels. One-way ANOVA followed by Newman–Keuls post-hoc tests: (*) P < 0.05; (**) P < 0.01; (***) P < 0.001.
Figure 5.
Figure 5.
GluA1 and GluA2 AMPAR subunit levels increase, whereas Ser831 and Ser845 phosphorylation of GluA1 decrease, over the course of development. Densitometric western blot analyses were performed on total protein extracts of BLA from rats euthanized at PN17 (white, n = 6), PN24 (gray, n = 7) or PN80 (adult; black, n = 7). Data are expressed as mean percentage ± SEM of adult rat levels. One-way ANOVA followed by Newman–Keuls post-hoc tests: (**) P < 0.01; (***) P < 0.001.
Figure 6.
Figure 6.
Excitatory and inhibitory synapse maturation markers increase over the course of development. Densitometric western blot analyses were performed on total protein extracts of BLA from rats euthanized at PN17 (white, n = 6), PN24 (gray, n = 7), or PN80 (adult; black, n = 4–6). Data are expressed as mean percentage ± SEM of adult rat levels. One-way ANOVA followed by Newman–Keuls post-hoc tests: (**) P < 0.01; (***) P < 0.001.
Figure 7.
Figure 7.
Neurite connectivity markers change over the course of development. Densitometric western blot analyses were performed on total protein extracts of BLA from rats euthanized at PN17 (white, n = 5–6), PN24 (gray, n = 7) or PN80 (adult; black, n = 4–6). Data are expressed as mean percentage ± SEM of adult rat levels. One-way ANOVA followed by Newman–Keuls post-hoc tests: (**) P < 0.01; (***) P < 0.001.
Figure 8.
Figure 8.
Myelination markers change over the course of development. Densitometric western blot analyses were performed on total protein extracts of BLA from rats euthanized at PN17 (white, n = 6), PN24 (gray, n = 7) or PN80 (adult; black, n = 4–5). Data are expressed as mean percentage ± SEM of adult rat levels. One-way ANOVA followed by Newman–Keuls post-hoc tests: (*) P < 0.05; (**) P < 0.01; (***) P < 0.001.
Figure 9.
Figure 9.
Graphic representation depicting increases or decreases of protein levels at PN17 and PN24 relative to PN80 in the rat BLA, dHC (Travaglia et al. 2016a,b), and mPFC (Jia et al. 2018). The black lines denote the level of each marker at PN80, which was used as a relative reference. Blue and green triangles depict PN17 and PN24 markers, respectively. A triangle placed on the PN80 black line indicates no significant change compared with PN80 and the directions of the arrows indicate significant up-regulation or down-regulation of the protein levels. Only markers that exhibit differential progression over ages in the different regions are shown.

References

    1. Akbik F, Cafferty WB, Strittmatter SM. 2012. Myelin associated inhibitors: a link between injury-induced and experience-dependent plasticity. Exp Neurol 235: 43–52. 10.1016/j.expneurol.2011.06.006 - DOI - PMC - PubMed
    1. Alberini CM. 2009. Transcription factors in long-term memory and synaptic plasticity. Physiol Rev 89: 121–145. 10.1152/physrev.00017.2008 - DOI - PMC - PubMed
    1. Alberini CM, Kandel ER. 2015. The regulation of transcription in memory consolidation. Cold Spring Harb Perspect Biol 7: a021741 10.1101/cshperspect.a021741 - DOI - PMC - PubMed
    1. Alberini CM, Travaglia A. 2017. Infantile amnesia: a critical period of learning to learn and remember. J Neurosci 37: 5783–5795. 10.1523/JNEUROSCI.0324-17.2017 - DOI - PMC - PubMed
    1. Almeida RG, Lyons DA. 2017. On myelinated axon plasticity and neuronal circuit formation and function. J Neurosci 37: 10023–10034. 10.1523/JNEUROSCI.3185-16.2017 - DOI - PMC - PubMed

Publication types

LinkOut - more resources