. 2019 Nov 22;294(47):17988-18001.
doi: 10.1074/jbc.RA119.011059. Epub 2019 Oct 15.

Staphylopine and pseudopaline dehydrogenase from bacterial pathogens catalyze reversible reactions and produce stereospecific metallophores

Affiliations

Staphylopine and pseudopaline dehydrogenase from bacterial pathogens catalyze reversible reactions and produce stereospecific metallophores

Jeffrey S McFarlane et al. J Biol Chem. .

Abstract

Pseudopaline and staphylopine are opine metallophores biosynthesized by Pseudomonas aeruginosa and Staphylococcus aureus, respectively. The final step in opine metallophore biosynthesis is the condensation of the product of a nicotianamine (NA) synthase reaction (i.e. l-HisNA for pseudopaline and d-HisNA for staphylopine) with an α-keto acid (α-ketoglutarate for pseudopaline and pyruvate for staphylopine), which is performed by an opine dehydrogenase. We hypothesized that the opine dehydrogenase reaction would be reversible only for the opine metallophore product with (R)-stereochemistry at carbon C2 of the α-keto acid (prochiral prior to catalysis). A kinetic analysis using stopped-flow spectrometry with (R)- or (S)-staphylopine and kinetic and structural analysis with (R)- and (S)-pseudopaline confirmed catalysis in the reverse direction for only (R)-staphylopine and (R)-pseudopaline, verifying the stereochemistry of these two opine metallophores. Structural analysis at 1.57-1.85 Å resolution captured the hydrolysis of (R)-pseudopaline and allowed identification of a binding pocket for the l-histidine moiety of pseudopaline formed through a repositioning of Phe-340 and Tyr-289 during the catalytic cycle. Transient-state kinetic analysis revealed an ordered release of NADP+ followed by staphylopine, with staphylopine release being the rate-limiting step in catalysis. Knowledge of the stereochemistry for opine metallophores has implications for future studies involving kinetic analysis, as well as opine metallophore transport, metal coordination, and the generation of chiral amines for pharmaceutical development.

Keywords: Pseudomonas aeruginosa (P. aeruginosa); Staphylococcus aureus (S. aureus); crystal structure; dehydrogenase; kinetics; metallophore; opine; pseudopaline; siderophore; staphylopine.


Conflict of interest statement

The authors declare that they have no conflicts of interest with the contents of this article

Figures

Figure 1.
Figure 1.
ODH reaction and product stereochemistry. A, generalized opine metallophore-forming opine dehydrogenase reaction that condenses HisNA and an α-keto acid forming a Schiff base that is reduced by NAD(P)H. B, opine metallophores. The stereo centers derived from amino acids are labeled (L) or (D) to distinguish them from the stereocenter formed by the opine dehydrogenase, which is labeled (S) or (R). Numbering for the carbons of (R)-pseudopaline is used to identify specific carbons in the structural studies presented below. C, saccharopine dehydrogenase (PDB 3UH1) contains two Rossmann-like fold domains. Characterized members of this enzyme class produce (S)-opine products. PDBeFold calculates 4.8 Å rmsd over 28% of the Cα residues compared with PaODH-NADP+ (panel D). D, pseudopaline dehydrogenase (PaODH-NADP+, PDB 6PBM) is structurally homologous with (R)-opine and not (S)-opine ODHs such as Nα-[1-(R)-(carboxyl)ethyl]-l-norvaline dehydrogenase (E). E, Nα-[1-(R)-(carboxyl)ethyl]-l-norvaline dehydrogenase (PDB 1BG6). Characterized members of this enzyme class produce (R)-opine products. PDBeFold calculates a 3.4 Å rmsd over 91% of the Cα residues, compared with PaODH-NADP+.
Figure 2.
Figure 2.
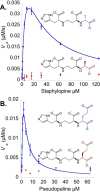
Steady-state kinetic plots for the reverse reaction. Final concentrations were 150 nm SaODH (A) or PaODH (B) and 112 μm NADP+ mixed with varied concentrations of (R)- or (S)-staphylopine or (R)- or (S)-pseudopaline. A, dependence of the initial rate for (R)-staphylopine (blue, fit to Equation 1) and (S)-staphylopine (red). Structural formulas for staphylopine accompany each plot. B, secondary plots of initial rates for (R)-pseudopaline (blue, fit to Equation 1) and (S)-pseudopaline (red). Structural formulas for pseudopaline accompany each plot.
Figure 3.
Figure 3.
PaODH structures with (S)-pseudopaline, l-HisNA, and α-ketoglutarate bound. PaODH-(S)-Pse at 1.64 Å in panels A–C; chain B shown. Ligand density for PaODH-(R)-Pse-1h at 1.65 Å in panels D and E. Ligand density for PaODH-(R)-Pse-2h at 2.18 Å in panel F. (S)-Pseudopaline (green), NADP+ (yellow), l-HisNA (orange), and α-ketoglutarate (cyan). A, PaODH-(S)-Pse ribbon diagram. B, active site cavity with a CASTp (Computed Atlas of Surface Topography of proteins) calculated surface (gray mesh). C, overlay of PaODH-NADP+ (gray) and PaODH-(S)-Pse (purple). Pink dashed line is the distance between C4 of the nicotinamide ring and C2 of (S)-pseudopaline (both from PaODH-(S)-Pse). Yellow dashed lines indicate hydrogen bonding interactions. Electron density around (S)-pseudopaline and NADP+ is displayed as an mFoDFc omit map contoured at 3.5 σ. D, PaODH-(R)-Pse-1h. Ligands overlaid with a 2mFoDFc electron density map contoured at 1.5 σ as seen following the final round of refinement (dark blue mesh). E, PaODH-(R)-Pse-1h with an active site overlay with a mFoDFc difference electron density map contoured at 3.0 σ (negative density is red, positive density is green). A Polder electron density map generated with l-HisNA and α-ketoglutarate omitted from the model and contoured at 4.5 σ is shown in light blue. F, PaODH-(R)-Pse-2h. l-HisNA overlaid with a mFoDFc omit map generated with l-HisNA omitted and contoured at 3.5 σ. There is no density for α-ketoglutarate in this structure.
Figure 4.
Figure 4.
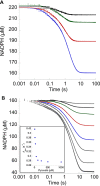
Transient-state kinetics of SaODH. The oxidation of NADPH to NADP+ was measured at 340 nm by stopped-flow spectrometry. Concentrations were 15 μm SaODH, 1000 μm pyruvate, 220 μm NADPH, and varied d-HisNA in panel A. Concentrations were 15 μm SaODH, 500 μm d-HisNA, 160 μm NADPH, and varied pyruvate in panel B. Colors indicate equivalent concentrations of substrate: black, 7.8 μm; green, 15.6 μm; red, 31.3 μm; and blue, 62.5 μm. Inset is a secondary plot of kobs (s−1) for the slow reaction phase. A, varied d-HisNA; 7.8, 15.6, 31.3, and 62.5 μm. The global fit to Model 1 overlays the data. B, varied pyruvate; 3.9, 7.8, 15.6, 31.2, 62.4, 124.8, 250, 500, and 1000 μm.
Figure 5.
Figure 5.
Transient-state kinetics for SaODH by fluorescence. Fluorescence emission measured beyond 360 nm cut-off filter. A, SaODH binding NADPH. Final concentrations in the stopped-flow cell were 15 μm SaODH mixed with varied NADPH concentrations in micromolar as shown. Data were fit to a one-step equilibrium binding model with a forward rate constant of 0.4 × 10⁶ m−1 s−1 and reverse rate constant of 27 s−1; giving a KNADPH of 70 μm. B, overlay of fluorescence binding and forward reaction data for equivalent enzyme and NADPH concentrations. 15 μm SaODH binding 240 μm NADPH (red trace) and 15 μm SaODH reacting with 500 μm d-HisNA, 1000 μm pyruvate, and 240 μm NADPH (gray trace) are shown. The gray trace is the same as in panel C. C, SaODH reaction with varied NADPH. 15 μm SaODH reacted with 500 μm d-HisNA, 1000 μm pyruvate, and varied NADPH concentrations as shown. Inset shows the low concentrations proceeding as a single turnover up to 10 μm NADPH followed by a successive slowing of the progression toward equilibrium at higher NADPH concentrations. D, comparison of forward reaction data by absorption and fluorescence using the same concentration of enzyme and reactants. 15 μm SaODH reacted with 1 mm pyruvate, 500 μm d-HisNA, and 160 μm NADPH. Gray trace is the absorption data from Fig. 4B. Blue trace is fluorescence data from C. Dashed line indicates the transition from the fast single-turnover phase to the slow steady-state phase.
Figure 6.
Figure 6.
Transient-state kinetics for the SaODH reverse reaction. Reverse reaction measured as an increase in fluorescence emission at 450 nm as NADP+ is reduced to NADPH. A, varied NADP+. B, varied (R)-staphylopine. Final concentrations in the stopped-flow cell were 15 μm SaODH mixed with 125 μm (R)-staphylopine (A) or varied (R)-staphylopine (B) and varied NADP+ (A) or 150 μm NADP+ (B). Every 10th data point is shown for clarity. Both data sets fit simultaneously to Model 1 by numerical integration in Kintek Studio 8.0 (lines).
Figure 7.
Figure 7.
Inhibition of SaODH reaction by metal ions. Transient state kinetics for SaODH measuring NADPH oxidation. Final concentrations in the stopped-flow cell were 15 μm SaODH, 180 μm NADPH, and 1 mm pyruvate mixed with a final concentration of 100 μm d-HisNA. The black traces are 100 μm metal preincubated with 100 μm d-HisNA. The green traces are 25 μm (Co(II) or Ni(II)) or 50 μm (Zn(II) or Cu(II)) preincubated with d-HisNA. The blue traces are 25 μm (Co(II) or Ni(II)) or 50 μm (Zn(II) or Cu(II)) preincubated with SaODH. The red trace is 0 μm metal added. A, Co(II); 1, fast phase; 2, early steady-state phase; 3, late steady-state or inhibited phase. The black trace is fit to Equation 3 and the red, blue, and green traces are fit to Equation 4. Every 10th data point is shown as triangles for clarity. B, Ni(II). C, Zn(II). D, Cu(II).
Scheme 1.
Scheme 1.
SaODH kinetic mechanism.
Figure 8.
Figure 8.
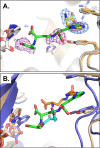
Overlay of SaODH and PaODH ligand structures. A, overlay of SaODH structures. Yellow is SaODH with (S)-staphylopine bound (green carbons) from PDB 6H3F. Gray is SaODH with d-histidine bound (yellow carbons) from PDB 6H3D. Purple mesh is (S)-staphylopine mFoDFc omit map generated in phenix.polder and contoured at 3.5 σ using 6H3F structure factors. Blue mesh is d-histidine mFoDFc omit map generated in phenix.polder and contoured at 3.5 σ using the PDB 6H3D structure factors. The C1 carboxylate of the pyruvate moiety of (S)-staphylopine is within hydrogen bonding distance of NADP+. B, overlay of SaODH and PaODH. Yellow is SaODH with (S)-staphylopine bound (green carbons) as for A. Purple is PaODH-(R)-PSE-1h with l-HisNA (orange carbons) and α-ketoglutarate bound (cyan carbons).

References

    1. Ghssein G., Brutesco C., Ouerdane L., Fojcik C., Izaute A., Wang S., Hajjar C., Lobinski R., Lemaire D., Richaud P., Voulhoux R., Espaillat A., Cava F., Pignol D., Borezée-Durant E., and Arnoux P. (2016) Biosynthesis of a broad-spectrum nicotianamine-like metallophore in Staphylococcus aureus. Science 352, 1105–1109 10.1126/science.aaf1018 - DOI - PubMed
    1. McFarlane J. S., and Lamb A. L. (2017) Biosynthesis of an opine metallophore by Pseudomonas aeruginosa. Biochemistry 56, 5967–5971 10.1021/acs.biochem.7b00804 - DOI - PMC - PubMed
    1. Lhospice S., Gomez N. O., Ouerdane L., Brutesco C., Ghssein G., Hajjar C., Liratni A., Wang S., Richaud P., Bleves S., Ball G., Borezée-Durant E., Lobinski R., Pignol D., Arnoux P., and Voulhoux R. (2017) Pseudomonas aeruginosa zinc uptake in chelating environment is primarily mediated by the metallophore pseudopaline. Sci. Rep. 7, 1–10 10.1038/s41598-017-16765-9 - DOI - PMC - PubMed
    1. Mastropasqua M. C., D'Orazio M., Cerasi M., Pacello F., Gismondi A., Canini A., Canuti L., Consalvo A., Ciavardelli D., Chirullo B., Pasquali P., and Battistoni A. (2017) Growth of Pseudomonas aeruginosa in zinc poor environments is promoted by a nicotianamine-related metallophore. Mol. Microbiol. 106, 543–561 10.1111/mmi.13834 - DOI - PubMed
    1. Remy L., Carrière M., Derré-Bobillot A., Martini C., Sanguinetti M., and Borezée-Durant E. (2013) The Staphylococcus aureus Opp1 ABC transporter imports nickel and cobalt in zinc-depleted conditions and contributes to virulence. Mol. Microbiol. 87, 730–743 10.1111/mmi.12126 - DOI - PubMed

Publication types

LinkOut - more resources