. 2019 Oct 15;12(603):eaaw9315.
doi: 10.1126/scisignal.aaw9315.

Developmentally regulated KCC2 phosphorylation is essential for dynamic GABA-mediated inhibition and survival

Affiliations

Developmentally regulated KCC2 phosphorylation is essential for dynamic GABA-mediated inhibition and survival

Miho Watanabe et al. Sci Signal. .

Abstract

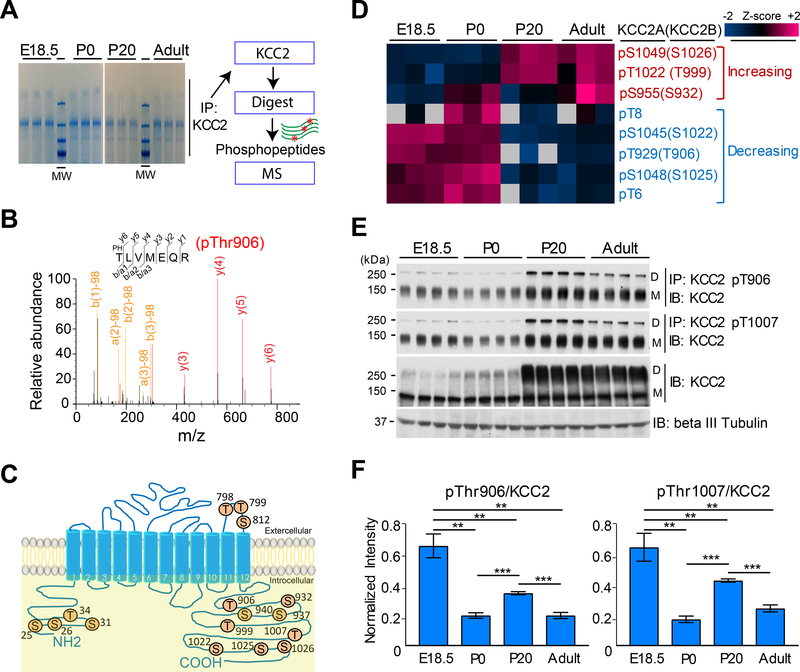
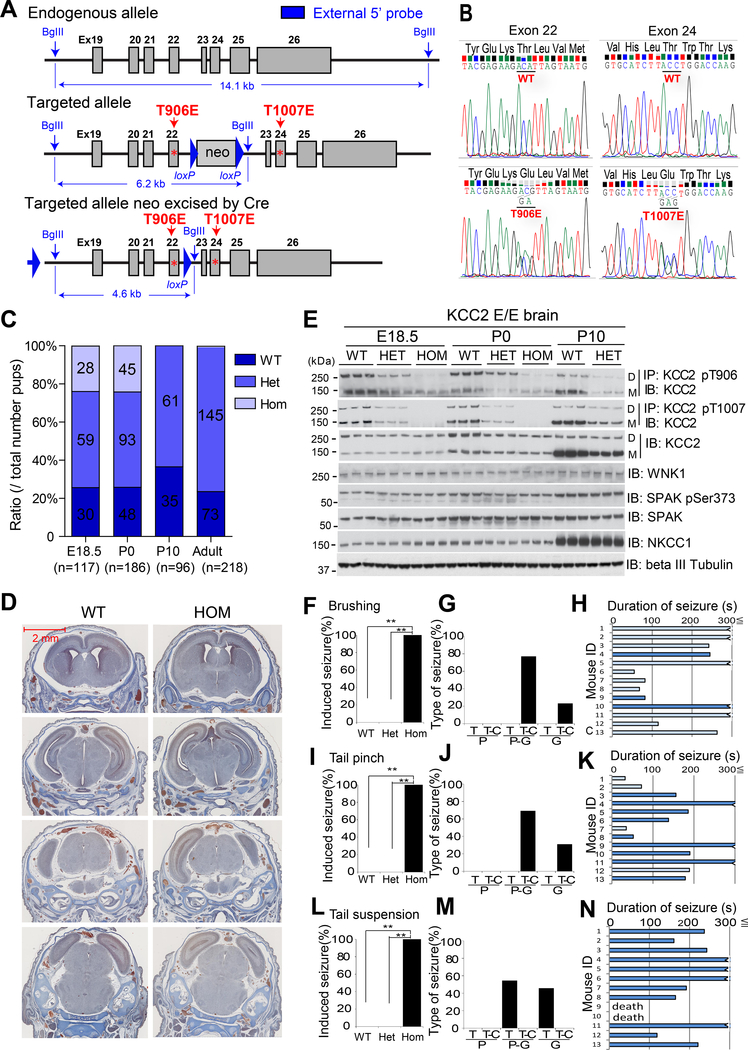
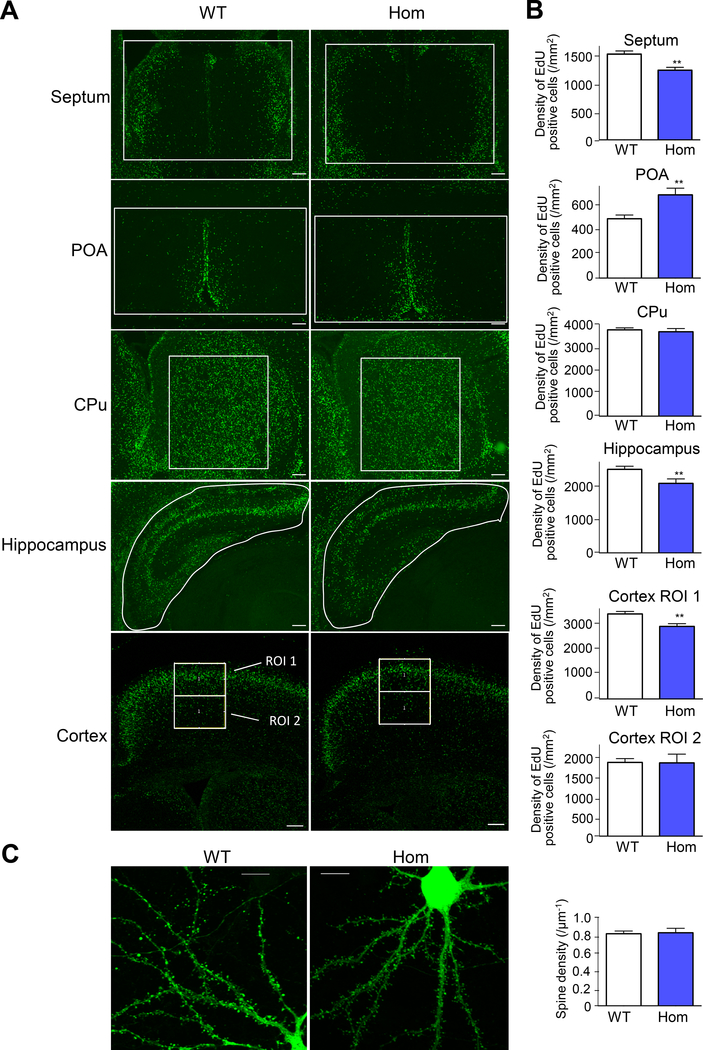
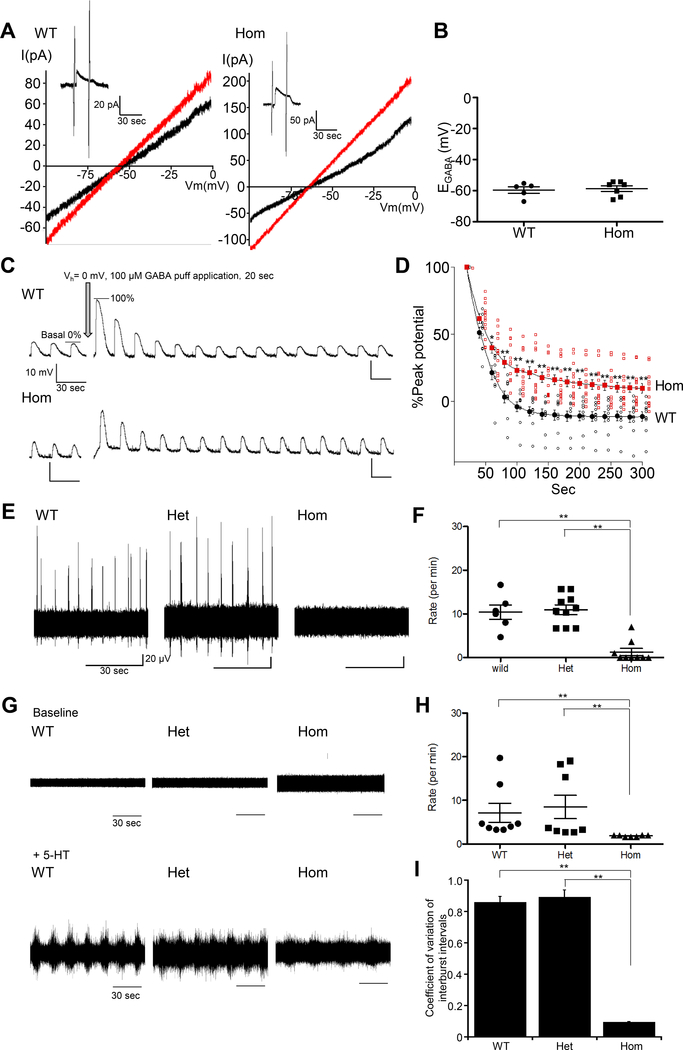
Despite its importance for γ-aminobutyric acid (GABA) inhibition and involvement in neurodevelopmental disease, the regulatory mechanisms of the K+/Cl- cotransporter KCC2 (encoded by SLC12A5) during maturation of the central nervous system (CNS) are not entirely understood. Here, we applied quantitative phosphoproteomics to systematically map sites of KCC2 phosphorylation during CNS development in the mouse. KCC2 phosphorylation at Thr906 and Thr1007, which inhibits KCC2 activity, underwent dephosphorylation in parallel with the GABA excitatory-inhibitory sequence in vivo. Knockin mice expressing the homozygous phosphomimetic KCC2 mutations T906E/T1007E (Kcc2E/E ), which prevented the normal developmentally regulated dephosphorylation of these sites, exhibited early postnatal death from respiratory arrest and a marked absence of cervical spinal neuron respiratory discharges. Kcc2E/E mice also displayed disrupted lumbar spinal neuron locomotor rhythmogenesis and touch-evoked status epilepticus associated with markedly impaired KCC2-dependent Cl- extrusion. These data identify a previously unknown phosphorylation-dependent KCC2 regulatory mechanism during CNS development that is essential for dynamic GABA-mediated inhibition and survival.


Conflict of interest statement

Competing interests: The authors declare that they have no competing interests.

Figures

Figure 1.
Figure 1.. Identification of KCC2 phosphorylation sites regulated during CNS development.
(A) Phosphorylation site mapping. KCC2 was immunopurified from mouse brain, fractionated by SDS-PAGE, and digested with trypsin. Blot is representative of lysates from 19 mice. Schematic lays out how phospho-peptides were subjected to LC-MS/MS. (B) Representative MS/MS spectrum assignment of peptide TLVMEQR (pThr929; presented as human KCC2B pThr906). The phosphorylated precursor ion ( 478.71 +2) was selected and produced the fragment ion spectrum shown. Specific y and b fragment ions allowed unambiguous identification of the precursor peptide and its phosphorylation at Thr906 (human numbering). Fragment ions with neutral loss of phosphate (-Pb/a1, -Pb/a2, -Pb/a3 etc.) are indicated. (C) Identified KCC2 phosphorylation sites are numbered as in human KCC2B (GeneID 57468). All KCC2 peptides observed at various developmental stages are listed in table S1. (D) Heat map representation of significant KCC2 phosphorylation sites and their changes during development. Hierarchical clustering showed distinct pattern of KCC2 phosphorylation at these residues. Amino acid residue numbering is referenced to isoform 1 of mouse Slc12a5 (UniProt: Q91V14). (E) Brain lysates were subjected to immunoprecipitation (IP) by pan-KCC2 antibody (KCC2) or by phosphorylation site-specific antibodies recognizing the Thr906- or Thr1007-phosphorylated forms of KCC2, and immuno-precipitated protein was detected with pan-KCC2 antibody (IB). Whole-cell lysates were subjected to immunoblot using antibodies recognizing the indicated proteins or phosphoproteins. D, dimeric KCC2; M, monomeric KCC2. Blot is representative of 3 experiments. (F) Band intensities represented in (E) were quantitated with ImageJ software. Calculation of intensity ratios was based on the calculation: (phospho-dimeric KCC2 + phospho-monomeric KCC2) / (total dimeric KCC2 + total monomeric KCC2), as described previously (24). ***p<0.001; **p<0.01; *p<0.05; ns, not significant by one-way ANOVA with post-hoc testing (n=6, data are mean ± SEM).
Figure 2.
Figure 2.. KCC2 T906E/T1007E (Kcc2E/E) phospho-mimetic mice.
(A) Genomic targeting strategy depicting T906E (exon 22) and T1007E (exon 24). The intron 22 Neomycin selection cassette is excised by Cre recombinase. (B) Sanger sequencing trace of KCC2 T906E/T1007E. (C) Genotypes of surviving progeny from Kcc2+/E intercrosses at E18.5, P0, and P10. N is noted in the graph. (D) Consecutive axial brain sections revealed no gross defects in Kcc2E/E mutant mice (hom, p0). Images are representative of 20 mice. (E) WT brain lysates at indicated ages were immunoprecipitated (IP) with site-specific phospho-antibodies recognizing KCC2 pThr906 or pThr1007. Immunoprecipitates were immunoblotted with pan-KCC2 antibody (IB). Whole-cell lysates were immunoblotted with indicated antibodies. D, dimeric KCC2; M, monomeric KCC2. Band intensities were quantitated with ImageJ software, shown in fig. S2C. Blot is representative of 3 experiments. (F to N) Percentage of WT, heterozygous (het) and homozygous (hom) P0 Kcc2E/E mice exhibiting seizures, type of seizure [partial (P), secondary generalized (G), tonic (T), and tonic-clonic types (T-C)], and duration of seizure (with or without opisthotonos: dark and light blue, respectively) provoked by brushing (F to H), tail pinch (I to K), and tail suspension (L to N). **p<0.01 by chi square test. Data are from 11–13 mice.
Figure 3.
Figure 3.. Developing Kcc2E/E mouse brains exhibit anomalous distribution of proliferating neurons but normal dendritic spine morphology.
(A) Neuronal distribution in WT and homozygous Kcc2E/E E14.5 brains. Representative images of EdU-positive neurons in the septum, hypothalamus, hippocampus, and cortex of WT (n = 3) and homozygous Kcc2E/E (n = 4) mouse brains. Proliferating cells were labeled with EdU at E14.5 and then immunostained for EdU at E18.5. EdU-positive cells in each region of interest (ROI) were counted as in Methods. Images are representative of 7 mice. (B) Quantitation of EdU-positive neuron density in WT versus homozygous Kcc2E/E E14.5 brains, assessed in the septum, pre-optic area (POA), caudate-putamen (CPu), hippocampus, and cortex (ROI 1 and 2). **p<0.01 by unpaired t-test, n=4 (Kcc2E/E) and 3 (WT). (C) Spine formation in WT and homozygous Kcc2E/E neurons. Representative images of EGFP-transfected DIV 26 primary cultured cortical neurons from WT and homozygous Kcc2E/E mice (each n=3).
Figure 4.
Figure 4.. Kcc2E/E neurons exhibit impaired GABA-dependent Cl extrusion, and disrupted rhythmogenesis.
(A) Gramicidin-perforated, voltage-clamped currents (9) recorded at −50 mV holding potential. Two 0.5 s voltage ramps from −100 to 0 mV were applied before and during 30 s puff application of 100 μM GABA; sample I-V curves before (black) and after GABA application (red). EGABA was estimated from the voltage axis intercept (detailed further in the Methods). Insets (upper left) are representative GABA-evoked current traces at −50 mV holding potential in ventral spinal cord neurons of acute lumber spinal cord slices from P0 WT (left) and Kcc2E/E mice (right). Data are representative of 12 mice. (B) Neuronal EGABA from WT (−59.6 ± 2.1; n=5) and homozygous Kcc2E/E mice (−58.7 ± 1.8 mV; n=7). Data were not significantly different by an unpaired t-test. (C) Representative traces of GABA responses in P0 ventral spinal cord neurons of acute lumber spinal cord slices from WT and Kcc2E/E mice. After current clamp recording of basal GABA responses (3-s 100 μM GABA puffs every 20 s) in neurons from WT and Kcc2E/E mice, neurons were Cl-loaded by prolonged (20 s) GABA puff during depolarizing voltage-clamp (Vh = 0 mV). Post-Cl-loading, responses to brief GABA puffs were again recorded in current-clamp mode, demonstrating 407±78% increased peak neuronal Cl extrusion. Data are representative of 23 mice. (D) Normalized recovery of neuronal GABA responses in WT (black circles; n=10) and Kcc2E/E mice (red squares; n=13) post-Cl loading. Cl extrusion rate was impaired in Kcc2E/E mice. Each neuronal response was normalized to the GABA pulse peak value (0%) and to peak post-Cl loading GABA pulse-induced response (100%) for each neuron. WT peak potentials recovered to initial values (−3.9 ± 3.8%; n=10), whereas Kcc2E/E peak potentials remained 23.0 ± 4.1% above initial values (n=13). *p<0.05, **p<0.01 by unpaired t-test. Open symbols, single cells; filled symbols, mean values with standard error. (E) Respiratory motor neuron recordings from P0 mouse cervical spinal cord ventral rootlets (C4-C5) (42). Spontaneous rhythmic activity was measured in WT mice (n=6), T906E/T1007E+/wt mice (n=10), and Kcc2E/E mice (n=11). (F) Respiratory rhythm of WT (10.4 ± 1.1 min−1; n=6), heterozygous Kcc2E/wt (11 ± 1.1 min−1; n=10), and Kcc2E/E mice (1.3 ± 0.8 min−1; n=9). Means ± SEM; **p<0.01 by Kruskal-Wallis test. (G) P0 L2 ventral root spontaneous activity (upper traces), and locomotor rhythm (lower traces) was induced by perfusion of 20 μM 5-HT (45, 46) in WT (n=8), heterozygous (n=8), and Kcc2E/E mice (n=7). (H) Rate of the locomotor rhythm in WT (7.1 ± 2.2 min−1; n=8), T906E/T1007E+/wt mice (8.5 ± 2.7 min−1; n=8), and Kcc2E/E mice (1.9 ± 0.1 min−1; n=7). Means ± SEM; **p<0.01 by Kruskal-Wallis test. (I) Coefficient of variation of interburst intervals in WT (0.9 ± 0.04; n=8), T906E/T1007E+/wt mice (0.9 ± 0.04; n=8), and Kcc2E/E mice (0.1 ± 0.001; n=7). Means ± SEM; **p<0.01 by Kruskal-Wallis test.

Comment in

References

    1. Farrant M, and Kaila K. 2007. The cellular, molecular and ionic basis of GABA(A) receptor signalling. Progress in brain research 160: 59–87. - PubMed
    1. Nakanishi K, Yamada J, Takayama C, Oohira A, and Fukuda A. 2007. NKCC1 activity modulates formation of functional inhibitory synapses in cultured neocortical neurons. Synapse (New York, N.Y 61: 138–149. - PubMed
    1. Wang DD, and Kriegstein AR. 2008. GABA regulates excitatory synapse formation in the neocortex via NMDA receptor activation. J Neurosci 28: 5547–5558. - PMC - PubMed
    1. Haydar TF, Wang F, Schwartz ML, and Rakic P. 2000. Differential modulation of proliferation in the neocortical ventricular and subventricular zones. J Neurosci 20: 5764–5774. - PMC - PubMed
    1. Behar TN, Schaffner AE, Scott CA, Greene CL, and Barker JL. 2000. GABA receptor antagonists modulate postmitotic cell migration in slice cultures of embryonic rat cortex. Cereb Cortex 10: 899–909. - PubMed

Publication types

MeSH terms

LinkOut - more resources