. 2019 Oct 15;10(1):4678.
doi: 10.1038/s41467-019-12113-9.

Pathogenesis of hypertension in a mouse model for human CLCN2 related hyperaldosteronism

Affiliations

Pathogenesis of hypertension in a mouse model for human CLCN2 related hyperaldosteronism

Corinna Göppner et al. Nat Commun. .

Abstract

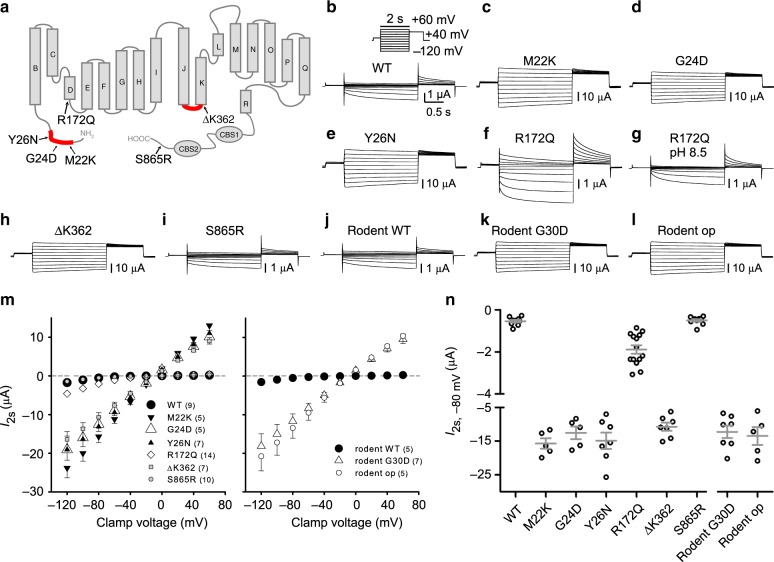
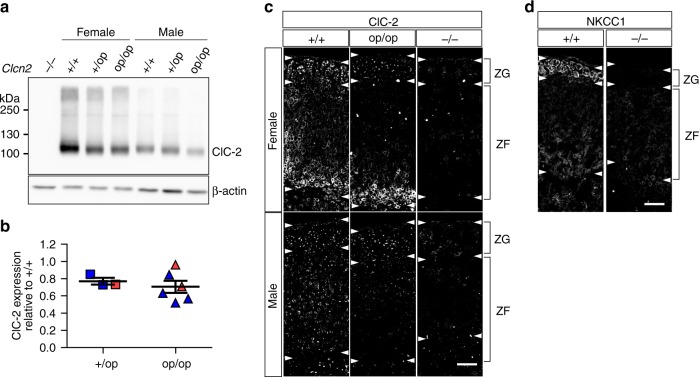
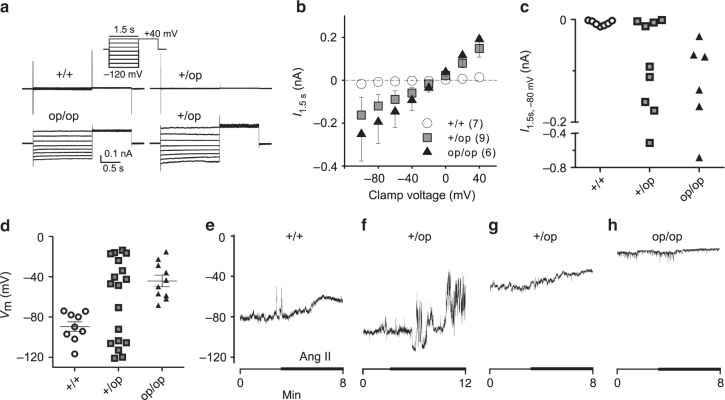
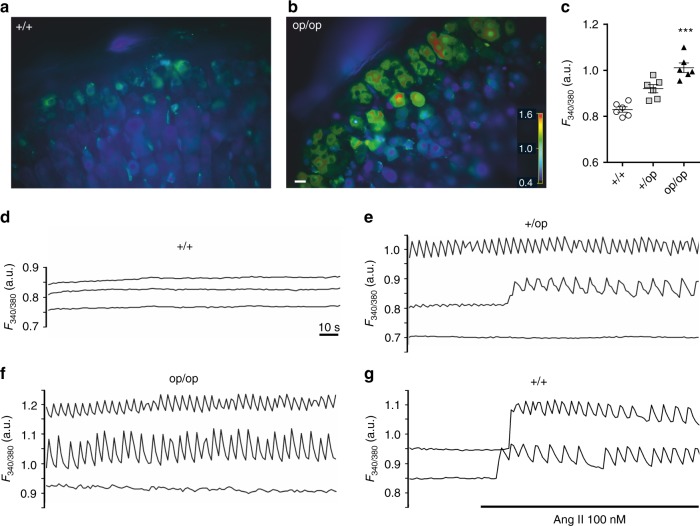
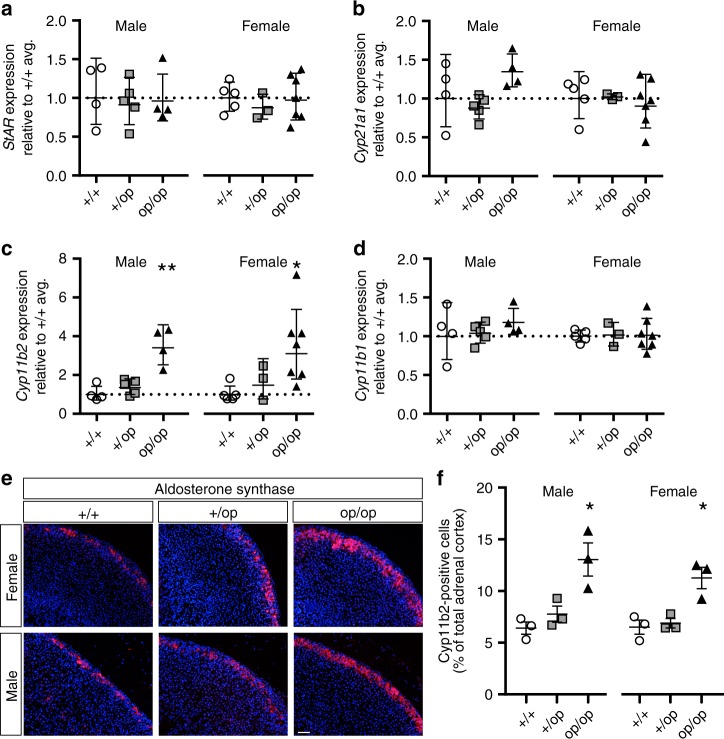
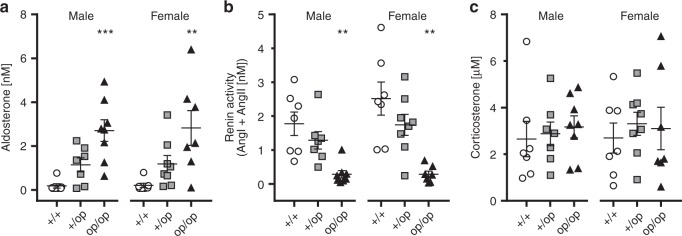
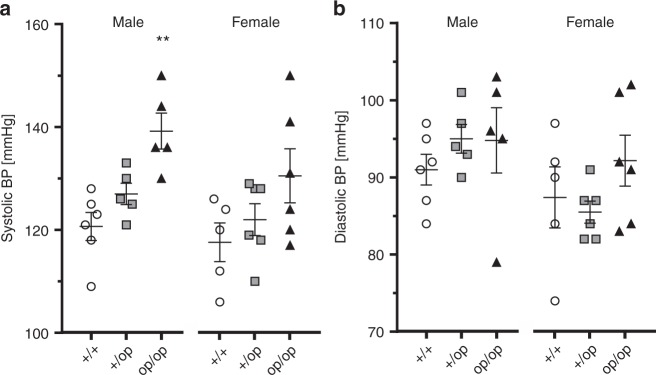
Human primary aldosteronism (PA) can be caused by mutations in several ion channel genes but mouse models replicating this condition are lacking. We now show that almost all known PA-associated CLCN2 mutations markedly increase ClC-2 chloride currents and generate knock-in mice expressing a constitutively open ClC-2 Cl- channel as mouse model for PA. The Clcn2op allele strongly increases the chloride conductance of zona glomerulosa cells, provoking a strong depolarization and increasing cytoplasmic Ca2+ concentration. Clcn2op mice display typical features of human PA, including high serum aldosterone in the presence of low renin activity, marked hypertension and hypokalemia. These symptoms are more pronounced in homozygous Clcn2op/op than in heterozygous Clcn2+/op mice. This difference is attributed to the unexpected finding that only ~50 % of Clcn2+/op zona glomerulosa cells are depolarized. By reproducing essential features of human PA, Clcn2op mice are a valuable model to study the pathological mechanisms underlying this disease.


Conflict of interest statement

The authors declare no competing interests.

Figures

Fig. 1
Fig. 1
Characterization of human Clcn2 gene variants in primary aldosteronism and the op allele. a ClC-2 topology model, based on the CLC crystal structure, mapping positions of genetic variants found in early-onset primary aldosteronism,. N-terminal and J-K linker domains previously shown, to be important for opening ClC-2 are highlighted in red. bl Representative current traces obtained by two-electrode voltage clamp of Xenopus oocytes injected with the indicated ClC-2 cRNAs. Voltage clamp protocol indicated in the inset of panel b. The rodent “op” mutant exactly mimics the channel encoded by the Clcn2op allele in the present knock-in mouse model. For comparison to the human G24D mutant, the equivalent G30D rodent mutant was measured. In some experiments (f, g) individual ClC-2(R172Q)-expressing oocytes (n = 7) were first measured with ND109, pH 7.4 and then in ND109 buffered to pH 8.5. m Plot of mean current measured at 2 s after clamping to indicated voltages and (n) individual currents at a clamp of −80 mV for experiments of bl. The number of cells measured is indicated in parenthesis. m, n Currents are presented as mean ± SEM
Fig. 2
Fig. 2
Expression of wild type and open ClC-2 protein in mouse adrenal glands. a Representative western blot for ClC-2 of membrane fractions isolated from adrenal gland tissue of male and female Clcn2+/+ (+/+), Clcn2+/op (+/op), Clcn2op/op (op/op) mice. Antibody specificity was verified with Clcn2−/− (−/−) adrenal tissue. Equal amounts of protein were loaded, with β-actin serving as a loading control. b Densitometric quantification of protein bands to determine ClC-2 expression in the adrenal gland of male (blue) and female (red) Clcn2+/op (squares; n = 3 animals) and Clcn2op/op (triangles; n = 6 animals) mice compared to WT (n = 6 animals) assigned a reference value of 1. Short and long bars designate mean ± SEM. c Representative immunofluorescent staining of ClC-2 in the adrenal cortex of male and female +/+, +/op, and control −/− mice. Twelve-week-old mice were used (ac). d Na+K+2Cl cotransporter (NKCC1) staining in the adrenal cortex of a WT (+/+) mouse, with Nkcc1−/− (−/−) tissue as control (both females and 3 weeks old). c, d White arrowheads indicate approximate boundaries of zona glomerulosa (ZG) and zona fasciculata (ZF). Scale bar, 50 µm (c, d)
Fig. 3
Fig. 3
Increased chloride current and membrane depolarization in Clcn2op zona glomerulosa cells. a Representative traces of chloride currents in ZG cells from Clcn2+/+ (7 cells, 7 mice), Clcn2+/op (9 cells, 8 mice), Clcn2op/op (6 cells from 6 mice) adrenal slices, designated as +/+, +/op, and op/op, and measured with amphotericin-perforated patch clamp using the voltage step protocol shown in inset. b Plot of mean ± SEM currents measured at the end of voltage steps (1.5 s) as a function of voltage from experiments performed in a. The number of cells measured is indicated in parenthesis. c Individual current values of a, b at a clamp voltage of −80 mV. d Individual ZG cell membrane potentials Vm from Clcn2op mouse models using gramicidin-perforated patches with I=0 (9 +/+ cells from 9 mice, 18 +/op cells from 12 mice, 10 op/op cells from 8 mice) that leave intracellular chloride undisturbed. Long and short bars represent means ± SEM, respectively. Since Vm distribution of +/op cells appears bimodal, no mean value is shown. dg Voltage traces of +/+, +/op, op/op cells (representative of 2, 7, and 5 cells, respectively) that were superfused with 100 nM angiotensin II (Ang II) indicated by a thick line
Fig. 4
Fig. 4
Increased intracellular calcium in Clcn2op zona glomerulosa cells. a, b Representative images of Clcn2+/+ (a) and Clcn2op/op (b) male adrenal Fura-2 AM-loaded slices. Colors indicate Ca2+ fluorescence under basal conditions. Scale bar, 10 µm. c Quantification of Ca2+ fluorescence from Clcn2+/+ (+/+, circles), Clcn2+/op (+/op, squares), and Clcn2op/op (op/op, triangles) adrenal gland slices. For each genotype, six mice were analyzed. Single values represent mean values of cells measured during 2 min from one mouse. Error bars, mean ± SEM. ***p < 0.001, +/op and op/op each compared to +/+, Kruskal–Wallis test with Dunn’s multiple comparison test. df Representative Clcn2+/+ (d), Clcn2+/op (e), and Clcn2op/op (f) traces of three individual ZG cells imaged under basal conditions. g Traces showing the Ca2+-response of two Clcn2+/+ ZG cells to angiotensin II (Ang II). Fluorescence values are expressed in arbitrary units
Fig. 5
Fig. 5
Aldosterone synthase in Clcn2op adrenal gland. ad Quantitative RT-PCR analysis of steroidogenic enzyme mRNA expression in adrenal glands from 12-week-old male and female Clcn2+/+ (+/+, circles), Clcn2+/op (+/op, squares), and Clcn2op/op (op/op, triangles) mice, n ≥ 3 (each point represents one animal). Relative expression levels (compared to Clcn2+/+ average, reference value of 1 indicated with a dotted line) for a StAR (steroidogenic acute regulatory protein), b Cyp21a1 (steroid 21-hydroxylase), c Cyp11b2 (aldosterone synthase), d Cyp11b1 (11β-hydroxylase). Error bars in ad, geometric mean ± geometric SD. Statistical analyses was performed on ΔCt values. *p < 0.05, **p < 0.01 (+/op and op/op each compared to +/+ of same sex, male and female analyzed separately, Kruskal–Wallis test, Dunn’s multiple comparison test). e Representative aldosterone synthase/Cyp11b2 staining of paraffin-embedded adrenal gland slices from male and female +/+, +/op, op/op mice at age 12 weeks. f Quantification of Cyp11b2-positive cells observed in e on an automated molecular imaging platform (Vectra, Perkin Elmer). n = 3 animals for each group. Error bars, means ± SEM. *p < 0.05 (+/op and op/op each compared to +/+ of same sex, male and female analyzed separately, one-way ANOVA, Bonferroni multiple comparison test). Scale bar, 100 µM
Fig. 6
Fig. 6
Elevated aldosterone levels and renin activity in serum of Clcn2op mice. ac Serum levels of aldosterone (a), renin activity (b), and corticosterone concentration (c) of Clcn2+/+ (+/+, circles), Clcn2+/op (+/op, squares), and Clcn2op/op mice (op/op, triangles) aged 12 weeks and sub-grouped between males (left) and females (right) (one sample per animal was measured). Aldosterone levels below detection were set at the measureable lower limit threshold value of 70 pM (number of samples below threshold per samples measured: males: Clcn2+/+ n = 4/7, Clcn2+/op n = 1/7, Clcn2op/op n = 0/8; females: Clcn2+/+ n = 3/7, Clcn2+/op n = 0/8, Clcn2op/op n = 0/7). Renin activity was calculated as the sum of angiotensin I (Ang I) and angiotensin II (Ang II) (see Methods). Error bars, mean ± SEM. Statistical significance (Kruskal–Wallis test with Dunn’s multiple comparison test; analyzed separately by sex and compared to Clcn2+/+) is shown above the groups: **p < 0.01, ***p < 0.001. Upon pooling both males and females in a, statistical analysis (Kruskal–Wallis test with Dunn’s multiple comparison test) of Clcn2+/+ versus Clcn2+/op was statistically significant (**) for increased aldosterone
Fig. 7
Fig. 7
Elevated blood pressure in Clcn2op mice. a, b Systolic (a) and diastolic (b) blood pressure (BP) measured by telemetry in Clcn2+/+ (+/+, circles, males: n  = 6, females: n = 5), Clcn2+/op (+/op, squares, n = 5 of each sex) and Clcn2op/op mice (op/op, triangles, males: n = 5, females: n = 6) fed with control diet and sub-grouped by sex (males, left; females, right). Single values represent the mean blood pressure of an individual mouse measured over 7 consecutive days. Error bars, mean ± SEM. Statistical significance (analyzed separately by sex and compared to Clcn2+/+) is shown above the groups: **p < 0.01 (Kruskal–Wallis test, Dunn’s multiple comparison test)

Similar articles

Cited by

References

    1. Stowasser M, Gordon RD. Primary aldosteronism: changing definitions and new concepts of physiology and pathophysiology both inside and outside the kidney. Physiol. Rev. 2016;96:1327–1384. doi: 10.1152/physrev.00026.2015. - DOI - PubMed
    1. Zennaro MC, Boulkroun S, Fernandes-Rosa F. Genetic causes of functional adrenocortical adenomas. Endocr. Rev. 2017;38:516–537. doi: 10.1210/er.2017-00189. - DOI - PubMed
    1. Spät A, Hunyady L. Control of aldosterone secretion: a model for convergence in cellular signaling pathways. Physiol. Rev. 2004;84:489–539. doi: 10.1152/physrev.00030.2003. - DOI - PubMed
    1. Wagner CA. Effect of mineralocorticoids on acid-base balance. Nephron Physiol. 2014;128:26–34. doi: 10.1159/000368266. - DOI - PubMed
    1. Jaisser F, Farman N. Emerging roles of the mineralocorticoid receptor in pathology: toward new paradigms in clinical pharmacology. Pharm. Rev. 2016;68:49–75. doi: 10.1124/pr.115.011106. - DOI - PubMed

Publication types