. 2019 Oct 15;9(1):14822.
doi: 10.1038/s41598-019-51428-x.

Site-specific N-glycosylation of HeLa cell glycoproteins

Affiliations

Site-specific N-glycosylation of HeLa cell glycoproteins

Lilla Turiák et al. Sci Rep. .

Abstract

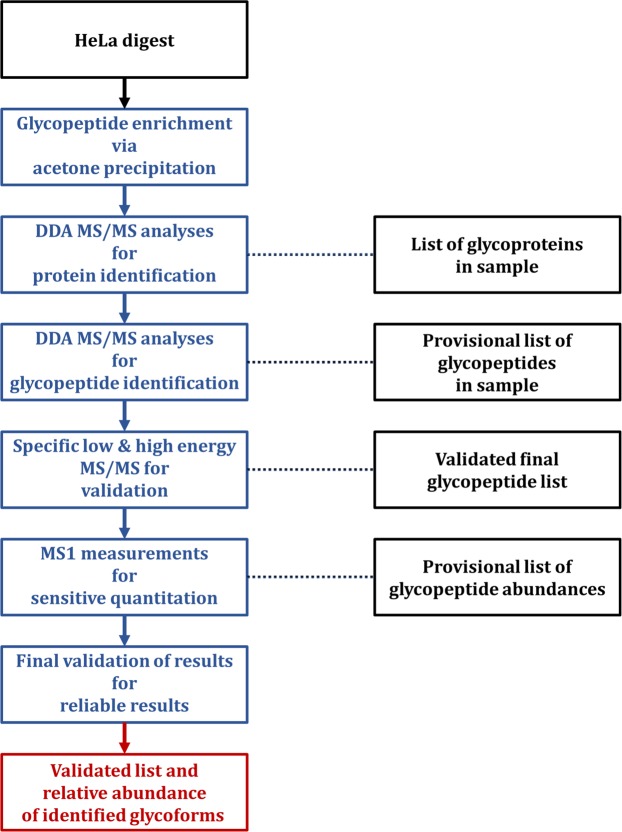
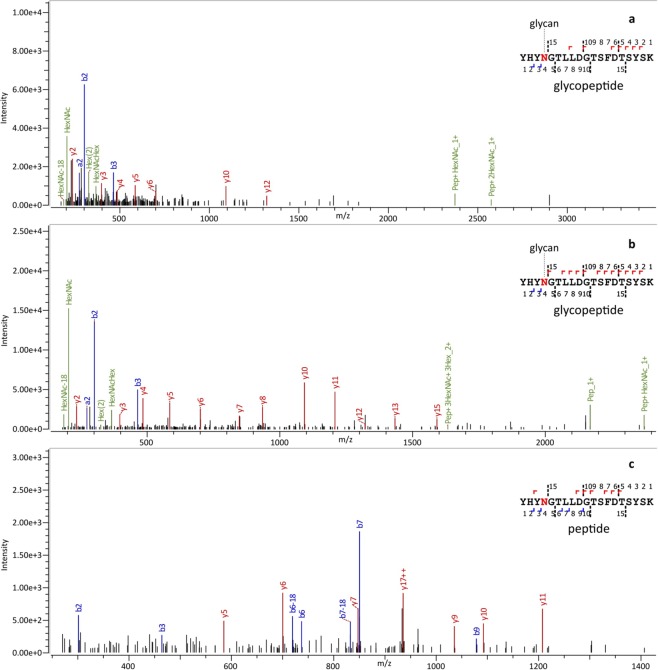
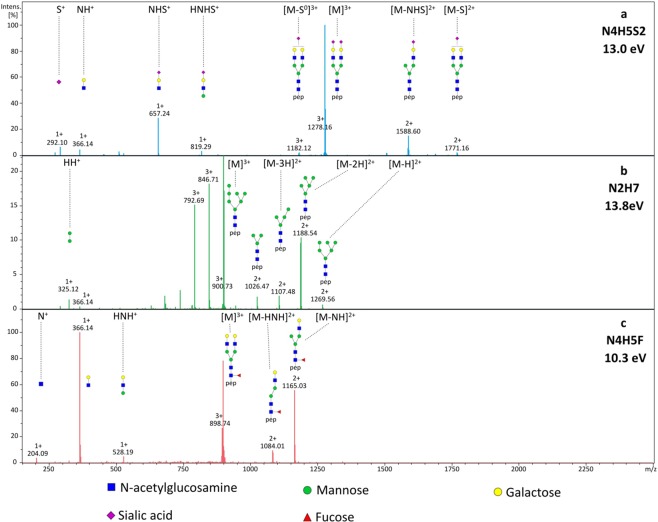
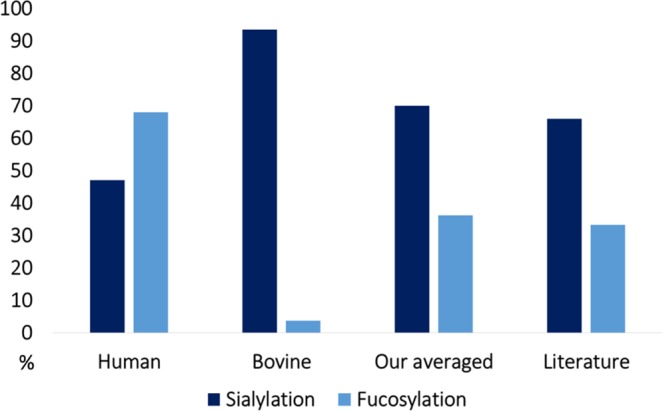
We have characterized site-specific N-glycosylation of the HeLa cell line glycoproteins, using a complex workflow based on high and low energy tandem mass spectrometry of glycopeptides. The objective was to obtain highly reliable data on common glycoforms, so rigorous data evaluation was performed. The analysis revealed the presence of a high amount of bovine serum contaminants originating from the cell culture media - nearly 50% of all glycans were of bovine origin. Unaccounted, the presence of bovine serum components causes major bias in the human cellular glycosylation pattern; as is shown when literature results using released glycan analysis are compared. We have reliably identified 43 (human) glycoproteins, 69 N-glycosylation sites, and 178 glycoforms. HeLa glycoproteins were found to be highly (68.7%) fucosylated. A medium degree of sialylation was observed, on average 46.8% of possible sialylation sites were occupied. High-mannose sugars were expressed in large amounts, as expected in the case of a cancer cell line. Glycosylation in HeLa cells is highly variable. It is markedly different not only on various proteins but also at the different glycosylation sites of the same protein. Our method enabled the detailed characterization of site-specific N-glycosylation of several glycoproteins expressed in HeLa cell line.


Conflict of interest statement

The authors declare no competing interests.

Figures

Figure 1
Figure 1
Overview of the workflow used in the present publication. Glycopeptides of the commercial HeLa digest were enriched using acetone precipitation. The glycopeptide enriched pellet fraction was subjected to DDA MS/MS analysis for glycoprotein and glycopeptide identification. Glycopeptides were validated using specific high and low energy MS/MS measurements. Quantitation was performed using single-stage mass spectrometry, and the results were validated using strict criteria. The validated site-specific glycosylation patterns are reported in Supplementary Table S2.
Figure 2
Figure 2
Example MS/MS spectra of glycopeptide YHYN*GTLLDGTSFDTSYSK-N2H8 (m/z 1291.1910) belonging to FKB10_HUMAN glycoprotein. (a) “glycopeptide-optimized” conditions using mixed energy, Byonic LogProb: 5.39, Byonic Score: 170 (b) 200% of the standard collision energy used in proteomics, Byonic LogProb: 8.38, Byonic Score: 454.9 (c) MS/MS of the corresponding peptide, obtained by digestion with PNGase F (standard collision energy). Byonic LogProb: 9.51, Byonic Score: 362.3.
Figure 3
Figure 3
Low energy MS/MS spectra of selected human glycopeptides. (a) GSQWSDIEEFCNR –N4H5S2 glycopeptide (m/z 1278.1558) derived from DAF_HUMAN at 13 V (35% of the “standard” collision energy). (b) GHTLTLNFTR –N2H7 glycopeptide (m/z 900.7216) derived from LAMP1_HUMAN at 13.8 V (40% of the “standard” collision energy). Fragment intensities were enlarged by a factor of 5 for better visibility. (c) LLNINPNK –N4H5F glycopeptide (m/z 1347.5967) derived from LAMP1_HUMAN at 10.3 V (30% of the “standard” collision energy). (N: N-acetylhexosamine, H: hexose, S: sialic acid, F: fucose).
Figure 4
Figure 4
Degree of sialylation and fucosylation of human glycoproteins and bovine glycoprotein impurities. Values of human glycoproteins are different from those determined for the bovine glycoprotein impurities in the commercial HeLa sample. The abundance-weighted average of these is similar to that calculated from data in the literature based on released glycan analysis.

References

    1. Masters JR. HeLa cells 50 years on: the good, the bad and the ugly. Nat Rev Cancer. 2002;2:315–319. doi: 10.1038/nrc775. - DOI - PubMed
    1. Nagaraj N, et al. Deep proteome and transcriptome mapping of a human cancer cell line. Mol Syst Biol. 2011;7:548. doi: 10.1038/msb.2011.81. - DOI - PMC - PubMed
    1. Thiede B, et al. High resolution quantitative proteomics of HeLa cells protein species using stable isotope labeling with amino acids in cell culture(SILAC), two-dimensional gel electrophoresis(2DE) and nano-liquid chromatograpohy coupled to an LTQ-OrbitrapMass spectrometer. Mol Cell Proteomics. 2013;12:529–538. doi: 10.1074/mcp.M112.019372. - DOI - PMC - PubMed
    1. Fountoulakis M, Tsangaris G, Oh JE, Maris A, Lubec G. Protein profile of the HeLa cell line. J Chromatogr A. 2004;1038:247–265. doi: 10.1016/j.chroma.2004.03.032. - DOI - PubMed
    1. Révész Á, et al. Selection of Collision Energies in Proteomics Mass Spectrometry Experiments for Best Peptide Identification: Study of Mascot Score Energy Dependence Reveals Double Optimum. J Proteome Res. 2018;17:1898–1906. doi: 10.1021/acs.jproteome.7b00912. - DOI - PubMed

Publication types