

Metabolite-related dietary patterns and the development of islet autoimmunity
- PMID: 31616039
- PMCID: PMC6794249
- DOI: 10.1038/s41598-019-51251-4
Metabolite-related dietary patterns and the development of islet autoimmunity
Abstract
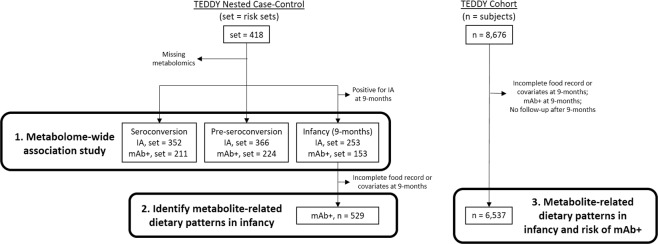
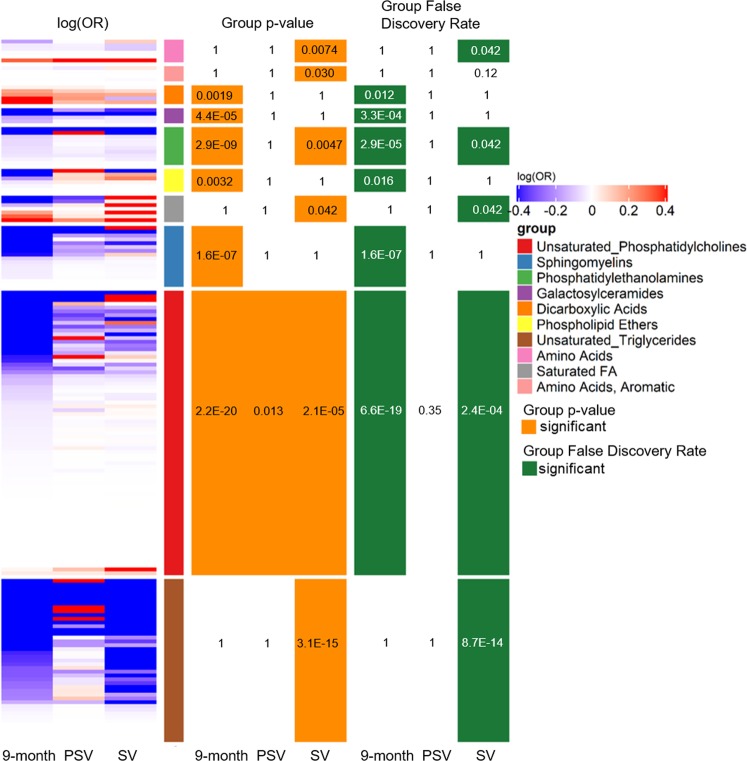
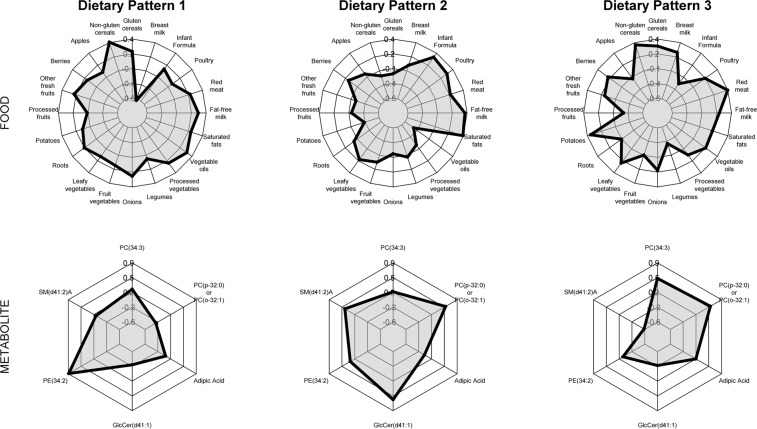
The role of diet in type 1 diabetes development is poorly understood. Metabolites, which reflect dietary response, may help elucidate this role. We explored metabolomics and lipidomics differences between 352 cases of islet autoimmunity (IA) and controls in the TEDDY (The Environmental Determinants of Diabetes in the Young) study. We created dietary patterns reflecting pre-IA metabolite differences between groups and examined their association with IA. Secondary outcomes included IA cases positive for multiple autoantibodies (mAb+). The association of 853 plasma metabolites with outcomes was tested at seroconversion to IA, just prior to seroconversion, and during infancy. Key compounds in enriched metabolite sets were used to create dietary patterns reflecting metabolite composition, which were then tested for association with outcomes in the nested case-control subset and the full TEDDY cohort. Unsaturated phosphatidylcholines, sphingomyelins, phosphatidylethanolamines, glucosylceramides, and phospholipid ethers in infancy were inversely associated with mAb+ risk, while dicarboxylic acids were associated with an increased risk. An infancy dietary pattern representing higher levels of unsaturated phosphatidylcholines and phospholipid ethers, and lower sphingomyelins was protective for mAb+ in the nested case-control study only. Characterization of this high-risk infant metabolomics profile may help shape the future of early diagnosis or prevention efforts.
Conflict of interest statement
The authors declare no competing interests.
Figures
References
-
- International Diabetes Federation. IDF diabetes atlas. (International Diabetes Federation, 2015).
Publication types
MeSH terms
Substances
Grants and funding
- U01 DK063821/DK/NIDDK NIH HHS/United States
- UC4 DK063863/DK/NIDDK NIH HHS/United States
- HHSN267200700014C/DK/NIDDK NIH HHS/United States
- U01 DK063861/DK/NIDDK NIH HHS/United States
- U01 DK063790/DK/NIDDK NIH HHS/United States
- UL1 TR001082/TR/NCATS NIH HHS/United States
- R01-DK104351/U.S. Department of Health & Human Services | NIH | National Institute of Diabetes and Digestive and Kidney Diseases (National Institute of Diabetes & Digestive & Kidney Diseases)/International
- R01 DK104351/DK/NIDDK NIH HHS/United States
- UL1 TR000064/TR/NCATS NIH HHS/United States
- U01 DK063836/DK/NIDDK NIH HHS/United States
- U01 DK063829/DK/NIDDK NIH HHS/United States
- U01 DK063865/DK/NIDDK NIH HHS/United States
- UC4 DK095300/DK/NIDDK NIH HHS/United States
- UC4 DK063861/DK/NIDDK NIH HHS/United States
- UC4 DK063829/DK/NIDDK NIH HHS/United States
- UC4 DK063821/DK/NIDDK NIH HHS/United States
- UC4 DK117483/DK/NIDDK NIH HHS/United States
- UC4 DK063836/DK/NIDDK NIH HHS/United States
- UC4 DK112243/DK/NIDDK NIH HHS/United States
- UC4 DK063865/DK/NIDDK NIH HHS/United States
- U01 DK063863/DK/NIDDK NIH HHS/United States
- UC4 DK106955/DK/NIDDK NIH HHS/United States
- UC4 DK100238/DK/NIDDK NIH HHS/United States
