

Gene-Related Cerebellar Neurodegeneration in SCA3/MJD: A Case-Controlled Imaging-Genetic Study
- PMID: 31616370
- PMCID: PMC6768953
- DOI: 10.3389/fneur.2019.01025
Gene-Related Cerebellar Neurodegeneration in SCA3/MJD: A Case-Controlled Imaging-Genetic Study
Erratum in
-
Corrigendum: Gene-Related Cerebellar Neurodegeneration in SCA3/MJD: A Case-Controlled Imaging-Genetic Study.Front Neurol. 2020 Feb 7;11:30. doi: 10.3389/fneur.2020.00030. eCollection 2020. Front Neurol. 2020. PMID: 32117003 Free PMC article.
Abstract
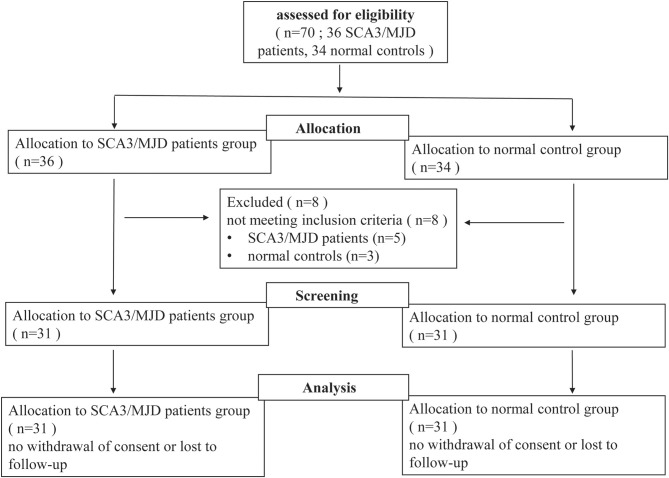
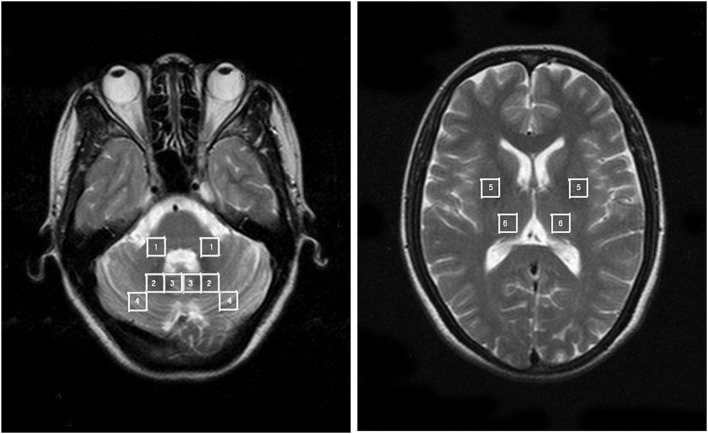
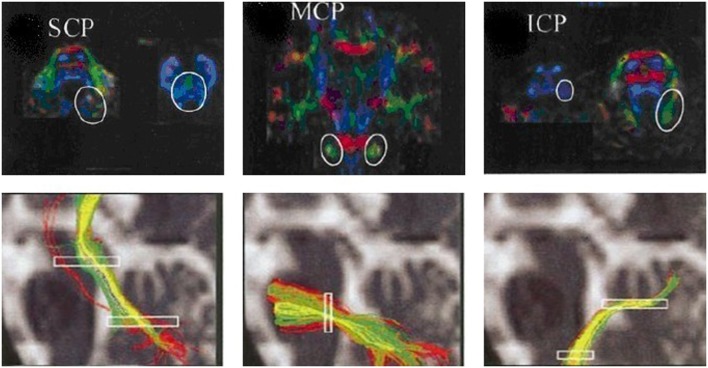
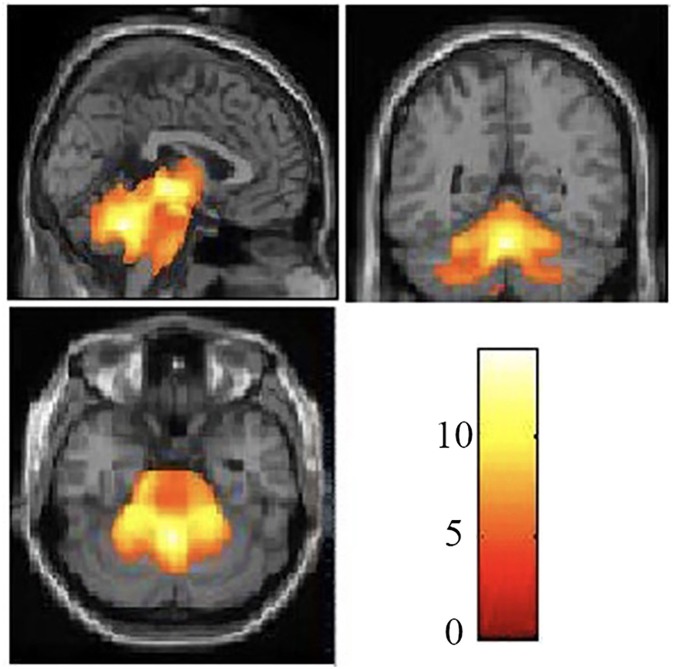
Background: Spinocerebellar ataxia type 3/Machado-Joseph disease (SCA3/MJD) is one of the nine polyglutamine (polyQ) diseases and is caused by a CAG repeat expansion within the coding sequence of the ATXN3 gene. Few multimodal imaging analyses of the macro- and micro-structural changes have been performed. Methods: In the present study, we recruited 31 genetically-confirmed symptomatic SCA3/MJD patients and 31 healthy subjects as controls for a multimodal neuroimaging study using structural magnetic resonance imaging (sMRI), proton magnetic resonance spectroscopy (1H-MRS) and diffusion tensor imaging (DTI). Results: The SCA3/MJD patients displayed a significantly reduced of gray matter volume in the cerebellum, pons, midbrain and medulla, as well as inferior frontal gyrus and insula, and left superior frontal gyrus. The total International Cooperative Ataxia Rating Scale (ICARS) score was inversely correlated with the gray matter volume in the cerebellar culmen, pons and midbrain. The numbers of CAG repeats in the expanded alleles were inversely correlated with the gray matter in the cerebellar culmen. NAA/Cr and NAA/Cho ratio in the middle cerebellar peduncles, dentate nucleus, cerebellar vermis, and thalamus in the SCA3/MJD patients were significantly reduced when compared to that in the normal controls, suggesting neurochemical alterations in cerebellum in the SCA3/MJD patients. Tract-Based Spatial Statistics (TBSS) analysis revealed significant lower volume and mean FA values of the cerebellar peduncles, which inversely correlated with the total scores of ICARS in our patients. Conclusions: In this study, we demonstrated cerebellar degeneration in SCA3/MJD based on tissue volume, neurochemistry, and tissue microstructure. Moreover, the associations between the clinical measures, cerebellar degeneration and genetic variation support a distinct genotype-phenotype relationship in SCA3/MJD.
Keywords: 1HMRS; gray matter; imaging genetics study; spinocerebellar ataxia 3; white matter.
Copyright © 2019 Peng, Liang, Long, Chen, Shi, Xia, Meng, Tang, Qiu and Jiang.
Figures
References
LinkOut - more resources
Full Text Sources