. 2020 Jan 28;30(2):74-85.
doi: 10.1093/glycob/cwz084.

O-glycosylation on cerebrospinal fluid and plasma apolipoprotein E differs in the lipid-binding domain

Affiliations

O-glycosylation on cerebrospinal fluid and plasma apolipoprotein E differs in the lipid-binding domain

Sarah A Flowers et al. Glycobiology. .

Abstract

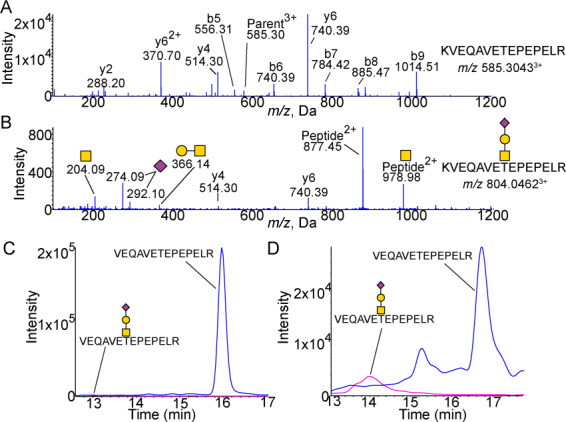
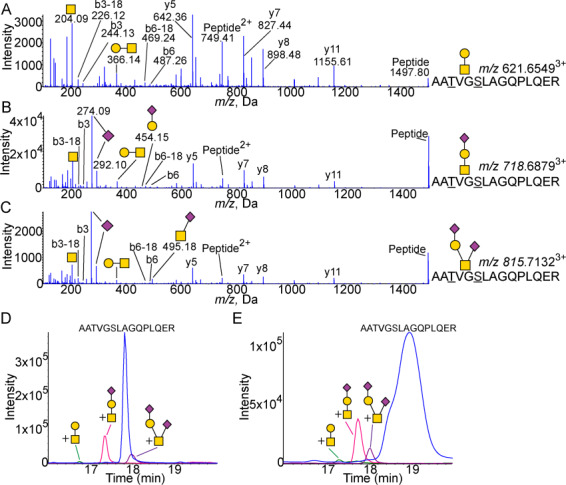
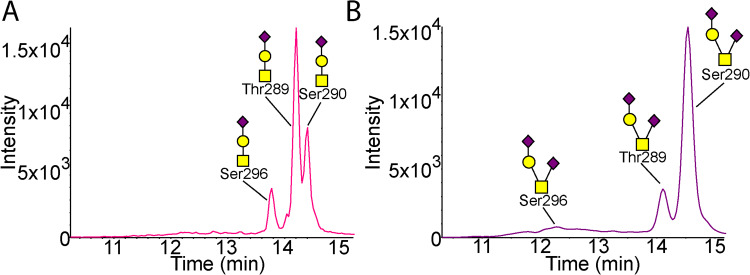
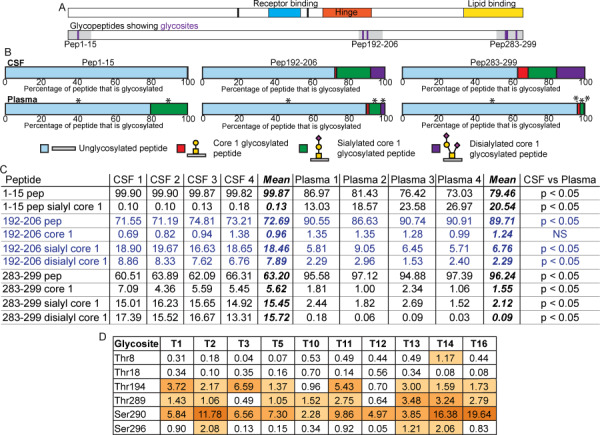
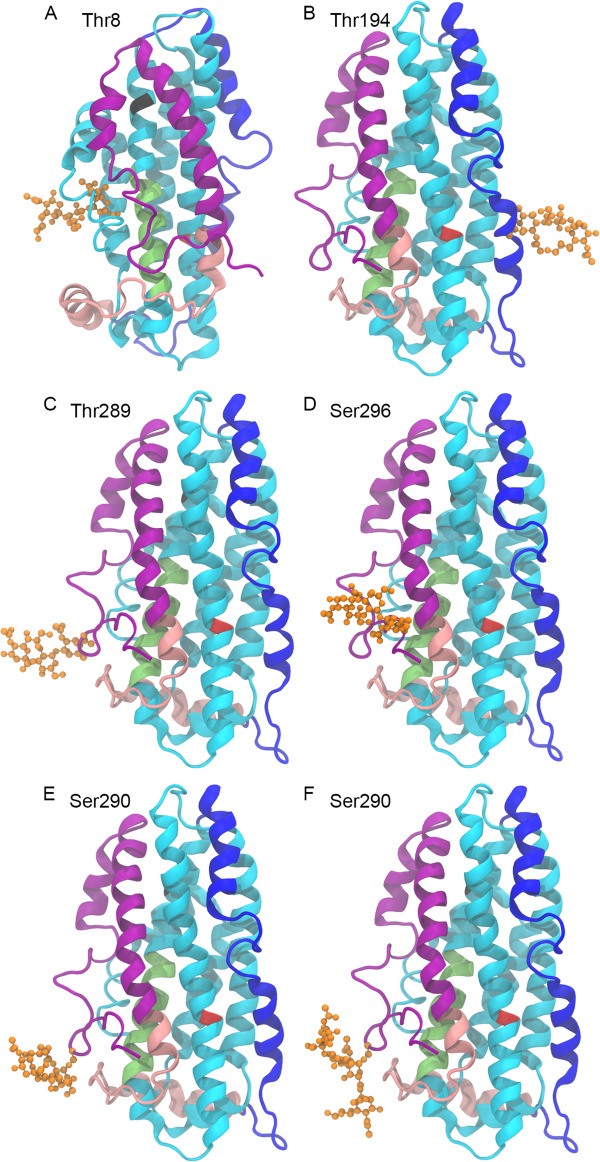
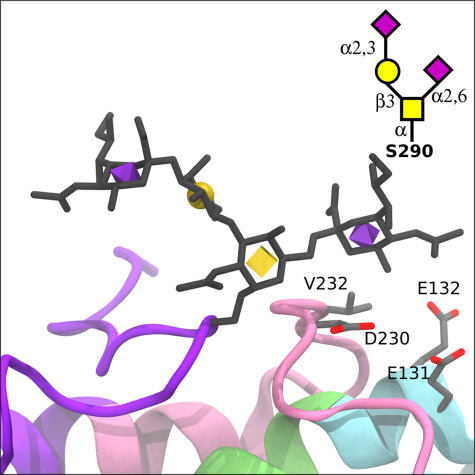
The O-glycoprotein apolipoprotein E (APOE), the strongest genetic risk factor for Alzheimer's disease, associates with lipoproteins. Cerebrospinal fluid (CSF) APOE binds only high-density lipoproteins (HDLs), while plasma APOE attaches to lipoproteins of diverse sizes with binding fine-tuned by the C-terminal loop. To better understand the O-glycosylation on this critical molecule and differences across tissues, we analyzed the O-glycosylation on APOE isolated from the plasma and CSF of aged individuals. Detailed LC-MS/MS analyses allowed the identification of the glycosite and the attached glycan and site occupancy for all detectable glycosites on APOE and further three-dimensional modeling of physiological glycoforms of APOE. APOE is O-glycosylated at several sites: Thr8, Thr18, Thr194, Ser197, Thr289, Ser290 and Ser296. Plasma APOE held more abundant (20.5%) N-terminal (Thr8) sialylated core 1 (Neu5Acα2-3Galβ1-3GalNAcα1-) glycosylation compared to CSF APOE (0.1%). APOE was hinge domain glycosylated (Thr194 and Ser197) in both CSF (27.3%) and plasma (10.3%). CSF APOE held almost 10-fold more abundant C-terminal (Thr289, Ser290 and Ser296) glycosylation (36.8% of CSF peptide283-299 was glycosylated, 3.8% of plasma peptide283-299), with sialylated and disialylated (Neu5Acα2-3Galβ1-3(Neu5Acα2-6) GalNAcα1-) core 1 structures. Modeling suggested that C-terminal glycosylation, particularly the branched disialylated structure, could interact across domains including the receptor-binding domain. These data, although limited by sample size, suggest that there are tissue-specific APOE glycoforms. Sialylated glycans, previously shown to improve HDL binding, are more abundant on the lipid-binding domain of CSF APOE and reduced in plasma APOE. This indicates that APOE glycosylation may be implicated in lipoprotein-binding flexibility.

Keywords: APOE; Alzheimer’s disease; glycoproteomics; lipoprotein binding; tissue-specific glycosylation.


Figures

Fig. 1
Fig. 1
Glycosylation of the N-Terminal 1–15 peptide. (A) MS/MS spectra of unglycosylated KVEQAVETEPEPELR peptide. Expected m/z 585.3037. (B) MS/MS spectra of peptide with Neu5Acα2–3Galβ1–3GalNAcα1 attached showing peaks of Neu5Ac (m/z 274.09 and 292.10) as well as Galβ1–3GalNAc (m/z 366.14) and GalNac (m/z 204.09). Expected m/z 804.0463. XICs of unglycosylated and sialylated core 1 glycosylated 1–15 peptide from (C) CSF (n = 4) and (D) plasma (n = 4). CSF shows a higher proportion of unglycosylated peptide with the glycosylated peptide. The background is low except for the unglycosylated peptide in plasma which shows a higher background generally as well as an additional unrelated peak (confirmed to be unrelated by MS/MS) at 15.3 min. Blue is peptide. Pink is peptide with Neu5Acα2–3Galβ1–3GalNAcα1 structure attached. All masses are observed masses.
Fig. 2
Fig. 2
Glycosylation of the hinge domain 192–206 peptide. (A) MS/MS spectra of core 1 glycosylated AATVGSLAGQPLQER pep192–206 showing peaks Galβ1–3GalNAc (m/z 366.14) and GalNac (m/z 204.09). Expected m/z 621.6496. (B) MS/MS spectra of the peptide with Neu5Acα2–3Galβ1–3GalNAcα1 attached showing peaks of Neu5Ac (m/z 274.09 and 292.10) as well as Galβ1–3GalNAc (m/z 366.14) and GalNac (m/z 204.09). The linear structure is confirmed by the m/z 454.15 Neu5Acα2–3Gal fragment. Expected m/z 718.6813. (C) MS/MS spectra of peptide with Neu5Acα2–3Galβ1–3(Neu5Acα2–6)GalNAcα1 attached showing peaks of Neu5Ac (m/z 274.09 and 292.10) as well as Galβ1–3GalNAc (m/z 366.14), Neu5Acα2–6GalNAc (m/z 495.18) and GalNac (m/z 204.09). Expected m/z 815.7131. XICs of unglycosylated and glycosylated 192–206 peptide from (D) CSF (n = 4) and (E) plasma (n = 4). Blue is peptide. Green is peptide with core 1 structure attached. Pink is peptide with sialylated core 1 structure attached. Purple is peptide with disialylated core 1 structure attached. All masses are observed masses.
Fig. 3
Fig. 3
Glycosylation of the lipid-binding domain 283–299 peptide in CSF. (A) XIC of Neu5Acα2–3Galβ1–3GalNAcα1 glycosylated 283–299 peptide from CSF (n = 4). (B) XIC of Neu5Acα2–3Galβ1–3(Neu5Acα2–6)GalNAcα1 glycosylated 283–299 peptide from CSF (n = 4). Each chromatogram shows three glycoforms of the 283–299 peptide for the two glycan structures as confirmed by MS/MS. MS/MS are shown in Fig. S6. Pink is peptide with sialylated core 1 structure attached. Purple is peptide with disialylated core 1 structure attached.
Fig. 4
Fig. 4
Comparison of the glycoprofiles of CSF and plasma APOE. (A) Schematic of APOE domain structures showing amino acids 112 and 158 in black, the receptor-binding domain in blue, the hinge in orange and the lipid-binding domain in yellow. The schematic below shows glycosylated tryptic peptides in grey with position of glycosites in purple. (B) Average percentage of identified peptide that was unglycosylated (pale blue), glycosylated with Galβ1–3GalNAcα1- (red), Neu5Acα2–3Galβ1–3GalNAcα1- (green) or Neu5Acα2–3Galβ1–3(Neu5Acα2–6)GalNAcα1- (purple) from CSF (n = 4, top) and plasma (n = 4, bottom) samples. Asterisks (*) above the plasma bars designates peptides that showed a statistically significant difference between the CSF and plasma samples where the P value was less than 0.05 as determined by a Mann–Whitney nonparametric test. P values were FDR adjusted to correct for multiple comparisons. (C) Relative quantitative data and statistics for individual CSF and plasma samples shown in (B). All data are shown as percentages, and the mean follows the four CSF and four plasma samples. As described above, Mann–Whitney non-parametric tests were performed to compare the results obtained for each peptide from the CSF and plasma samples. P values were FDR-adjusted to correct for multiple comparisons. These P value results are shown at the end of the table with significance designated as a P value of less than 0.05. Blue text is used only to delineate peptides for ease of reading. (D) ISOGlyP results for APOE glycosites. T refers to the individual GalNAc-T. Results are shown as EVP (enhancement value product) which refers to the preference a GalNAc-T shows towards glycosylating a glycosite: greater than 1 correlates with a positive likelihood of that glycosite being able to be glycosylated by that GalNAc-T, and less than 1 suggests a negative correlation with that specific GalNAc-T. The EVP does not correlate with the probability of that glycosite being glycosylated. ISOGlyP results are GalNAc-T-specific as it only considers 10 of the 20 known enzymes; others may contribute to glycosylation at any particular glycosite.
Fig. 5
Fig. 5
Structures of CSF and plasma glycovariants. All APOE structures are APOE3 NMR crystal structure 2L7B with the following glycosylation modeled at the indicated glycosites. (A) Thr8 glycosylated with Neu5Acα2–3Galβ1–3GalNAcα1-, most abundant in plasma APOE. (B) Thr194 glycosylated with Neu5Acα2–3Galβ1–3GalNAcα1-, identified in plasma and CSF APOE. (CF) C-terminal glycosites, most abundant in CSF APOE. (C) Thr289 glycosylated with Neu5Acα2–3Galβ1–3GalNAcα1. (D) Ser296 glycosylated with Neu5Acα2–3Galβ1–3GalNAcα1. (E) Ser290 glycosylated with Neu5Acα2–3Galβ1–3GalNAcα1-. (F) Ser290 glycosylated with Neu5Acα2–3Galβ1–3(Neu5Acα2–6)GalNAcα1-. The protein backbone is displayed in NewCartoon. The N-terminal region is cyan with the LDL receptor-binding domain in lime. The hinge region is in blue. The C-terminal is in pink with the lipid-binding region in purple. Amino acid 112 is red, amino acid 158 is black. The glycan is in orange displayed in CPK.
Fig. 6
Fig. 6
Structural changes due to sialylated glycovariants in the lipid-binding domain. The APOE3 crystal structure with a disialylated core 1 glycan (Neu5Acα2–3Galβ1–4[Neu5Acα2–6]GalNAcα) modeled at Ser290 (displayed as licorice with 3D-SNFG icons), which is part of the C-terminal lipid-binding region (purple). Relative to the monosialylated core 1 structure, the α2–6 linked Neu5Ac could potentially form interactions with the C-terminal domain (pink) via V232 and D230, as well as the LDL receptor-binding domain (lime green) via E132 and E131.

References

    1. Achariyar TM, Li B, Peng W, Verghese PB, Shi Y, McConnell E, Benraiss A, Kasper T, Song W, Takana T et al. . 2016. Glymphatic distribution of CSF-derived apoE into brain is isoform specific and suppressed during sleep deprivation. Mol Neurodegener. 11:74. - PMC - PubMed
    1. Ali L, Flowers SA, Jin C, Bennet EP, Ekwall AK, Karlsson NG. 2014. The O-glycomap of lubricin, a novel mucin responsible for joint lubrication, identified by site-specific glycopeptide analysis. Mol Cell Proteomics. 13:3396–3409. - PMC - PubMed
    1. Beisiegel U. 1998. Lipoprotein metabolism. Eur Heart Journal. 19(Suppl A):A20–A23. - PubMed
    1. Bennett EP, Mandel U, Clausen H, Gerken TA, Fritz TA, Tabak LA. 2012. Control of mucin-type O-glycosylation: A classification of the polypeptide GalNAc-transferase gene family. Glycobiology. 22:736–756. - PMC - PubMed
    1. Berman HM, Westbrook J, Feng Z, Gilliland G, Bhat TN, Weissig H, Shindyalov IN, Bourne PE. 2000. The Protein Data Bank. Nucleic Acids Res. 28:235–242. - PMC - PubMed

Publication types