Six-Month Randomized, Multicenter Trial of Closed-Loop Control in Type 1 Diabetes
- PMID: 31618560
- PMCID: PMC7076915
- DOI: 10.1056/NEJMoa1907863
Six-Month Randomized, Multicenter Trial of Closed-Loop Control in Type 1 Diabetes
Abstract
Background: Closed-loop systems that automate insulin delivery may improve glycemic outcomes in patients with type 1 diabetes.
Methods: In this 6-month randomized, multicenter trial, patients with type 1 diabetes were assigned in a 2:1 ratio to receive treatment with a closed-loop system (closed-loop group) or a sensor-augmented pump (control group). The primary outcome was the percentage of time that the blood glucose level was within the target range of 70 to 180 mg per deciliter (3.9 to 10.0 mmol per liter), as measured by continuous glucose monitoring.
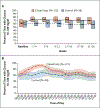
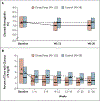
Results: A total of 168 patients underwent randomization; 112 were assigned to the closed-loop group, and 56 were assigned to the control group. The age range of the patients was 14 to 71 years, and the glycated hemoglobin level ranged from 5.4 to 10.6%. All 168 patients completed the trial. The mean (±SD) percentage of time that the glucose level was within the target range increased in the closed-loop group from 61±17% at baseline to 71±12% during the 6 months and remained unchanged at 59±14% in the control group (mean adjusted difference, 11 percentage points; 95% confidence interval [CI], 9 to 14; P<0.001). The results with regard to the main secondary outcomes (percentage of time that the glucose level was >180 mg per deciliter, mean glucose level, glycated hemoglobin level, and percentage of time that the glucose level was <70 mg per deciliter or <54 mg per deciliter [3.0 mmol per liter]) all met the prespecified hierarchical criterion for significance, favoring the closed-loop system. The mean difference (closed loop minus control) in the percentage of time that the blood glucose level was lower than 70 mg per deciliter was -0.88 percentage points (95% CI, -1.19 to -0.57; P<0.001). The mean adjusted difference in glycated hemoglobin level after 6 months was -0.33 percentage points (95% CI, -0.53 to -0.13; P = 0.001). In the closed-loop group, the median percentage of time that the system was in closed-loop mode was 90% over 6 months. No serious hypoglycemic events occurred in either group; one episode of diabetic ketoacidosis occurred in the closed-loop group.
Conclusions: In this 6-month trial involving patients with type 1 diabetes, the use of a closed-loop system was associated with a greater percentage of time spent in a target glycemic range than the use of a sensor-augmented insulin pump. (Funded by the National Institute of Diabetes and Digestive and Kidney Diseases; iDCL ClinicalTrials.gov number, NCT03563313.).
Copyright © 2019 Massachusetts Medical Society.
Figures


Comment in
-
Toward Automated Insulin Delivery.N Engl J Med. 2019 Oct 31;381(18):1774-1775. doi: 10.1056/NEJMe1912822. Epub 2019 Oct 16. N Engl J Med. 2019. PMID: 31618534 No abstract available.
-
Multicenter Trial of Closed-Loop Control in Type 1 Diabetes.N Engl J Med. 2020 Feb 6;382(6):577. doi: 10.1056/NEJMc1915995. N Engl J Med. 2020. PMID: 32023381 No abstract available.
-
Multicenter Trial of Closed-Loop Control in Type 1 Diabetes.N Engl J Med. 2020 Feb 6;382(6):577-578. doi: 10.1056/NEJMc1915995. N Engl J Med. 2020. PMID: 32023382 No abstract available.
-
Closed-loop insulin delivery system enhances type 1 diabetes glycemic control.J Pediatr. 2020 Mar;218:259-262. doi: 10.1016/j.jpeds.2019.12.050. J Pediatr. 2020. PMID: 32089183 No abstract available.
References
-
- American Diabetes Association. Glycemic targets: Standards of Medical Care in Diabetes — 2019. Diabetes Care 2019; 42: Suppl 1: S61–S70. - PubMed
-
- Kovatchev B The artificial pancreas in 2017: the year of transition from research to clinical practice. Nat Rev Endocrinol 2018; 14: 74–6. - PubMed
-
- Kovatchev B A century of diabetes technology: signals, models, and artificial pancreas control. Trends Endocrinol Metab 2019; 30: 432–44. - PubMed
Publication types
MeSH terms
Substances
Associated data
Grants and funding
LinkOut - more resources
Full Text Sources
Other Literature Sources
Medical
Miscellaneous
