. 2019 Oct 15;51(4):696-708.e9.
doi: 10.1016/j.immuni.2019.09.004.

Transcriptional Atlas of Intestinal Immune Cells Reveals that Neuropeptide α-CGRP Modulates Group 2 Innate Lymphoid Cell Responses

Affiliations

Transcriptional Atlas of Intestinal Immune Cells Reveals that Neuropeptide α-CGRP Modulates Group 2 Innate Lymphoid Cell Responses

Heping Xu et al. Immunity. .

Abstract

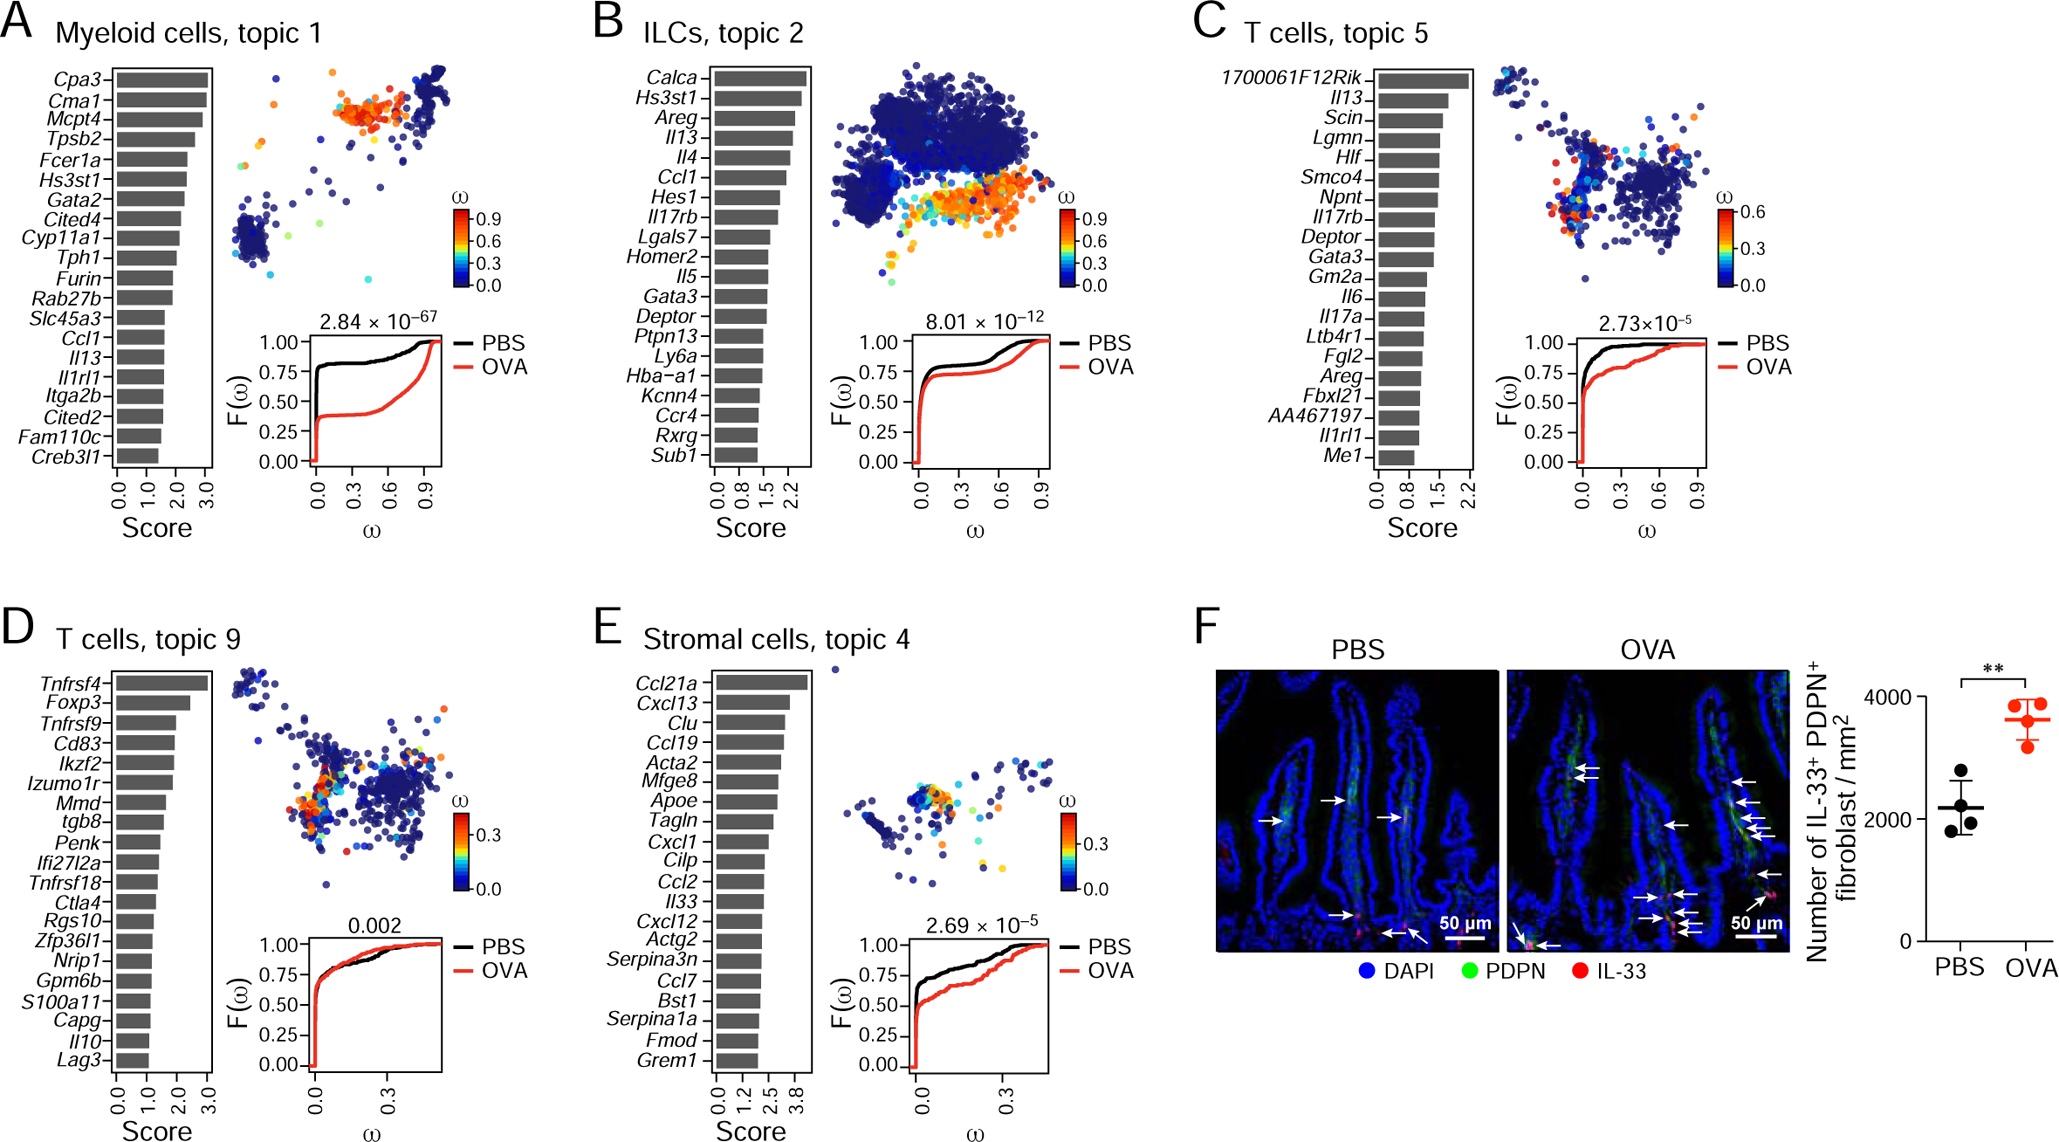
Signaling abnormalities in immune responses in the small intestine can trigger chronic type 2 inflammation involving interaction of multiple immune cell types. To systematically characterize this response, we analyzed 58,067 immune cells from the mouse small intestine by single-cell RNA sequencing (scRNA-seq) at steady state and after induction of a type 2 inflammatory reaction to ovalbumin (OVA). Computational analysis revealed broad shifts in both cell-type composition and cell programs in response to the inflammation, especially in group 2 innate lymphoid cells (ILC2s). Inflammation induced the expression of exon 5 of Calca, which encodes the alpha-calcitonin gene-related peptide (α-CGRP), in intestinal KLRG1+ ILC2s. α-CGRP antagonized KLRG1+ ILC2s proliferation but promoted IL-5 expression. Genetic perturbation of α-CGRP increased the proportion of intestinal KLRG1+ ILC2s. Our work highlights a model where α-CGRP-mediated neuronal signaling is critical for suppressing ILC2 expansion and maintaining homeostasis of the type 2 immune machinery.

Keywords: CGRP; allergic inflammation; batch effect correction; intestinal immune cell atlas; neuro-immune interaction; neuropeptides; scRNA-seq; single cell genomics; topic model; type 2 innate lymphoid cells.


Conflict of interest statement

DECLARATION OF INTERESTS

A.R. is a SAB member of ThermoFisher Scientific, Neogene Therapeutics and Syros Pharmaceuticals. A.R. and R.J.X. are cofounders of and equity holders in Celsius Therapeutics. H.X., R.J.X. and A.R. are co-inventors on US provisional patent application no. 62/667,381 filed by The Broad Institute relating to the subject matter of this manuscript. AR, HX, JD and RX are co-inventors on US provisional patent application no 62/818,404 filed by the Broad Institute relating to CGRP signaling modulation.

Figures

Figure 1.
Figure 1.. A single-cell expression atlas of intestinal immune cells
(A) Experimental overview. (B) Cell subsets in the intestinal immune cell atlas. scvis learned two-dimensional (2D) representation of cell profiles (dots) from both PP and LP regions, colored and numbered by cluster membership. Clusters are rank ordered by size. DZ, dark zone; LZ, light zone; DN, double negative; C1, cluster 1; C2, cluster 2. (C) Tissue distribution of non-T and non-B immune cells in homeostasis. Proportion (y axis) of each cell type in LP (red) and PP (black) regions of mice treated with PBS only. Points: independent mice; Boxplots: medians and interquartile ranges (IQR). Whiskers: lowest datum within 1.5 IQR of the lower quartile and the highest datum within 1.5 IQR of the upper quartile. *p < 5×10⁻², **p < 3×10⁻⁸, ***p < 3×10⁻⁹, Wald test. (D)LTi cells are enriched in PP regions. Shown is flow cytometry analysis gated on CD45+LinCD90.2+IL7R+RORγt+ cells. mean±SEM; ***p < 0.001, Fisher’s exact test. Data are from seven (B), three (C) or two (D) independent experiments. See also Figure S1, Table S1 and S2.
Figure 2.
Figure 2.. Increased ILC2 proportions and changes in ILC2 programs are key features in OVA-induced type 2 inflammation
(A,B) Increased ILC2 and mast cell frequencies are prominent features in type 2 inflammation. (A) A 2D embedding as in Figure 1B and colored by states (PBS or OVA). (B) Distribution of cell type proportions (y axis) for each non-T and non-B cell subset (x axis) in the combined PP+LP data set (top), PP (middle), or LP (bottom) in homeostatic (black) or OVA-induced inflammatory (red) conditions. Points: independent mice, Boxplots: IQR as in Figure 1C. *p < 5×10⁻², **p < 3×10⁻⁵, ***p < 7×10⁻¹¹, Wald test (STAR Methods). (C) ILC2s and mast cells show the most prominent changes in expression programs in type 2 inflammation. Number of genes significantly induced (black) or inhibited (grey) by OVA-induced type 2 inflammation in each cell subset (row) from the LP or PP regions. Data are from seven (A-C) independent experiments. See also Figure S2 and Table S3.
Figure 3.
Figure 3.. Topic modeling of cell type-specific programs in response to intestinal type 2 inflammation predicts Calca as a top gene in ILC2s
(A-E) Inflammation associated programs in specific cell subsets. Shown are some of the topics that have differential scores between steady state (PBS) and inflammatory conditions (OVA) for myeloid cells (A), ILCs (B), T cells (C, D) or stromal cells (E). Left: bar plot showing the scores (x axis) of top ranked genes for this topic (y axis). Top right: a portion of the 2D embedding in Figure 1B, showing only cells from the noted subset cells, colored by the topic’s weight in the cell (top right). Bottom right: empirical cumulative density function (y axis) of topic weights (x axis) for cells from mice treated with PBS (black curve) or OVA (red curve). p values: Mann–Whitney U test. (F) Increased number of IL-33+PDPN+ fibroblasts in inflammation. Left: representative IF images of the small intestines. Arrow, IL-33+PDPN+ fibroblasts; Scale bars, 50 μm. Points: individual mice. mean and SEM, **p < 0.01, Student’s t test. Data are from seven (A-E) or two (F) independent experiments. See also Figure S3 and Table S4.
Figure 4.
Figure 4.. α-CGRP suppresses IL-25-induced activation and expansion of intestinal KLRG1+ ILC2s in vitro
(A) Cells expressing Calca gene. 2D embedding as in Figure 1B where cells (dots) are colored by relative expression of Calca (log2(TP10K+1)), where TP10K represents transcripts per 10,000. (B) α-CGRP exon specifically induced in inflammation. Expression amounts (y axis) of α-CGRP exon of Calca, Calcrl, and Ramp1 in LP ILC2s isolated from control (black) or OVA-treated (red) mice on day 36 (Figure S1A). Points: individual experiments. (C,D) α-CGRP co-treatment abrogates most of the IL-25 induced response in LP ILC2s in vitro. (C) Expression (color bar, Z score) of genes (rows) significantly induced in ILC2s (Fold change ≥ 2, p < 0.05) by IL-25 compared to control, across different conditions. (D) Intracellular amounts (mean fluorescence intensity (MFI), y axis) of IL-13 and IL-5 in ILC2s following indicated stimulations for 12 hours. Points: individual experiments. (E) α-CGRP suppresses IL-25-indcued proliferation of LP ILC2s. Left: distribution of number of cell divisions (y axis, % of maximum observed number) monitored by flow cytometry. Right: percent of dividing cells (y axis) in each treatment (x axis). Points: individual experiments. mean±SEM, * p< 0.05, ** p < 0.01, *** p < 0.001, Student’s t test (B, D, E). Data are from seven (A) or five (B, D, E) independent experiments, or representative of two (C) independent experiments. See also Figure S4.
Figure 5.
Figure 5.. α-CGRP antagonizes expansion of intestinal KLRG1+ ILC2s in vivo
(A) Experimental design. (B) α-CGRP co-treatment antagonizes ILC2 expansion in vivo. Representative IF images (left, Scale bars, 100 μm) and cell densities (number of cells/mm2) of CD3KLRG1+ ILC2 (left, arrows) in the small intestines of mice treated as in A. Points: individual mice. (C-E) α-CGRP antagonizes the expansion of ST2KLRG1+ ILC2s specifically. (C) Flow cytometry analysis of ILC2s in mLNs gated on CD45+LinCD90.2+IL7R+ from mice treated as in (A). (D) Frequency (y axis) of ST2KLRG1+ ILC2s in total CD45+ cells in mLNs of mice treated as in A. Points: individual mice. (E) Frequency (y axis) of ST2+ ILC2s in total CD45+ cells in mLNs of mice treated as in A. Point: individual mice. (F,G) α-CGRP treatment antagonizes LP ILC2 expansion in OVA-induced type 2 inflammatory model. (F) Experimental overview. (G) Percent of ILC2s (y axis) in total CD45+ cells in mice treated as in F on day 36. Point: individual mice. (H) α-CGRP treatment suppresses expansion of mast cells in LP in OVA-induced type 2 inflammatory model. Percent of FceRIa+SiglecFlow/−Linlow mast cells (y axis) in total CD45+ cells in mice treated as in F on day 36. mean±SEM, * p< 0.05, ** p < 0.01, *** p < 0.001, NS: p> 0.05, Student’s t test (B, D, E, G, H). Data are from two (B) three (C, D, E) or four (G, H) independent experiments. See also Figure S5.
Figure 6.
Figure 6.. α-CGRP is produced by ChAT+ enteric neurons in steady state and maintains intestinal KLRG1+ ILC2 homeostasis in vivo
(A,B) ChAT+ enteric neurons express α-CGRP. (A) t-SNE plot of 1,105 enteric neuron profiles from Wnt1-Cre:R26Tomato mice (Zeisel et al., 2018), where each neuron (dot) is colored by cluster assignment. (B) Distribution of expression amounts (y axis, log2(TP10K+1)) of Nmu, Calca, Calcb and Calcrl gene in the enteric neurons in each cluster in A (x axis). (C) co-localization of ChAT and CGRP in the small intestines of WT mice. Scale bar, 50 μm. (D) Expression program induced by α-CGRP in LP ILC2s. Relative expression (row-wise Z score of log2(TPM + 1)) of genes (rows) significantly induced or suppressed by α-CGRP stimulation for 3 hours. Key genes are highlighted. (E) α-CGRP stimulation in ILC2s in vitro reprograms chromatin accessibility especially at loci of a cAMP response module. Left: chromatin accessibility (log2(#cuts+1), STAR Methods) of loci (rows) with differential accessibility in LP ILC2s treated by α-CGRP vs. control in vitro for 3 hours. Right: statistical significance (x axis, −log10(q-value)) of molecular functions (y axis) whose associated genes are enriched in proximity to these differentially accessible ATAC-Seq peaks. Dashed line: q-value = 0.01. (F) α-CGRP induces intracellular cAMP accumulation in ILC2s. cAMP concentration (μM, y axis) in LP ILC2s stimulated in vitro for 30 minutes as measured by enzyme-linked immunosorbent assay (ELISA). Points: individual mice. (G,H) Forskolin suppresses ILC2 proliferation but does not impact cell viability. (G) Left: The number of cell divisions (y axis, % of maximum observed number) monitored by flow cytometry in LP ILC2s. Points: individual experiments. (H) Cell viability monitored by flow cytometry in cells in G stained with 7AAD. Points: individual experiments. (I) Adenylate cyclase inhibitor (SQ22, 536) treatment partially rescues α-CGRP inhibition of ILC2 proliferation. Percent of divided cells (y axis) as assayed as in F. LP ILC2s treated in vivo for 40 hours. Points: individual experiments. (J,K) The deficiency of α-CGRP affects ILC2 expansion in vivo. (J) Left: flow cytometry analysis of LP ILC2s in WT and CalcaΔexon5 mice in homeostasis. Points: individual mice. (K) Left: Representative IF images of tuft cells (arrows) in the small intestine of WT or CalcaΔexon5 mice. Scale bars, 50 μm. Right: Density of tuft cells (y axis, number per mm2) in WT and CalcaΔexon5 mice. Points: individual mice. mean±SEM, * p< 0.05, ** p < 0.01, *** p < 0.001, NS: p> 0.05, Student’s t test (F, G, H, I, J, K). Data are representative of three (C) or two (D) independent experiments, or are from single (E), three (F, J, K) or five (G, H, I) independent experiments. See also Figure S6 and Table S5.

Comment in

References

    1. Amara SG, Jonas V, Rosenfeld MG, Ong ES, and Evans RM (1982). Alternative RNA processing in calcitonin gene expression generates mRNAs encoding different polypeptide products. Nature 298, 240–244. - PubMed
    1. Artis D, and Spits H (2015). The biology of innate lymphoid cells. Nature 517, 293–301. - PubMed
    1. Assas BM, Pennock JI, and Miyan JA (2014). Calcitonin gene-related peptide is a key neurotransmitter in the neuro-immune axis. Front Neurosci 8, 23. - PMC - PubMed
    1. Bielecki P, Riesenfeld SJ, Kowalczyk MS, Amezcua Vesely MC, Kroehling L, Yaghoubi P, Dionne D, Jarret A, Steach HR, McGee HM, et al. (2018). Skin inflammation driven by differentiation of quiescent tissue-resident ILCs into a spectrum of pathogenic effectors. bioRxiv. bioRxiv, doi: 10.1101/461228. - DOI
    1. Biton M, Haber AL, Rogel N, Burgin G, Beyaz S, Schnell A, Ashenberg O, Su CW, Smillie C, Shekhar K, et al. (2018). T Helper Cell Cytokines Modulate Intestinal Stem Cell Renewal and Differentiation. Cell 175, 1307–1320 e1322. - PMC - PubMed

Publication types

MeSH terms