. 2019 Nov;575(7782):375-379.
doi: 10.1038/s41586-019-1667-4. Epub 2019 Oct 16.

The ADP/ATP translocase drives mitophagy independent of nucleotide exchange

Affiliations

The ADP/ATP translocase drives mitophagy independent of nucleotide exchange

Atsushi Hoshino et al. Nature. 2019 Nov.

Abstract

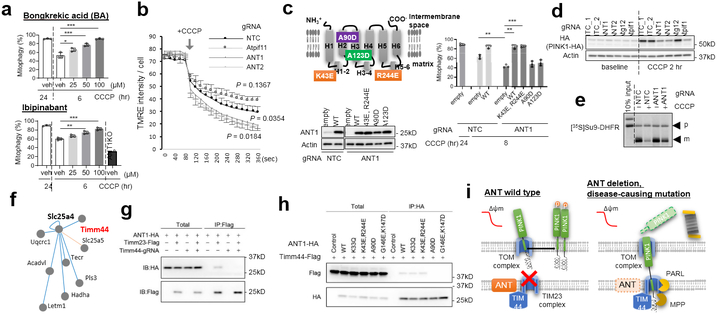
Mitochondrial homeostasis depends on mitophagy, the programmed degradation of mitochondria. Only a few proteins are known to participate in mitophagy. Here we develop a multidimensional CRISPR-Cas9 genetic screen, using multiple mitophagy reporter systems and pro-mitophagy triggers, and identify numerous components of parkin-dependent mitophagy1. Unexpectedly, we find that the adenine nucleotide translocator (ANT) complex is required for mitophagy in several cell types. Whereas pharmacological inhibition of ANT-mediated ADP/ATP exchange promotes mitophagy, genetic ablation of ANT paradoxically suppresses mitophagy. Notably, ANT promotes mitophagy independently of its nucleotide translocase catalytic activity. Instead, the ANT complex is required for inhibition of the presequence translocase TIM23, which leads to stabilization of PINK1, in response to bioenergetic collapse. ANT modulates TIM23 indirectly via interaction with TIM44, which regulates peptide import through TIM232. Mice that lack ANT1 show blunted mitophagy and consequent profound accumulation of aberrant mitochondria. Disease-causing human mutations in ANT1 abrogate binding to TIM44 and TIM23 and inhibit mitophagy. Together, our findings show that ANT is an essential and fundamental mediator of mitophagy in health and disease.


Figures

Extended Data Figure 1.
Extended Data Figure 1.. CRISPR library screening for PINK1-Parkin mediated mitophagy.
a,b, Mitophagy was induced in parkin and mt-mKeima expressing cells by treatment with a mitochondrial membrane potential uncoupler CCCP or a cocktail of suppressors of oxidative phosphorylation (OAR: Oligomycin, Antimycin A, and Rotenone). Mitophagy was analyzed by flow cytometry for mt-mKeima (a) and western blotting for mitochondrial protein in the outer membrane (Tom20), inner membrane (ATPB), or matrix (PDH) (b). c, Representative gate setting of cell sorting for each of the four indicated mitophagy assays: 1. Loss of MitoTracker labeling of mitochondrial membrane; 2. Loss of ectopically expressed outer membrane-targeted GFP (GFP-Omp25); 3. Loss of ectopically expressed matrix GFP protein (Cox8-GFP); and 4. Altered fluorescence of matrix-targeted mKeima. d, Genes in the KEGG mitophagy pathway. Genes identified as mitophagy accelerators or decelerators in CRISPR knockout, defined as Z-score > 1.5 in at least one screen, are indicated in green and red, respectively. Diameter of each circle is proportional to the Z-score of the indicated gene. Similar results were obtained in two biological replicates (a-c). For gel source data, see Supplementary Fig. 1.
Extended Data Figure 2
Extended Data Figure 2. Integration of seven mitophagy screens.
a, Gene set enrichment analysis of mitophagy accelerators. The top 1% of genes in aggregate Z-score were analyzed using ToppGene Suite,. Representative functional categories and Bonferroni-corrected P values are shown. b, Proportion of genes encoding mitochondrial proteins annotated in MitoCarta2.0 in the top 1 % of mitophagy accelerators and decelerators (left), and percentage of MitoCarta2.0 member genes identified as being either accelerators (green) or decelerators (red) of mitophagy (right). c, Five functional classes of proteins, based on MitoCarta2.0 annotations, were present in the top 1% of mitophagy accelerators. The representation of each class within the top 1% was compared to its representation in MitoCarta2.0 via a two-tailed Fisher’s exact test (FET). d, Box-and-whisker plots of most significant mitophagy accelerator hits in each of the 7 screens; line, median; box, 75-25 percentiles; whiskers (blue dots), 99–1 percentiles. Genes involved in oxidative phosphorylation (OXPHOS) are indicated in yellow. Pathway enrichment was calculated using a Kolmogorov-Smirnov (K-S) test.e, GSEA enrichment plot for OXPHOS (top) and ranked aggregate Z-scores of all genes. OXPHOS genes are indicated in yellow (bottom). f, Gene set enrichment analysis of mitophagy decelerators analyzed as (a). g-i, Genes in the KEGG endosomal sorting complexes required for transport (ESCRT) (g), homotypic fusion and vacuole protein sorting (HOPS) (h), and autophagosome (i) pathways. Genes identified as mitophagy accelerators or decelerators are indicated in green and red, respectively. Diameter of each circle is proportional to the Z-score of the indicated gene. j, Principle component analysis biplot summarizing variation across the seven screens based on cumulative z-scores of the top 100 genes, displayed as arrows. Autophagy-related genes are indicated. k, Mitochondrial membrane potential assessed by flowcytometry for TMRE is disrupted in CCCP treatment, but is increased in a cocktail of suppressors of oxidative phosphorylation (OAR: Oligomycin, Antimycin A, and Rotenone). Similar results were obtained in two biological replicates.
Extended Data Figure 3
Extended Data Figure 3. Essential LC3 receptors for mitophagy in C2C12 mouse myoblasts.
a,b, Validation as mitophagy decelerators of the indicated LC3 receptor gene gRNAs, using one library gRNAs and one non-library gRNAs and using the mt-mKeima assay (a) or Western blotting of mitochondrial proteins in the outer membrane (Tom20 and Tom70), inner membrane (ATPB), or matrix (PDH) (b); n = 3 biological replicates per gRNA, P values calculated by two-sided unpaired t test relative to NTC_1. Mitophagic degradation of mitochondrial inner membrane and matrix proteins, but not outer membrane proteins, were blocked by gRNA targeting Tax1bp1 or Tbk1, consistent with the notion that ubiquitinated outer membrane proteins can be degraded by the ubiquitin proteasome system. Similar results were obtained in two biological replicates. c,d, LC3 receptor redundancy and TBK1 contribution. The indicated gRNAs were transduced singly or in combination by lentivirus infection, followed by analysis by flow cytometry for mt-mKeima. Multiple gRNAs were superimposed on cells already targeted by Tax1bp1 gRNA (c) or by Tbk1 gRNA (d), as indicated; n = 3 biological replicates per gRNA. P values calculated by one-way ANOVA, post-hoc Tukey test, *P < 0.05, **P < 0.01, ***P < 0.001. Data are mean ± s.d.
Extended Data Figure 4
Extended Data Figure 4. The adenine nucleotide transporter (ANT) is required in Parkin-mediated mitophagy.
a, Impaired mitophagy in the absence of ANT is confirmed by flux analysis using a lysosome inhibitor, Bafilomycin A (1μM). Similar results were obtained in two biological replicates. b-c, Inhibition of mitophagy by CRISPR-mediated deletion of the indicated genes in murine N2A (b) and human SH-SY5Y (c) neuroblastoma cell lines. Representative flow tracings are shown on left, and quantification on right; n = 3 biological replicates per gRNA, P values calculated by two-sided unpaired t test relative to NTC_1. Data are mean ± s.d.
Extended Data Figure 5
Extended Data Figure 5. The adenine nucleotide transporter (ANT) is required in PINK1 stabilization.
a, Inhibition of ADP/ATP worsens the loss of membrane potential in response to CCCP. TMRE fluorescence intensity following treatment with CCCP was analyzed by confocal laser scanning microscopy with the application of live time-series program. Cells were pretreated with control and Bongkrekic acid; n = 4 biological replicates per group. P values calculated by two-way repeated measures ANOVA. b, Mitophagy was induced by OXPHOS inhibitors (Antimycin A and Oligomycin) in the presence of indicated concentration of ADP/ATP transport inhibitor, Bongkrekic acid, followed by flow cytometry for mt-mKeima; n = 3 biological replicates per group, P values calculated by one-way ANOVA, post-hoc Tukey test, **P < 0.01. c, Genetic inhibition of ADP/ATP worsens the loss of membrane potential in response to CCCP. ANT1 knockout cells were rescued by human wild-type (WT) or mutant ANT1; n = 3 biological replicates per group, P values calculated by two-way repeated measures ANOVA relative to NTC. d, ADP/ATP exchange rate is impaired in ADP/ATP-binding mutants (K33Q, K43E), but not in disease-causing mutants (A90D, V289M); n = 3 biological replicates per group, P values calculated by two-sided unpaired t test relative to WT. e, Loss of ANT impairs PINK1-dependent mitophagy induced by oxidative stress, but does not impair PINK1-independent mitophagy caused by hypoxia or starvation; n = 3 biological replicates per gRNA, P values calculated by two-sided unpaired t test relative to NTC. f, PINK1 accumulation in mitochondria is impaired in cells lacking ANT. Cells bearing gRNA targets to the indicated genes were transduced with PINK1-GFP, followed by treatment with CCCP versus control, and then immunostained using anti-Tom20 antibody (red). GFP fluorescence is shown in green, and merged signal in yellow. Scale bar, 20 μm. g, PINK1 stabilization by CCCP treatment is preserved in WT ANT and ADP/ATP-binding double mutant (K43E/R244E), but not in known disease-causing mutants (A90D, A123D). h, Phosphorylation of PINK1 after CCCP treatment is preserved in the absence of ANT1 or 2. i-j, PINK1 transcription (i) and translation (j) are not changed by loss of ANT; n = 4 biological replicates per group, P values calculated by one-way ANOVA. k, The activities of PINK1-cleaving protease, PARL and OMA1, are not changed by loss of ANT. l, General autophagy flux is preserved in the absence of ANT; n = 3 biological replicates per group, P values calculated by two-sided unpaired t test relative to NTC. m, Suppression of TIM23-mediated protein translocation in response to CCCP treatment is impaired in the absence of ANT1 or 2, as shown by import of Su9-GFP into intact cells; n = 3 biological replicates per gRNA, P values calculated by two-sided unpaired t test relative to NTC, scale bar, 20 μm. Data are mean ± s.d. Similar results were obtained in two biological replicates (f-h,j,k). For gel source data, see Supplementary Fig. 1.
Extended Data Figure 6
Extended Data Figure 6. The adenine nucleotide transporter (ANT) mediates closure of TIM23 via TIM44.
a, Deletion of Ant1 or Ant2 does not affect expression of TIM and TOM proteins (right) or destabilize TIM and TOM complexes, as assessed by blue native PAGE (left). b-c, ANT1 and 2 bind to Timm23 and Timm44, as assessed by co-immunoprecipitation (b) and blue native PAGE (c). ANT and TIM23 complex is marked with an asterisk. d, WT ANT1 and the ADP/ATP binding double mutant (K43E/R244E) bind to TIM23 component Timm23, while disease-causing mutants (A90D, A123D) do not. e, Closure of TIM23 in response to CCCP treatment is impaired in the presence of disease-causing mutants (A90D, A123D), but is preserved in the presence of ADP/ATP binding double mutant (K43E/R244E), as shown by import of Su9-GFP to mitochondria; n = 3 biological replicates per group, P values calculated by two-sided unpaired t test relative to empty. Scale bar, 40 μm. f, ANT1 binds to both Timm23 and Timm44. g, Mitophagy is impaired in cells lacking Timm44; n = 3 biological replicates per gRNA, P values calculated by two-sided unpaired t test relative to NTC_1. h, PINK1 stabilization by CCCP treatment is abrogated in the absence of Timm44. i, Rescue of mitophagy with wild type (WT) ANT and ADP/ATP exchange mutants (K33Q, K43E/R244E), but not with known disease-causing mutants (A90D, A123D) and Timm44-binding site mutant (G146E/K147D). top left: schematic of ANT and sites of mutations. Bottom: Western blotting demonstrating equivalent expression of ANT constructs. Right: quantification of mitophagy; n = 3 biological replicates per group, P values calculated by one-way ANOVA, post-hoc Tukey test, **P < 0.01, ***P < 0.001. j, Mutation of the predicted ANT1 interaction site in Timm44 abrogates binding to ANT1. k, Rescue of mitophagy with WT Timm44, but not with binding site mutant (K282D); n = 3 biological replicates per group, P values calculated by one-way ANOVA, post-hoc Tukey test, **P < 0.01, ***P < 0.001. l, Mutation in Timm44 of the ANT1 interaction site does not abrogate Timm44 binding to Timm23. Data are mean ± s.d. Similar results were obtained in two biological replicates (a-d,f,h-j,l). For gel source data, see Supplementary Fig. 1.
Extended Data Figure 7
Extended Data Figure 7. The adenine nucleotide transporter (ANT) is required for mitophagy in vivo, independently of transcriptional regulation.
Equivalent amounts of Pink1 and higher Parkin transcription in ANT1_KO heart and skeletal muscle (SM); n = 4 per group, P values calculated by two-sided unpaired t test. Data are mean ± s.d.
Fig. 1.
Fig. 1.. Multi-dimensional mitophagy screen reveals that ANT is required for mitophagy
a, Outline of CRISPR/Cas9 genome-wide genetic screen, using 4 reporter assays and 2 modes of mitophagy induction. b, Most significant hits in each of the 7 screens. Representative previously known genes in open symbols, previously unknown in color; line, median; box, 75–25 percentiles; whiskers, 99–1 percentiles; duplicate experiments. c, Ranked aggregate Z-scores of all genes. Representative previously known in gray, previously unknown in black. d-e, Validation as mitophagy decelerators of the indicated genes, using both a gRNA chosen from the screening library, and an independent non-library gRNA, followed by flow cytometry for mt-mKeima (d, n = 3 biological replicates per gRNA, P values calculated by two-sided unpaired t test relative to NTC) or by Western blotting of mitochondrial proteins in the outer membrane (OMM-Tom20), inner membrane (IMM-ATPB), or matrix (PDH) (e). Similar results were obtained in two biological replicates. For gel source data, see Supplementary Fig. 1. f, Suppression of mitophagy in primary rat neurons. Left: visualization of neuronal mitochondria with TMRE dye. Right: representative image showing coating of mitochondria (labeled with Mito-Snap) with the mitophagy receptor OPTN, indicating active mitophagy. Far right: quantification of cells undergoing active mitophagy; n = 6 (untreated control), 6 (treated control), 4 (ANT1), and 5 biological replicates (ANT2), P values calculated by one-way ANOVA, post-hoc Dunnett’s multiple comparison test, *P < 0.05, **P < 0.01. Scale bar, 5 μm and 0.8 μm. Data are mean ± s.d.
Fig. 2.
Fig. 2.. ANT mediates suppression of TIM23 via TIM44.
a, Inhibition of ADP/ATP transport with the indicated inhibitors accelerates mitophagy, in sharp contrast to genetic deletion of ANT1 (bottom right); n = 3 per group. b, Mitochondrial Δψm is elevated in cells lacking ANT, and reduced in response to CCCP, compared to control cells, consistent with reverse ADP/ATP exchange in low Δψm; n = 3 per gRNA. P values calculated by two-way repeated measures ANOVA relative to NTC. c, Rescue of mitophagy with wild type (WT) ANT and ADP/ATP-binding mutant (K43E/R244E), but not with disease-causing mutants (A90D, A123D). top left: schematic of ANT mutations. Bottom: equivalent expression of constructs. Right: quantification of mitophagy; n = 3 per group. d, PINK1 stabilization by CCCP treatment is abrogated in the absence of ANT1 or 2. e, Suppression of TIM23-mediated import of of [35 S]Su9-DHFR into isolated mitochondria in response to CCCP is impaired in the absence of ANT1 (p=precursor; m=mature). f, Interaction between ANT1 and Timm44 identified in the mitochondrial interactome database XlinkDB. g, Timm44 deletion impairs ANT1 binding with Timm23. h, Mutation of the predicted Timm44 interaction site in ANT1, or disease-causing ANT1 mutation (A90D), abrogate bind to Timm44, while ADP/ATP exchange mutants (K43E/R244E and K33Q) do not. i Model of ANT-mediated suppression of TIM23 in response to mitochondrial bioenergetic compromise. Data are mean ± s.d. P values by one-way ANOVA, post-hoc Tukey test (a,c), *P < 0.05, **P < 0.01, ***P < 0.001. Similar results were obtained in two biological replicates. For gel source data, see Supplementary Fig. 1 (c-e,g,h).
Fig. 3.
Fig. 3.. ANT is required for mitophagy in vivo.
a, Blunted mitophagy in heart and brain of Ant1KO animals, illustrated by reduced coating of mitochondria by p62, PINK1, and Parkin. b, Blunted mitophagy in skeletal muscle of Ant1KO animals, shown by intramuscular transfection of mitoQC-plasmid; Line, mean; n = 4 mice, 4 fields (WT) and 4 mice, 50 fields (ANT1 knockout). Scale bar, 10 μm. c, Rescue of mitophagy with wild type (WT) ANT1 and mutant lacking ADP/ATP exchange activity (K33Q), but not with disease-causing mutant (A90D); Line, mean; n = 3 mice, 24 fields (WT), 3 mice, 16 fields (Luc), 3 mice, 23 fields (K33Q) and 3 mice, 21 fields (A90D). Scale bar, 10 μm. d, Accumulation of mitochondrial DNA (right) in heart (top) and muscle (bottom) of Ant1KO animals despite absence of nuclear-encoded biogenesis (left); n = 4 per group. e-g, Accumulation of mitochondrial proteins (e) and of disorganized and aberrant mitochondria (f) in heart, and deep red coloring of mitochondria in skeletal muscle (g) of Ant1 KO animals. Scale bar, 2 μm. Similar results were obtained from three mice in each group. h, Dilated cardiomyopathy in Ant1KO animals: heart weights (top left), and sample images (top right) and quantification (bottom) of echocardiography; n = 7 per group. LVID: left ventricle internal diameter systolic (s) and diastolic (d); LVPW: left ventricle posterior wall; EF: ejection fraction. i, Echocardiography of patient bearing homozygous loss-of-function ANT1 mutations. Left: systole. Right: diastole. j, Electron micrographs of endomyocardial biopsy from same patient as in (i). Localized distension of the outer membrane (blue arrows) with apparent release of mitochondrial matrix content (green) into the cytoplasm. Scale bar, 1 μm. Data are mean ± s.d. (a,e). P values by two-sided unpaired t test (a,d,h), by one-way ANOVA, post-hoc Tukey test (b), *P < 0.05, **P < 0.01, ***P < 0.001. For gel source data, see Supplementary Fig. 1.

References

    1. Youle RJ & Narendra DP Mechanisms of mitophagy. Nat Rev Mol Cell Biol 12, 9–14 (2011). - PMC - PubMed
    1. Ting SY, Yan NL, Schilke BA & Craig EA Dual interaction of scaffold protein Tim44 of mitochondrial import motor with channel-forming translocase subunit Tim23. Elife 6(2017). - PMC - PubMed
    1. Matsuda N, et al. PINK1 stabilized by mitochondrial depolarization recruits Parkin to damaged mitochondria and activates latent Parkin for mitophagy. J Cell Biol 189, 211–221 (2010). - PMC - PubMed
    1. Saito T & Sadoshima J Molecular mechanisms of mitochondrial autophagy/mitophagy in the heart. Circ Res 116, 1477–1490 (2015). - PMC - PubMed
    1. Shalem O, et al. Genome-scale CRISPR-Cas9 knockout screening in human cells. Science 343, 84–87 (2014). - PMC - PubMed

Publication types

MeSH terms

Substances