. 2019 Nov;575(7782):390-394.
doi: 10.1038/s41586-019-1669-2. Epub 2019 Oct 16.

HP1 reshapes nucleosome core to promote phase separation of heterochromatin

Affiliations

HP1 reshapes nucleosome core to promote phase separation of heterochromatin

S Sanulli et al. Nature. 2019 Nov.

Abstract

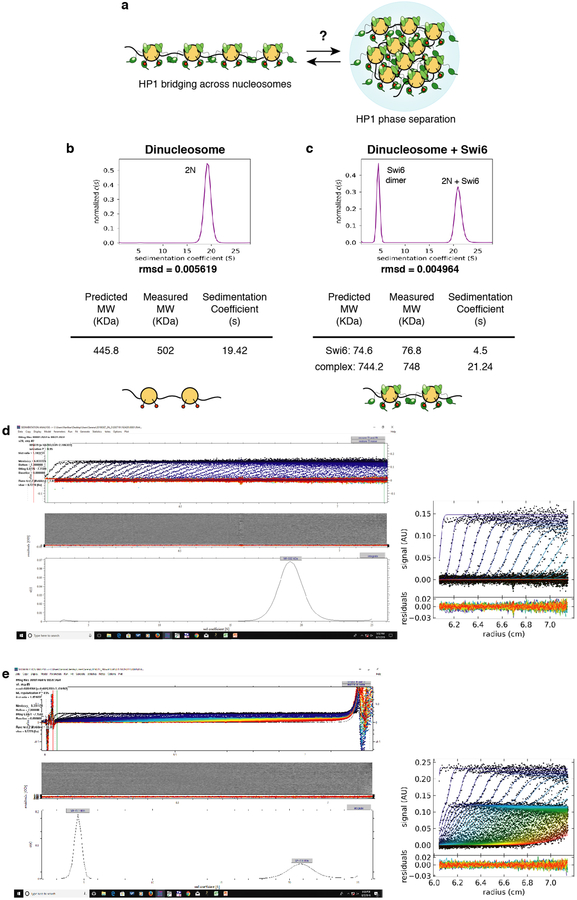
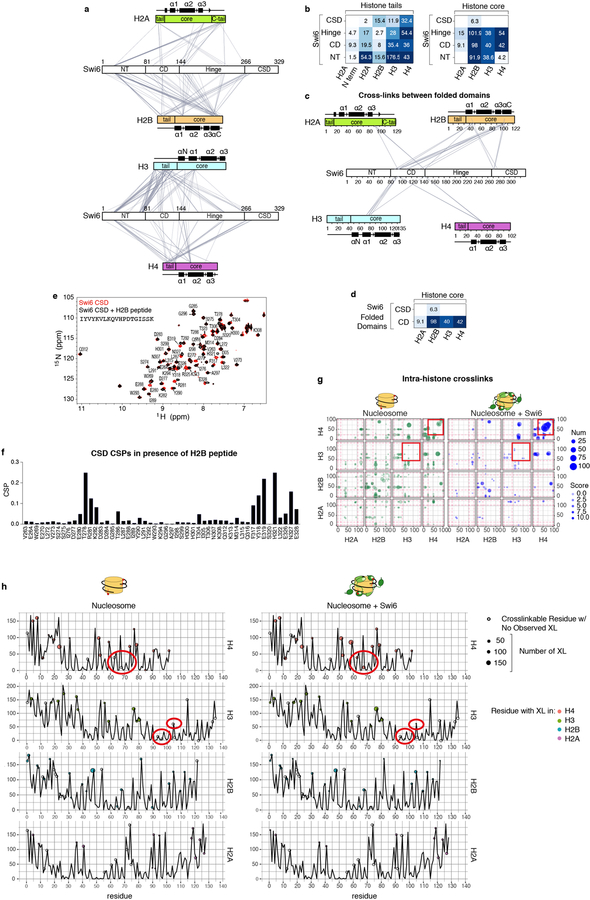
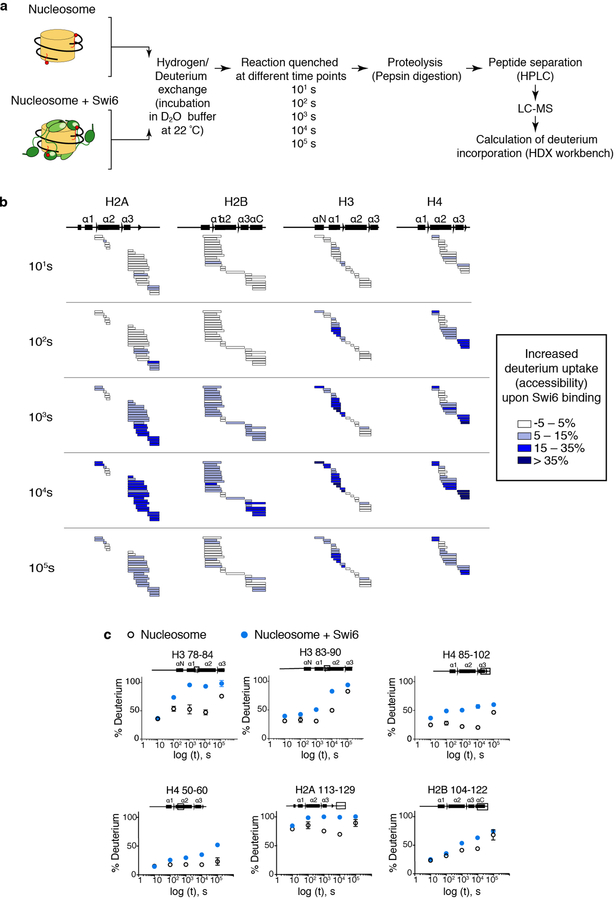
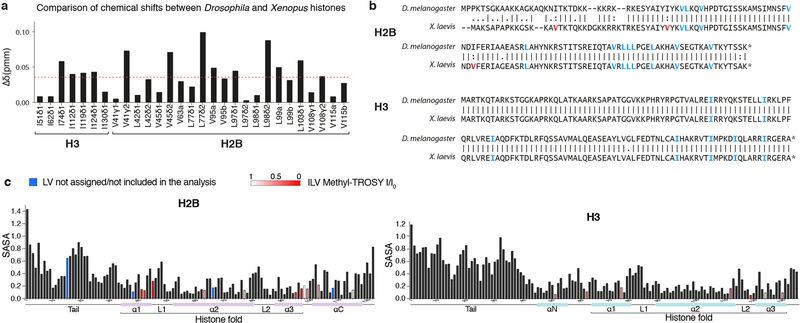
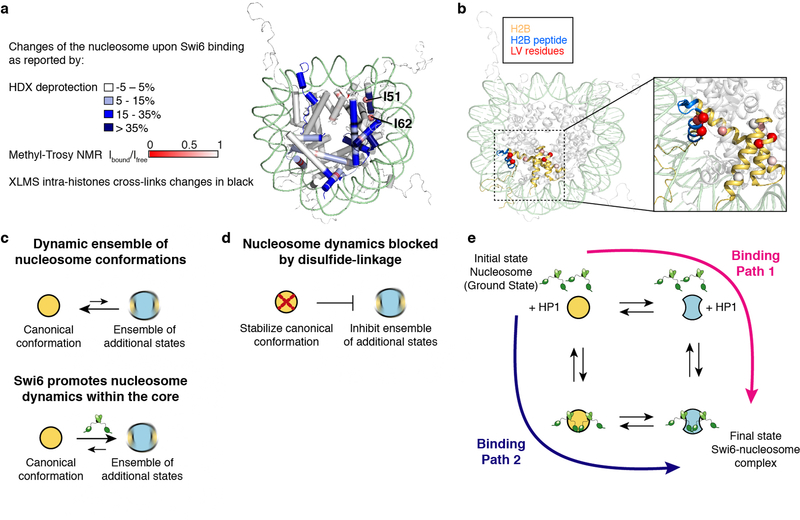
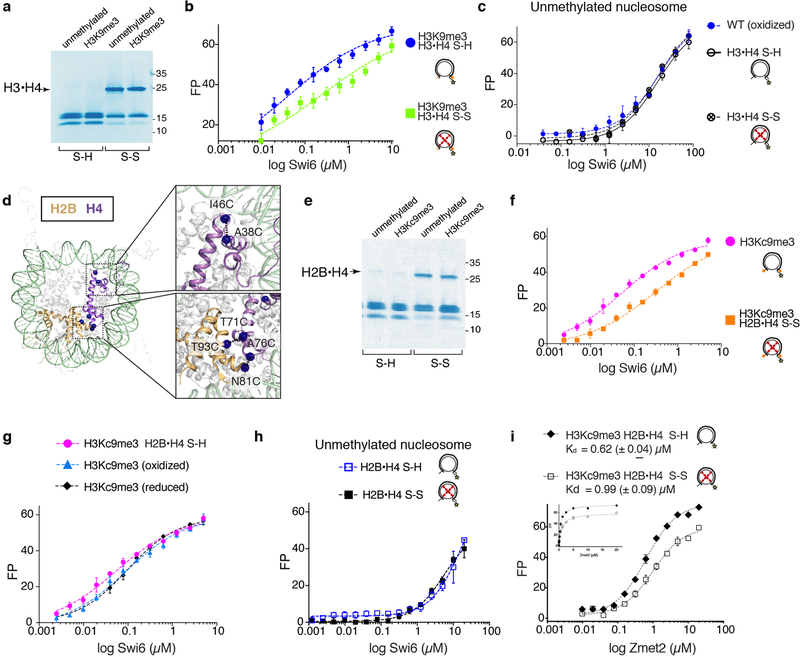
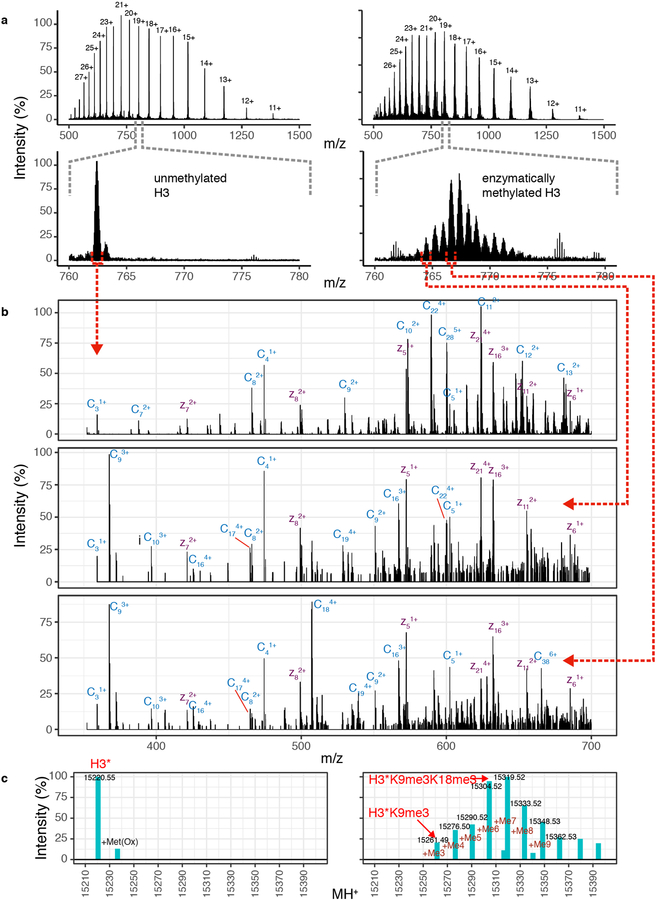
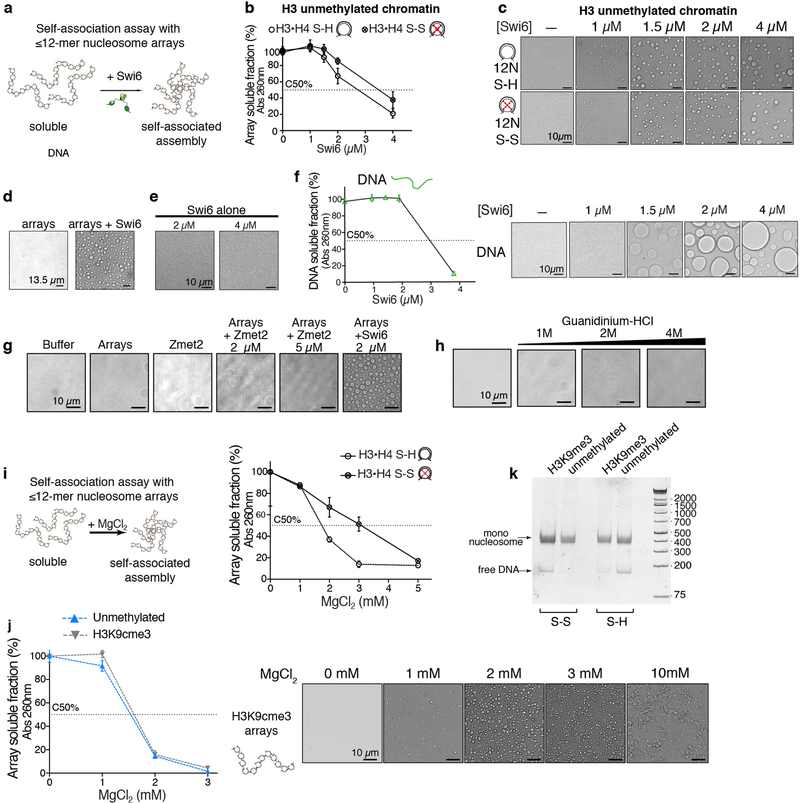
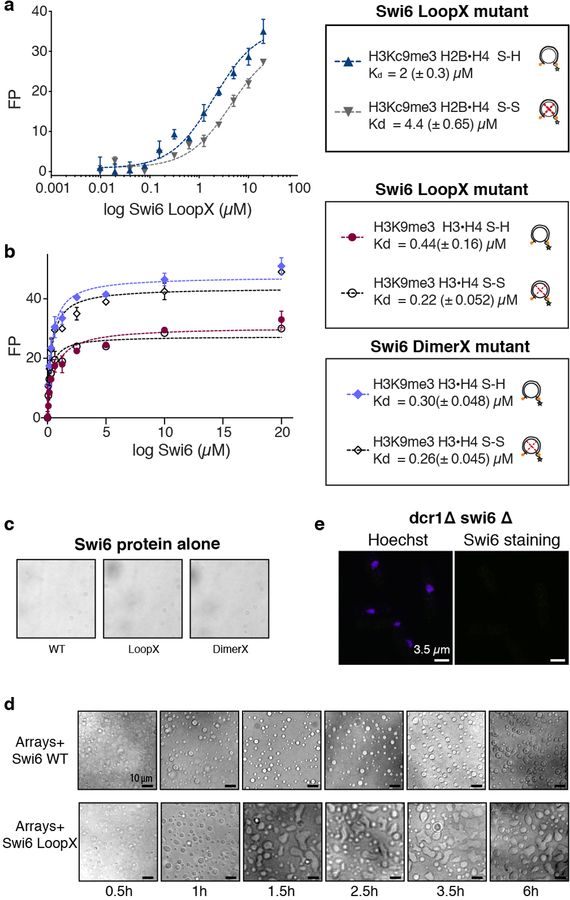
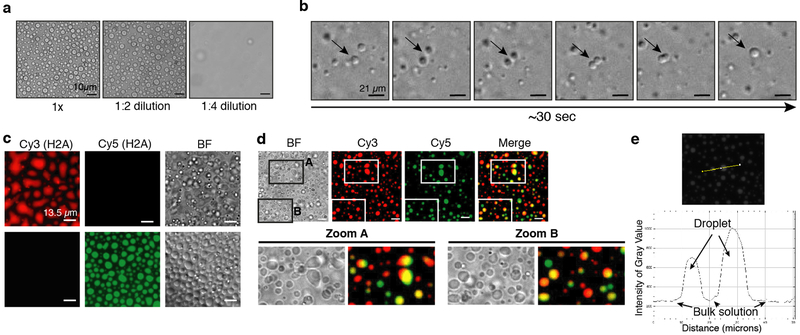
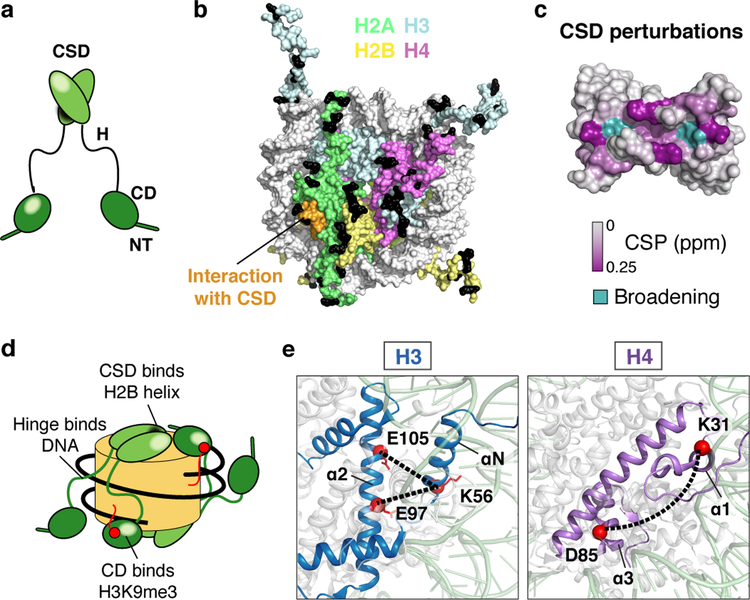
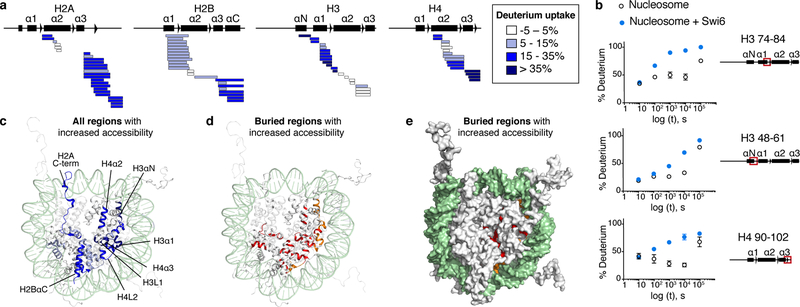
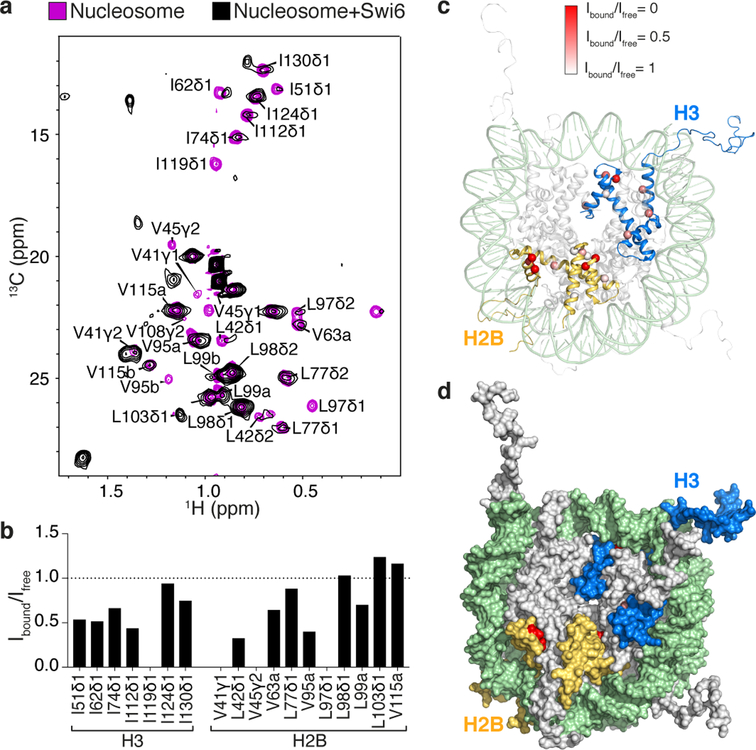
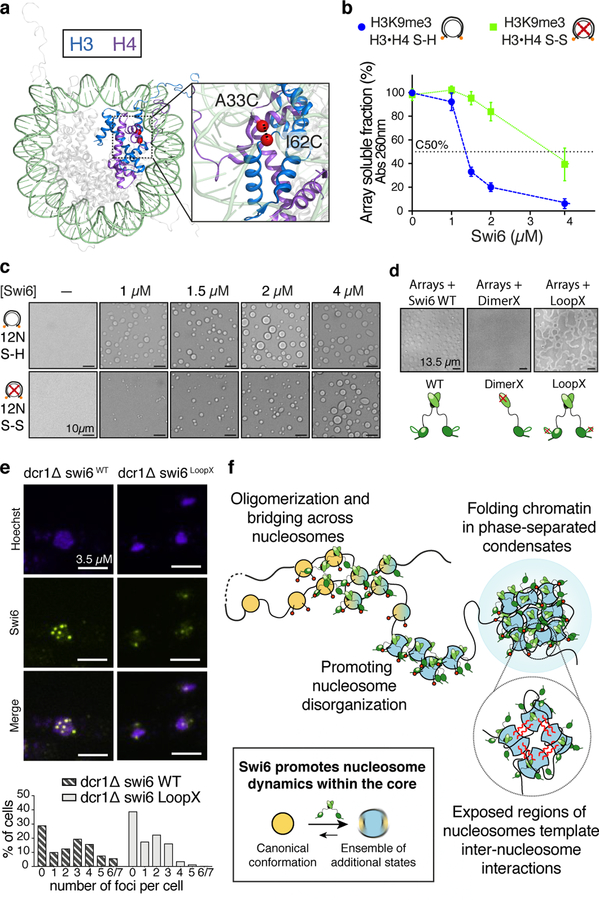
Heterochromatin affects genome function at many levels. It enables heritable gene repression, maintains chromosome integrity and provides mechanical rigidity to the nucleus1,2. These diverse functions are proposed to arise in part from compaction of the underlying chromatin2. A major type of heterochromatin contains at its core the complex formed between HP1 proteins and chromatin that is methylated on histone H3, lysine 9 (H3K9me). HP1 is proposed to use oligomerization to compact chromatin into phase-separated condensates3-6. Yet, how HP1-mediated phase separation relates to chromatin compaction remains unclear. Here we show that chromatin compaction by the Schizosaccharomyces pombe HP1 protein Swi6 results in phase-separated liquid condensates. Unexpectedly, we find that Swi6 substantially increases the accessibility and dynamics of buried histone residues within a nucleosome. Restraining these dynamics impairs compaction of chromatin into liquid droplets by Swi6. Our results indicate that Swi6 couples its oligomerization to the phase separation of chromatin by a counterintuitive mechanism, namely the dynamic exposure of buried nucleosomal regions. We propose that such reshaping of the octamer core by Swi6 increases opportunities for multivalent interactions between nucleosomes, thereby promoting phase separation. This mechanism may more generally drive chromatin organization beyond heterochromatin.


Conflict of interest statement

Competing interests

The authors declare no competing financial interests.

Figures

Extended Data Figure 1:
Swi6 interaction with chromatin. (a) Model for HP1-mediated heterochromatin assembly: the bridging model relies on HP1’s ability to oligomerize across nucleosomes; the phase separation model relies on HP1’s ability to form phase separated assemblies that can sequester chromatin. The molecular link between these two models is unclear. (b) Sedimentation Velocity-Analytical Ultracentrifugation (SV-AUC) on H3Kc9me3 dinucleosomes. The continuous c(s) distribution is shown as a two-dimensional distribution. X- axis, sedimentation coefficient s; y-axis, normalized c(s). c(s) is the sedimentation coefficient distribution. Table shows measured masses using a continuous function c(s) distribution versus theoretically predicted masses. (c) SV-AUC on H3Kc9me3 dinucleosomes with Swi6. Data representation and table are as in (b). Analysis is performed using a continuous function c(s) with a bimodal f/f0 distribution. The peak at s = 21.24 corresponds to the Swi6-dinucleosome complex. The peak at s = 4.5 corresponds to free Swi6 dimers, as previously shown in Canzio et al. 2013. Analysis of raw SV-AUC data for (d) dinucleosome alone and, (e) dinucleosome+Swi6 complex showing that: (i) the fit lines describe the boundary data well; (ii) the rmsd is below 0.01; (iii) the residual bitmap has very few diagonal features indicating the good quality of the fit. For (b-d), measurements are representative of two independent experiments.
Extended Data Figure 2:
Swi6-nucleosome cross-linking analysis. (a) EDC cross-linking network between histones and Swi6. Histones tails and core regions are indicated, as well as the different Swi6 domains. (b) Interactions between Swi6 domains, histone tails, and core domains mapped by cross-link spectral counts. The number of cross-linked MS spectra matching to a given domain pair is indicated by the color of the tile as well as the numbers given. (c-d) Analysis as in (a-b) performed only on the structured domains of Swi6 (CSD and CD) and on the folded core of histones. (e) The Swi6 CSD binds to H2B core. Superposition of 1H-15N HSQC spectra of Swi6 CSD with (black) and without (red) H2B peptide. Measurements are representative of three independent experiments. The sequence of the H2B peptide is shown. (f) Chemical shifts perturbation (CSP) for assigned resonances between Swi6 CSD alone and with the addition of the H2B peptide shown in panel (e). (g) Intra-nucleosome cross-links are altered by Swi6 binding. Each axis maps residue position within a histone, while the red dashed lines indicate the boundaries between histone tail and core domains. A cross-link is represented by a filled circle between two residues, with area proportional to the number of MS2 spectra identifying a given cross-link. Cross-links found in the free nucleosome state are in green, while cross-links found in the Swi6 bound nucleosome are in blue. The red squares highlight changes in the H3-H3 and H4-H4 cross-linking patterns between the free and bound nucleosome states. (h) New histone-histone cross-links detected only with Swi6 binding involve buried regions of the nucleosome. The plots report the solvent-accessible surface area SASA (y-axis) vs. residues number (x-axis) for each histone. Cross-linkable residues (E, D, K) are indicated by a circle. Empty circles represent residues that do not show any cross-linking and filled circles represent cross-linked residues. The area of the circle reports the number of cross-linked spectra with one peptide mapped to a particular residue. The red ovals highlight buried residues that were observed to cross-link only in the presence of Swi6. Analysis in a-d, g, and h is performed on one of two XLMS data sets. Similar results were obtained with the other data set that used the BS3-crosslinker.
Extended Data Figure 3:
HDX-MS with nucleosome-Swi6 complex and nucleosomes alone. (a) Experimental scheme for HDX-MS. (b) Changes in deuterium incorporation are reported for every histone at five different time points. Each horizontal bar represents an individual peptide, and peptides are placed beneath the schematic of secondary structure elements of the histones. Peptides are colored according to the legend, showing the mean of deprotection derived from multiple peptides obtained from one of two independent experiments with similar results. Specifically, more than a 35% increase in deuterium incorporation compared to nucleosomes alone is observed in: (i) residues 74–90 of H3, corresponding to a portion of helix α1 and α2, and the connecting loop 1; (ii) residues 48–61 of H3, corresponding to helix αN of H3; (iii) and residues 85–102 of H4, corresponding to helix α3. Other regions with a significant increase in deuterium uptake are the C-terminal region and helix α2 of H2A (residues 113–129 and 40–51), the C-terminal of H2B (helix αC, residues 104–122), and H4 helix α2 and loop 2 (residues 50–60 and 72–84). These increases in the rates of deuterium incorporation caused by Swi6 binding indicate extensive changes in the backbone hydrogen bonding of histones within the nucleosome and partial unfolding of the helices in the histones. (c) Kinetics of deuterium uptake of example histone peptides (residue numbers indicated) over the time course. Data are mean and SD of multiple peptides obtained from one of two independent experiments with similar results. Error bars not shown for points when shorter than the height of the symbol.
Extended Data Figure 4:
Nucleosome methyl-TROSY NMR. (a) The methyl-TROSY spectra of H3 and H2B are well resolved and the chemical shift differences between the cross-peaks of our spectra and of the published spectra of Drosophila nucleosomes are small (<0.1ppm). Due to these small changes and the high protein conservation between the two species, we were able to transfer the assignments to all the cross-peaks of H3 and most of the cross-peaks of H2B. The Δδ plot reports the differences in chemical shift of the cross-peaks for conserved Ile, Leu and Val (ILV) residues in Drosophila and Xenopus histones. Δδ values were calculated from the equation: 0.5δHDrosophilaδHXenopus2+0.2δCDrosophilaδNCXenopus2 Where the factor of 0.2 is used as a scaling factor for the carbon spectral width. The average value of Δδ is shown as a red dashed line. Experiments were performed two times to optimize conditions; data from one experiment are reported. (b) Amino acid sequence alignment of Drosophila and Xenopus H2B and H3 histones. ILV residues conserved between the two species are colored in blue, and in red are ILV residues not conserved. I residues are fully conserved between H3 histones. LV are conserved between H2B histones, except for V15, V38 and V66, which are present only in the Xenopus histone. V15, V38 and V66 are not included in our NMR analysis. (c) Quantification of the solvent-accessible surface area (SASA) of the residues indicated in x-axis in histone H2B (left) and H3 (right). SASA was calculated from the PDB structure file 1KX5 using the program POPS. The SASA values are for the entire residue and represent fraction of exposed surface area. Bars corresponding to ILV residues are colored in red with shading according to the legend, reflecting changes reported from the methyl-TROSY experiments due to Swi6 binding. ILV residues not assigned or not included in the analysis are colored in blue. The schematic of secondary structure elements is shown below the x-axis.
Extended Data Figure 5:
Swi6 disorganizes the nucleosome core. (a) Mapping of the Swi6-induced changes in the nucleosome structure (PDB 1KX5), as detected by XLMS (Fig.1), HDX-MS (Fig. 2), methyl-TROSY NMR (Fig. 3). Residues H3 I51 and I62 are shown as spheres. The figure highlights how the three different techniques consistently reported alterations in the same regions of the octamer. (b) In the nucleosome crystal structure, H2B is colored in light orange, H2B peptide used in the CSD 1H-15N HSQC NMR experiment is in cyan and Leu/Val residues analyzed in the nucleosome methyl-TROSY NMR are represented as spheres and colored according to the extent of broadening determined by Ibound /Ifree. The zoomed panel shows the location of the H2B peptide tested for binding to the CSD. (c) Model depicting the effect of Swi6 on nucleosome conformations. Nucleosomes in solution can sample an ensemble of conformational states, of which the canonical conformation observed in the crystal structure is the most populated and lowest energy state. Swi6 increases nucleosome dynamics and promotes nucleosomes alternative states. In absence of Swi6 the equilibrium is pushed toward the nucleosome in the canonical state (top). Swi6 increases nucleosome dynamics and promotes formation of a larger ensemble of nucleosomal conformations (bottom). (d) Model of how disulfide cross-links in the nucleosome core prevent nucleosome core dynamics. (e) This thermodynamic cycle integrates the different states of the nucleosome and nucleosome-Swi6 complexes implied by our work. In this thermodynamic cycle, the overall process involves a thermodynamic coupling between Swi6 binding and increased nucleosome dynamics. Path 1 shows how the intrinsic equilibrium between static and dynamic nucleosome states can be driven towards a dynamic nucleosomal state by Swi6 binding, while path 2 shows how binding by Swi6 to a static nucleosome can drive the equilibrium of the Swi6-nucleosome complex towards a more dynamic nucleosome state. Both paths lead to the same final state where the conformation of the Swi6 bound-nucleosome is different from the one observed in the crystal structure (PDB 1KX5). Importantly, both paths are thermodynamically equivalent.
Extended Data Figure 6:
Nucleosome octamer dynamics are important for Swi6 nucleosome binding. (a) Representative non-reducing SDS-PAGE showing nucleosome with H3–H4 histone disulfide linked (H3•H4 S-S) or reduced (H3•H4 S-H). ~90% of H3 and H4 are disulfide-linked in both the methylated and unmethylated nucleosomes. These are the cross-linking sites used in Fig. 4. For gel source data, see Supplementary Figure 1. (b) Nucleosome binding assays by fluorescence anisotropy showing reduced binding of Swi6 to H3K9me3 nucleosomes containing H3–H4 disulfide-linked octamer (H3•H4 S-S vs. H3•H4 S-H). (c) Fluorescence anisotropy measuring Swi6 binding to unmethylated nucleosome, H3•H4 S-H and S-S, showing that disulfide linkages have no effect on Swi6 binding to unmethylated nucleosome. (d) Additional residues in the H2B and H4 mutated to Cys for generating dynamically restrained octamers are represented with spheres. (e) Representative non-reducing SDS-PAGE showing nucleosome with H2B-H4 histone disulfide linked (H2B•H4 S-S) or reduced (H2B•H4 S-H). ~50% of H2B and H4 are disulfide-linked in both H3Kc9me3 and unmethylated nucleosomes. For gel source data, see Supplementary Figure 1. (f) Nucleosome binding assays by fluorescence anisotropy showing reduced binding of Swi6 to H2B-H4 disulfide-linked octamer (H2B•H4 S-S). (g) Fluorescence anisotropy experiments showing comparable Swi6 binding to H3cK9me3 non-oxidized, H3cK9me3 oxidized and H2B•H4 S-H mononucleosomes. These results show that the oxidation process does not alter Swi6 binding to Cys-devoid nucleosomes and that the presence of reduced Cys does not affect Swi6 binding either. (h) Fluorescence anisotropy measuring Swi6 binding to unmethylated nucleosome, H2B•H4 S-H and S-S, showing that disulfide linkages have no effect on Swi6 binding to unmethylated nucleosomes. (i) Nucleosome binding assays by fluorescence anisotropy showing that Zmet2 binding to H2B-H4 disulfide-linked octamer (H2B•H4 S-S) is not significantly affected. (b, c, f, g h, i) FP, fluorescence polarization units. Measurements entailed at least three independent experiments and error bars reflect standard deviation from the mean (SD).
Extended Data Figure 7:
Characterization of H3 Enzymatic Methylation by Dim5. Methylation of Histone H3 was followed by online LC-MS-ETD-MS of the intact proteins. (a) Charge state envelope of untreated (left panel) and methylated (right panel) H3. The lower panel, focused on a single charge state, shows disappearance of the starting material and the formation of higher mass species, spaced 14 Da apart. (b) ETD-MS of precursor ions corresponding to unmethylated H3 (top), H3-K9me3 (middle) and H3-K9me3-K18me3 (bottom). The rationale for these assignments is based on the precursor mass values and by the product ions. Z-ions (purple) do not change between the three spectra, while the pattern of c-ions (blue) are mass shifted by 42 Da and charge-state shifted by 1+ at C9 between the top and middle/bottom panels, and again at C18 between the middle and lower panels. These assignments are further validated by bottom-up proteomics analysis of Lys-C digested samples (not shown). (c) The precursor ion spectra in (a) were deconvoluted using Xtract, which models both the charge states and the isotope distributions. Deconvoluted MH+ values are consistent with multiple methylation states (due to the difficulty of modeling isotope distributions from large proteins, particularly as there is some underlying oxidation, Xtract sometimes picks the wrong monoisotope). Deconvoluted intensities show that the enzymatically treated sample (right) contains no significant unmethylated H3 or mono- and di-methylated H3K9. While, 100% of analyzed sample is tri-methylated at H3K9, additional methylations occur at H3K18 as noted above. The sample analyzed here was used to carry out all the experiments to minimize variability.
Extended Data Figure 8:
Nucleosome disorganization and chromatin phase separation are specifically driven by Swi6. (a) Schematic of chromatin self-association assay. (b-c) Restraining octamer dynamics do not affect the condensation of unmethylated chromatin in liquid droplets. Self-association assays in (b) are performed with unmethylated nucleosome arrays containing H3•H4 S-S (oxidized) and H3•H4 S-H (reduced) octamers as a function of increasing concentration of Swi6. The dotted line represents the C50, which is the concentration of Swi6 at which 50% of arrays sediments. In (c), bright-field representative images of the array-Swi6 complex analyzed in the top panel show that the formation of phase-separated droplets is not affected by the disulfide linkages in absence of H3K9me3. (d) Swi6 induces chromatin condensation in liquid droplets at physiological conditions, 150 mM KCl, 30°C, 2 μM Swi6. (e) Swi6 alone does not form phase-separated liquid droplets. Bright-field representative images of the Swi6 alone. (f) Left: self-association assay performed with naked DNA (601×12 ~2 kbp) in presence of increasing concentration of Swi6. Right: bright-field representative images of the DNA-Swi6 complex analyzed in the left panel, showing the formation of phase-separated droplets. (g) Zmet2 does not form phase-separated assemblies alone and it does not promote chromatin condensation in liquid droplets. Experiments are done at 40 nM nucleosome arrays, with 2 and 5 μM of Zmet2. Bright-field images of buffer only and Swi6-chromatin droplets are shown as controls. (h) Titration of the denaturant guanidinium-HCl into nucleosome arrays does not promote formation of phase-separated droplets, indicating that Swi6 specifically disorganizes the nucleosome core. (i) Disulfide cross-links between H3 and H4 impair Mg2+-driven self-association of nucleosome arrays, indicating the role of nucleosome core dynamic for inter-nucleosome interactions. (j) Left: Mg2+-driven self-association of unmethylated and H3K9cme3 arrays are comparable. Right: Representative bright-field images of the H3K9cme3 array sedimentation analyzed in the left panel, showing the formation of rounded phase-separated condensates at 2 and 3 mM Mg2+. The assay is performed in TE 0.1 (see Methods) and 75 mM KCl. (k) Nucleosome arrays quality controls, showing comparable octamer saturation and absence of over- and under- assemblies. Arrays are digested with HpaI, run on a native acrylamide gel and DNA is stained. For source gel data, see Supplementary Figure 1. All arrays used in this study conformed to the quality standard shown in (k). (b-i, j) Measurements and images entailed three independent experiments; error bars reflect standard deviation from the mean (SD).
Extended Data Figure 9:
Extended Data Figure 9:. Swi6-chromatin assemblies present liquid-like properties.
(a) Chromatin-Swi6 condensates are reversible upon dilution. (b) Chromatin-Swi6 droplets fuse within seconds after incubation. The time course depicted is 30 seconds. (c) Chromatin is included in Swi6-induced condensates. Nucleosome arrays are assembled with H2A-Cy3 or H2A-Cy5 and H3Kc9me3 octamers. Images showing Cy-3 or Cy5- labeled chromatin mixed with Swi6 separately, before being incubated together. (d) Images show condensates 30 minutes after mixing Cy3 and Cy5 pre-formed droplets. By ~1 hour most of the droplets contains homogeneous labeling with both dyes. Doubly labeled droplets indicate chromatin exchanges between the pre-formed condensates. (e) Quantification of fluorescence intensity done in ImageJ using the Plot Profile function that creates a plot of intensity values across the yellow line shown in the left panel. Higher octamer concentration within the droplets as compare to the bulk of the solution is detected. Images are representative images from at least three independent experiments.
Extended Data Figure 10:
Swi6 DimerX and LoopX are defective in promoting octamer distortion and forming heterochromatin foci in S. pombe. (a) Nucleosome binding assays by fluorescence anisotropy showing that binding of Swi6 LoopX to H3K9cme3 nucleosomes is not affected by H2B-H4 histone disulfide linkage. H2B•H4 S-S are oxidized nucleosome, H2B•H4 S-H are reduced nucleosomes. Kd are shown. (b) Nucleosome binding assays by fluorescence anisotropy showing that binding of Swi6 LoopX and DimerX mutants to H3K9me3 nucleosomes is not affected by H3–H4 histone disulfide linkage. H3•H4 S-S are oxidized nucleosome, H3•H4 S-H are reduced nucleosomes. Kd are shown in the black boxes. (c) Swi6 WT, LoopX and DimerX proteins do not form liquid droplets in absence of chromatin. 4 µM concentration. (d) Bright-field images showing droplet wetting over time. Swi6-chromatin condensates are incubated at room temperature and images are collected at the indicated times (h = hours). Condensates are imaged on a bottom glass plate coated with Peg-silane (see Methods). (e) Swi6 immunofluorescence on dcr1Δ swi6Δ S. pombe cells shows absence of Swi6 staining, confirming the specificity of the anti-Swi6 antibody. Images in (c-e) are representative images from at least three independent experiments. In (a) and (b), measurements entailed three independent experiments, error bars reflect standard deviation from the mean (SD).
Fig. 1:
Fig. 1:. Swi6 contacts histone octamer core and alters intra-histone cross-links.
(a) Swi6 domain architecture. Chromodomain (CD), chromoshadowdomain (CSD), N-terminal region (NT) and hinge (H) are shown. (b) Histone residues that cross-link to Swi6 are mapped in black on the nucleosome structure. Different histones are colored as indicated. H2B region interacting with the CSD is in orange. (c) Swi6 CSD crystal structure is colored by chemical shift perturbation (CSP, purple) and broadening beyond detection (teal) upon the addition of H2B peptide (PDB 1E0B). (d) Model for engagement of Swi6 with nucleosome. (e) Swi6 binding remodels histone-histone contacts. Examples of residues found cross-linked only upon Swi6 binding are represented as red spheres. Histones H3 and H4 are colored in blue and purple, respectively.
Fig. 2:
Fig. 2:. Swi6 binding increases solvent accessibility of buried histone residues.
(a) Differential HDX-MS of individual histones within Swi6-bound versus free nucleosomes from a single time point (104 sec; all time points in Extended Data Fig. 3). Each horizontal bar represents an individual peptide. Peptides are placed beneath schematic of secondary structure elements. Color map represents percent increase in deuterium uptake observed upon Swi6 binding. The percent increase values are derived from multiple peptides obtained from one of two independent experiments with similar results. (b) Kinetics of deuterium uptake of example histone peptides (residue numbers indicated) over time. Data are mean and SD of multiple peptides obtained from one of two independent experiments with similar results. Error bars not shown for points when shorter than the height of the symbol. (c) Histones in nucleosome structure (PDB 1KX5) colored according to the percent of deprotection in (a). For clarity, only one copy of histones is colored. DNA is in light green. (d) Buried regions showing increase in deuterium uptake upon Swi6 binding are highlighted in ribbon diagram. Residues proximal to DNA and histones are in orange and red, respectively. (e) Residues in (d) shown in space-fill representation.
Fig. 3:
Fig. 3:. Swi6 binding increases protein dynamics within octamer core.
(a) Methyl-TROSY spectra of Ile-methyl–labeled H3 and Leu/Val-methyl–labeled H2B in nucleosome alone (purple), and bound to Swi6 (black). Three resonances in H2B are not assigned as they correspond to residues V15, V38 and V66 present only in Xenopus H2B. Some resonances are largely unaffected (I124, L98, L99, V115, and two not assigned), while others are broadened and a few new resonances appear in presence of Swi6. (b) Peak volumes of H3 and H2B residues in the nucleosome-Swi6 complex (Ibound) relative to those in the nucleosome alone (Ifree). Spectra were normalized using volumes of their respective L98 and two non-assigned peaks, which do not show broadening upon Swi6 binding. Only unambiguously assigned peaks are included in quantification. Cross-peaks that disappear are taken to have an Ibound value of zero. (c) Cα of Ile residues in H3 and Leu/Val residues in H2B shown as red spheres in the nucleosome structure (PDB 1KX5). Color intensity represents extent of broadening determined by Ibound /Ifree. (d) Surface representation of nucleosome in (c). Experiments were performed two times to optimize conditions; data from one experiment are reported.
Fig. 4:
Fig. 4:. Octamer dynamics promote Swi6-mediated chromatin compaction and phase separation.
(a) Cysteines (red) introduced in H3 and H4 used for disulfide cross-links. (b) Array self-association assays using nucleosome arrays containing H3K9me3•H4 S-S (oxidized, green) and H3K9me3•H4 S-H (reduced, blue) octamers as a function of increasing Swi6. Dotted line represents C50, the Swi6 concentration at which 50% of arrays sediments. Measurements entailed at least three independent experiments and error bars reflect standard deviation from the mean (SD). (c) Bright-field representative images of the array-Swi6 mixtures analyzed in (b), showing phase-separated droplets. (d) DimerX mutation abrogates Swi6-array droplet formation. LoopX-array droplets show higher wetting properties as seen by flatter morphology. Cartoons of respective Swi6 proteins are shown. Red cross indicates mutation location. (c-d) Images are representative of at least three independent experiments. (e) Compared to WT cells, LoopX cells show reduced number of foci per cell and more diffuse nuclear staining. Top panel: Representative images of Swi6 WT or Swi6 LoopX mutant cells. Lower panel: Quantification of Swi6 foci in WT and LoopX cells. Experiments was repeated independently at least three times and >250 cells per condition were analyzed. (f) Model for Swi6-heterochromatin. Oligomerization of Swi6 (green) on H3K9me3 marked (red spheres) nucleosomes loosens histone-DNA and histone-histone contacts, increasing dynamics within the octamer core. Nucleosomes can then access larger ensemble of dynamically interconverting conformational states, increasing opportunities for transient weak multivalent interactions with other nucleosomes, including histone tails. Such interactions and nucleosome bridging by Swi6 enable chromatin compaction into liquid droplets. Black box: Nucleosomes in solution sample an ensemble of conformational states, of which the canonical conformation (orange) observed in the crystal structure is the most populated. Swi6 increases intrinsic histone core dynamics and accessibility. As a result, this increases the proportion of alternative conformational states of the nucleosome (blue).

References

    1. Stephens AD et al. Chromatin histone modifications and rigidity affect nuclear morphology independent of lamins. Mol. Biol. Cell 29, 220–233 (2018). - PMC - PubMed
    1. Allshire RC & Madhani HD Ten principles of heterochromatin formation and function. Nat. Rev. Mol. Cell Biol 19, 229–244 (2018). - PMC - PubMed
    1. Canzio D et al. Chromodomain-mediated oligomerization of HP1 suggests a nucleosome-bridging mechanism for heterochromatin assembly. Mol. Cell 41, 67–81 (2011). - PMC - PubMed
    1. Canzio D et al. A conformational switch in HP1 releases auto-inhibition to drive heterochromatin assembly. Nature 496, 377–381 (2013). - PMC - PubMed
    1. Larson AG et al. Liquid droplet formation by HP1α suggests a role for phase separation in heterochromatin. Nature 547, 236–240 (2017). - PMC - PubMed

Publication types

MeSH terms