Review
. 2019 Oct 15;8(10):1690.
doi: 10.3390/jcm8101690.

Vaso-Occlusion in Sickle Cell Disease: Is Autonomic Dysregulation of the Microvasculature the Trigger?

Affiliations
Review

Vaso-Occlusion in Sickle Cell Disease: Is Autonomic Dysregulation of the Microvasculature the Trigger?

Saranya Veluswamy et al. J Clin Med. .

Abstract

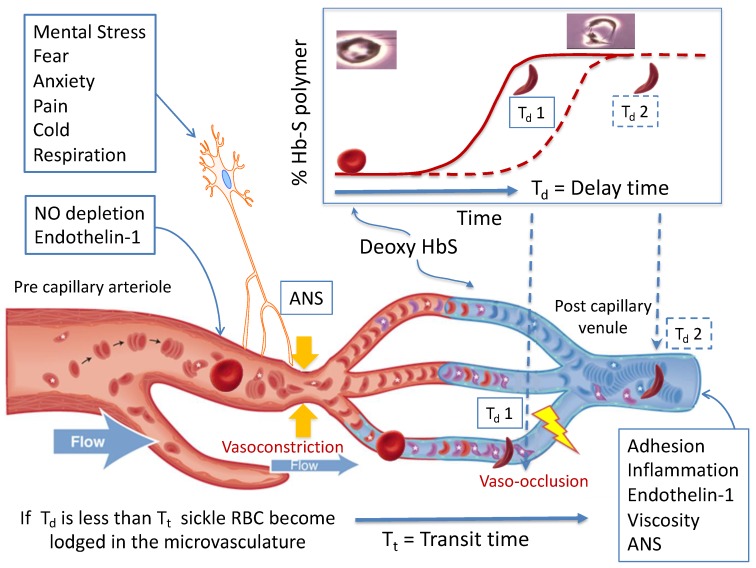
Sickle cell disease (SCD) is an inherited hemoglobinopathy characterized by polymerization of hemoglobin S upon deoxygenation that results in the formation of rigid sickled-shaped red blood cells that can occlude the microvasculature, which leads to sudden onsets of pain. The severity of vaso-occlusive crises (VOC) is quite variable among patients, which is not fully explained by their genetic and biological profiles. The mechanism that initiates the transition from steady state to VOC remains unknown, as is the role of clinically reported triggers such as stress, cold and pain. The rate of hemoglobin S polymerization after deoxygenation is an important determinant of vaso-occlusion. Similarly, the microvascular blood flow rate plays a critical role as fast-moving red blood cells are better able to escape the microvasculature before polymerization of deoxy-hemoglobin S causes the red cells to become rigid and lodge in small vessels. The role of the autonomic nervous system (ANS) activity in VOC initiation and propagation has been underestimated considering that the ANS is the major regulator of microvascular blood flow and that most triggers of VOC can alter the autonomic balance. Here, we will briefly review the evidence supporting the presence of ANS dysfunction in SCD, its implications in the onset of VOC, and how differences in autonomic vasoreactivity might potentially contribute to variability in VOC severity.

Keywords: autonomic nervous system dysfunction; microvascular blood flow; pain; sickle cell disease; vaso-occlusive crisis.


Conflict of interest statement

The authors declare no conflicts of interest.

Figures

Figure 1
Figure 1
The basic pathophysiological model of sickle vaso-occlusion suggests that microvascular occlusion will occur if the delay time from deoxygenation of HbS to polymerization (Td 1) is shorter than the microvascular transit time (Tt), as depicted in the lower two vessels. If delay time is longer (Td 2), or if blood is flowing faster, the red cell transition to a rigid shape takes place in a larger diameter post capillary vessel and occlusion is less likely to occur, as depicted in the top micro-vessel. Processes like nitric oxide (NO) depletion and endothelin-1 levels in the precapillary arterioles, and adhesion, inflammation, and viscosity in the post-capillary venule establish a steady state microvascular flow “tone”. Autonomic nervous system (ANS)-mediated vasoconstriction can decrease blood flow within seconds, increasing transit time and the likelihood of entrapment of rigid RBC. Image reprinted with permission from [19].
Figure 2
Figure 2
Experimental exposure to five breaths of 100% nitrogen caused desaturation similar to what can happen during sleep. Panels show change in oxygen saturation (A), finger blood flow (B), respiration (C) in a single sickle cell disease (SCD) subject, and change in average parasympathetic activity (cardiac high frequency power; HFP) in 11 SCD and 14 control subjects (D). Hypoxia resulted in significant parasympathetic nervous system withdrawal in SCD subjects, but not in controls (D). Hypoxia was not associated with a decrease in microvascular perfusion. However, periodic episodes of vasoconstriction (B) occurred at about 3.8 s after 78% of sighs (C) in SCD subjects versus only 17% in controls (p < 0.001). From [36] with permission.
Figure 3
Figure 3
This recording of microvascular perfusion in the right and left index fingers and forehead shows rapid global vasoconstriction in response to each series (Pain, T2–T5) of painful pulses of heat delivered to the right thenar eminence. (PPG = photoplethysmography, LDF = laser doppler flow).
Figure 4
Figure 4
Microvascular blood flow patterns recorded in three subjects in response to several sequences of painful heat pulses (pain, T2–T5) demonstrate significant subject-to-subject variability in neural-mediated vasoconstriction responses. (1) Subject 1 vasoconstricts and recovers blood flow between individual pain pulses; (2) Subject 2 has prolonged vasoconstriction with every sequence of pain stimuli, but recovers blood flow between the sequences; and (3) Subject 3 remains vasoconstricted after the initial stimulus with poor blood flow recovery.
Figure 5
Figure 5
The subjects in the upper-left quadrant have only vasoconstriction in response to head-up-tilt on tilt table testing, in comparison to the normal response of increase in heart rate and vasoconstriction in the upper-right quadrant. The subjects in the vasoconstriction-only group are almost exclusively SCD individuals. Having parasympathetic activity in the lower 10th percentile gives an SCD individual 76% probability of having a vasoconstriction-only phenotype (p < 0.01). (After [55] with permission).
Figure 6
Figure 6
This zoomed section of data shows that significant global vasoconstriction starts when the subjects is informed that “the pain stimulation will start in about two minutes” with additional decreases corresponding to each of the heat pulses. Clearly, anticipation of pain, as well as pain itself, causes vasoconstriction.
Figure 7
Figure 7
Experimental mental stress causes decrease in microvascular blood flow. However, being told you are going to feel pain is the most powerful stimulus for vasoconstriction (*, p < 0.0001 decrease in median blood flow compared to baseline; the two dots represent outliers). (After [59] with permission).

References

    1. Pauling L., Itano H.A., Singer S.J., Wells I.C. Sickle cell anemia a molecular disease. Science. 1949;110:543–548. doi: 10.1126/science.110.2865.543. - DOI - PubMed
    1. Ingram V.M. Abnormal human haemoglobins. III the chemical difference between normal and sickle cell haemoglobins. Biochim. Biophys. Acta. 1959;36:402–411. doi: 10.1016/0006-3002(59)90183-0. - DOI - PubMed
    1. Kato G.J., Piel F.B., Reid C.D., Gaston M.H., Ohene-Frempong K., Krishnamurti L., Vichinsky E.P., Smith W.R., Panepinto J.A., Weatherall D.J., et al. Sickle cell disease. Nat. Rev. Dis. Primers. 2018;4:18010. doi: 10.1038/nrdp.2018.10. - DOI - PubMed
    1. Eaton W., Hofrichter J. Hemoglobin S gelation and sickle cell disease. Blood. 1987;70:1245–1266. doi: 10.1182/blood.V70.5.1245.1245. - DOI - PubMed
    1. Ballas S.K., Mohandas N. Sickle red cell microrheology and sickle blood rheology. Microcirculation. 2004;11:209–225. doi: 10.1080/10739680490279410. - DOI - PubMed

LinkOut - more resources