. 2019 Oct 15;11(10):1564.
doi: 10.3390/cancers11101564.

Genetic and Lineage Classification of Glioma-Initiating Cells Identifies a Clinically Relevant Glioblastoma Model

Affiliations

Genetic and Lineage Classification of Glioma-Initiating Cells Identifies a Clinically Relevant Glioblastoma Model

Norihiko Saito et al. Cancers (Basel). .

Abstract

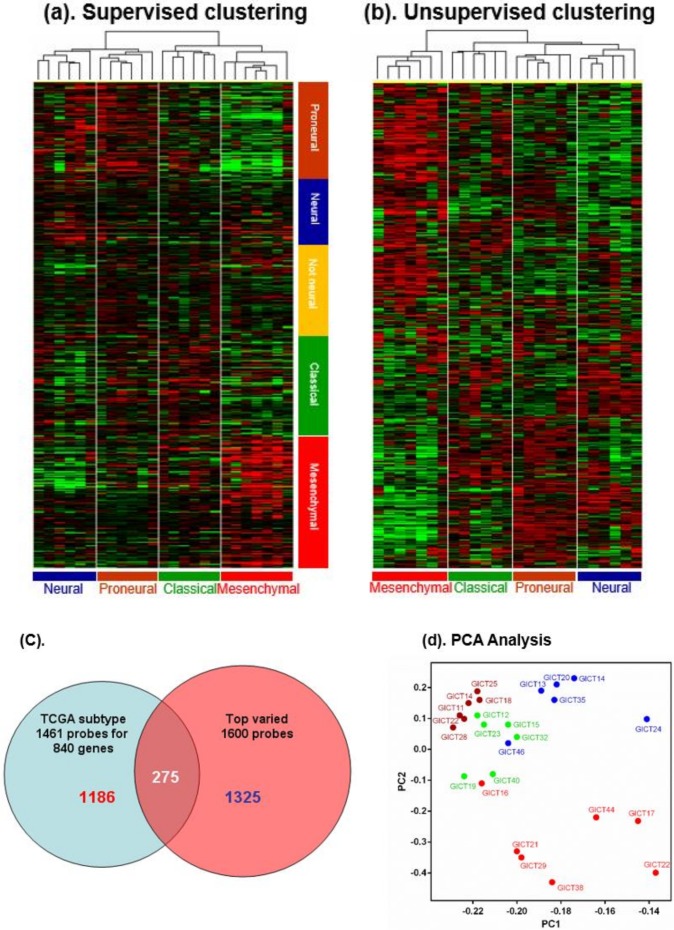
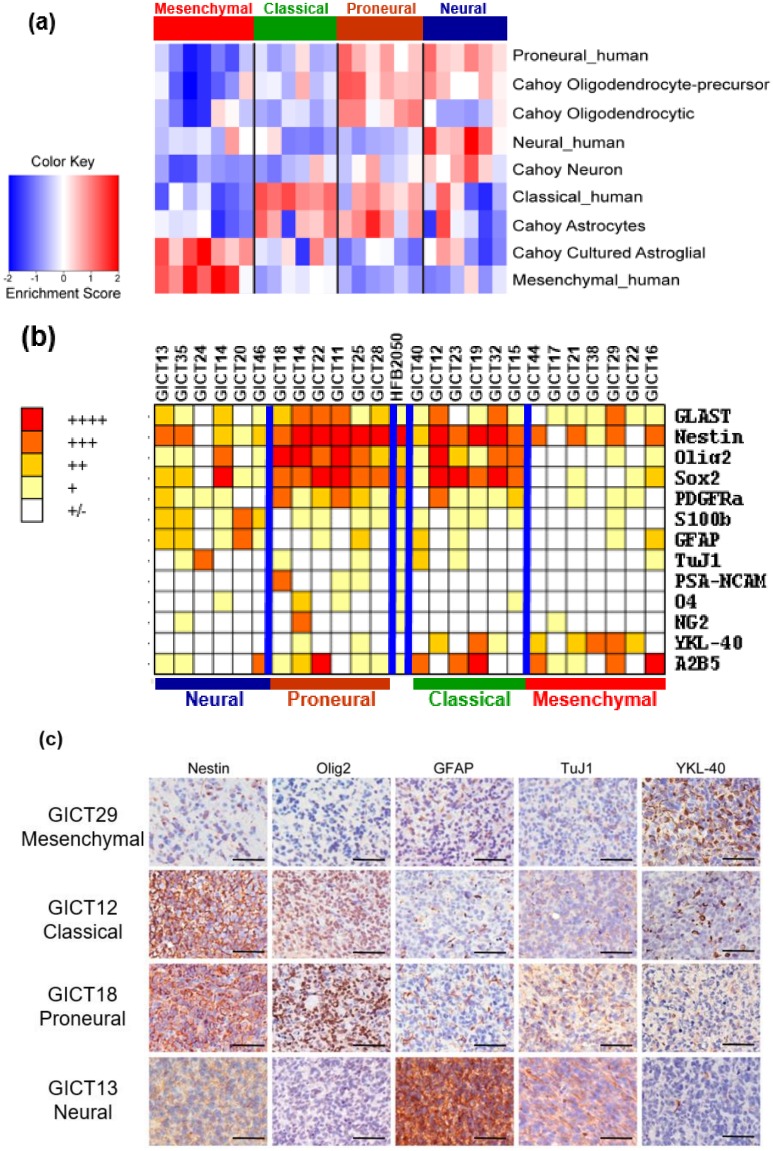
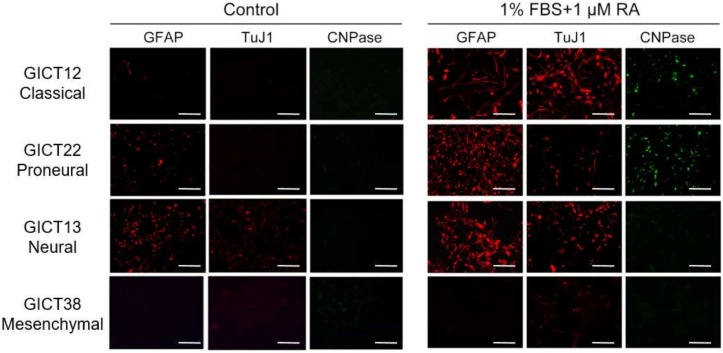
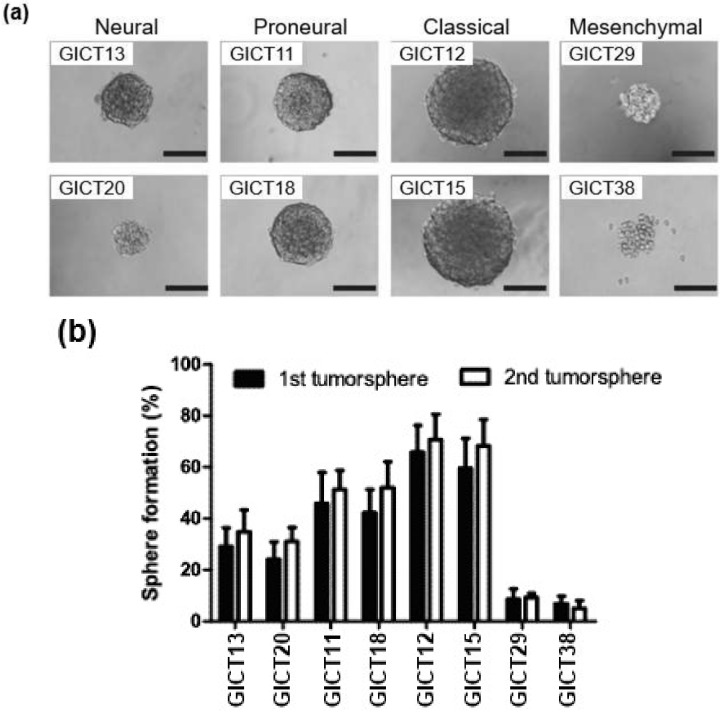
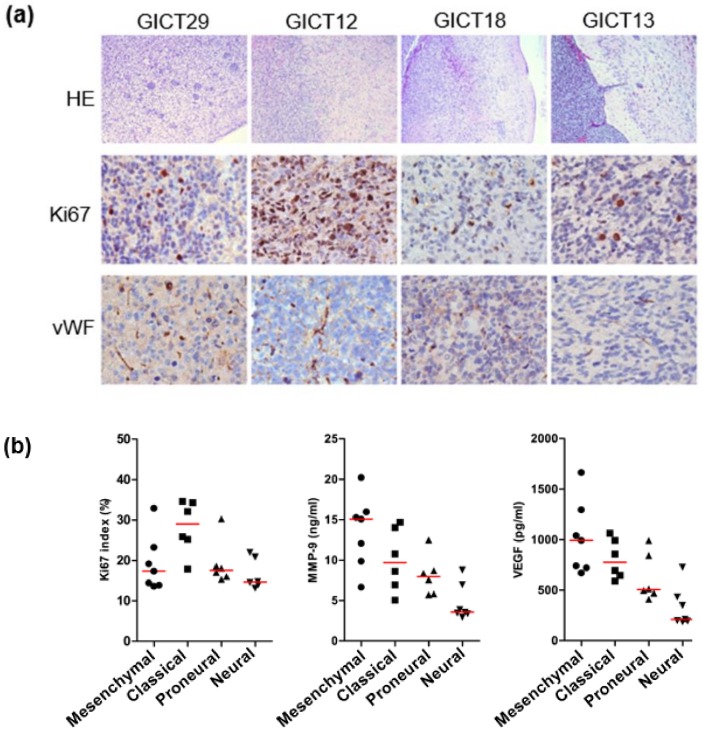
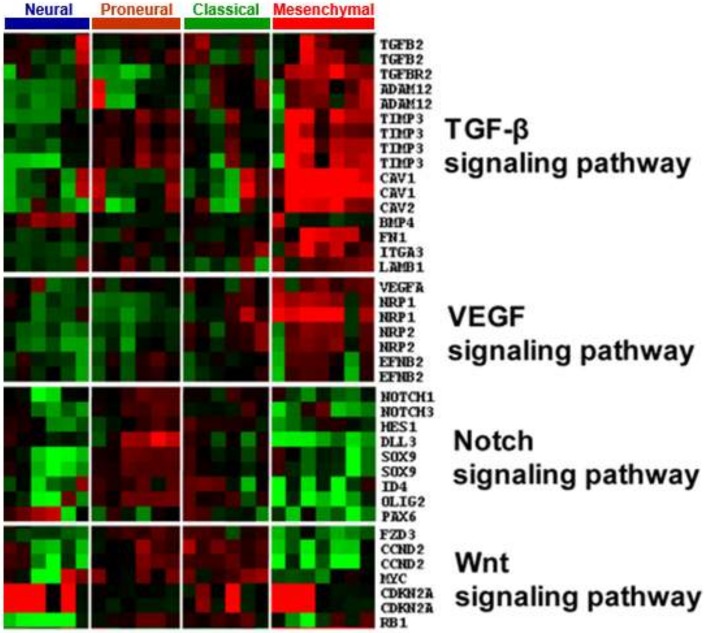
The Cancer Genome Atlas (TCGA) project described a robust gene expression-based molecular classification of glioblastoma (GBM), but the functional and biological significance of the subclasses has not been determined. The present comprehensive analysis of 25 glioma-initiating cell (GIC) lines classifies GIC lines into four subtypes (classical, mesenchymal, proneural, and neural) that are closely related to the TCGA GBM subclasses and display distinct lineage characteristics and differentiation behavior that recapitulate neural development. More importantly, the GIC subtypes exhibit distinct biological phenotypes in relation to self-renewal capacity, proliferation, invasiveness, and angiogenic potential in vitro and in vivo. In addition, the GIC subtypes exhibit divergent patterns of signaling pathway activation and deactivation of the Wnt, Notch, and TGF-β pathways. These results will improve drug discovery targeting certain genetic mutation in glioblastoma and improve the development of precision medicine.

Keywords: The Cancer Genome Atlas; glioblastoma; glioma initiating cell; molecular classification.


Conflict of interest statement

The authors declare no conflict of interest.

Figures

Figure 1
Figure 1
(a,b): Supervised clustering (The Cancer Genome Atlas (TCGA) 1461 probe sets) and unsupervised clustering (MTA 1600 probe sets) classified 25 glioma-initiating cell (GIC) cell lines into mesenchymal, neural, proneural, and classical subtypes. Defined GIC subtypes could be distinguished by their distinct patterns of gene expression, as related to TCGA subclass. (c) There were 275 probe sets (~20% of total) common to these two methods. (d) PCAof gene expression of the four GIC subtypes indicated that the proneural and classical GICs were most closely related and that neural and mesenchymal GICs deviated in a direction opposite to them, which supports the hypothesis that the “proneural” group has two GIC subtypes.
Figure 2
Figure 2
(a) GIC subtypes differentially expressed lineage markers for neural stem/progenitor cells (neuroepithelial cells, radial glia, glial progenitors, neuronal progenitors, oligodendrocyte progenitor cells, and SVZ astrocytes). (b) GIC subtypes exhibited distinct lineage profiles that recapitulated neural development. Earlier lineage markers (Nestin, Sox2, Olig2) are highly expressed in proneural and classical GICs, while differentiation markers (GFAP: glial fibrillary acidic protein, TuJ1: Neuron-specific beta-III Tubulin) are abundant in neural GICs. YKL-40: Chitinase-3-like protein 1 is enriched in mesenchymal GICs. (c): Lineage characteristics of GIC subtypes are retained in their intracranial xenografts. One of representative results of each subtypes are illustrated in Figure 2C. Scale bars: 100 μm.
Figure 3
Figure 3
GIC subtypes cultured under different conditions (1% (fetal bovine serum) FBS + 1 µM RA) exhibited varied potential for differentiation into neural lineages. Most proneural and classical GICs displayed trilineage differentiation potential, while neural GICs rarely differentiated into the oligodendrocytic lineage. Mesenchymal GICs were less likely to differentiate into astrocytic, neuronal, and oligodendrocytic lineages. One of representative results of each subtypes are illustrated in Figure 3. Scale bars: 100 μm.
Figure 4
Figure 4
(a,b): GIC subtypes exhibit distinct biological behaviors in relation to self-renewal capacity. Representative results of each subtypes are illustrated in Figure 4a,b. Scale bars: 250 μm.
Figure 5
Figure 5
(a) The in vivo biological behavior of GIC subtypes was studied by orthotopic injection of cells into mouse brain. The neural xenograft subtype was the least angiogenic, as indicated by vWF staining. Ki67 staining showed that classical GICs were most active in proliferation in vivo. Scale bars: 100 μm. (b) Neural GICs produced significantly lower amounts of VEGF and MMP-9.
Figure 6
Figure 6
GIC subtypes exhibited divergent patterns of signaling pathway activation. Multiple pathways, such as TGF-β, Notch, VEGF, and Wnt, were identified in GIC subgroups.

References

    1. Chang S.M., Theodosopoulos P., Lamborn K., Malec M., Rabbitt J., Page M., Prados M.D. Temozolomide in the treatment of recurrent malignant glioma. Cancer. 2004;100:605–611. doi: 10.1002/cncr.11949. - DOI - PubMed
    1. Wen P.Y., Kesari S. Malignant gliomas in adults. N. Engl. J. Med. 2008;359:492–507. doi: 10.1056/NEJMra0708126. - DOI - PubMed
    1. Stupp R., Mason W.P., van den Bent M.J., Weller M., Fisher B., Taphoorn M.J., Belanger K., Brandes A.A., Marosi C., Bogdahn U., et al. Radiotherapy plus concomitant and adjuvant temozolomide for glioblastoma. N. Engl. J. Med. 2005;352:987–996. doi: 10.1056/NEJMoa043330. - DOI - PubMed
    1. Purow B., Schiff D. Advances in the genetics of glioblastoma: Are we reaching critical mass? Nat. Rev. Neurol. 2009;5:419–426. doi: 10.1038/nrneurol.2009.96. - DOI - PMC - PubMed
    1. Singh S.K., Hawkins C., Clarke I.D., Squire J.A., Bayani J., Hide T., Henkelman R.M., Cusimano M.D., Dirks P.B. Identification of human brain tumour initiating cells. Nature. 2004;432:396–401. doi: 10.1038/nature03128. - DOI - PubMed

Grants and funding

LinkOut - more resources