. 2020 Feb;17(2):227-239.
doi: 10.1080/15476286.2019.1674595. Epub 2019 Oct 17.

Divergent effects of translation termination factor eRF3A and nonsense-mediated mRNA decay factor UPF1 on the expression of uORF carrying mRNAs and ribosome protein genes

Affiliations

Divergent effects of translation termination factor eRF3A and nonsense-mediated mRNA decay factor UPF1 on the expression of uORF carrying mRNAs and ribosome protein genes

Affaf Aliouat et al. RNA Biol. 2020 Feb.

Abstract

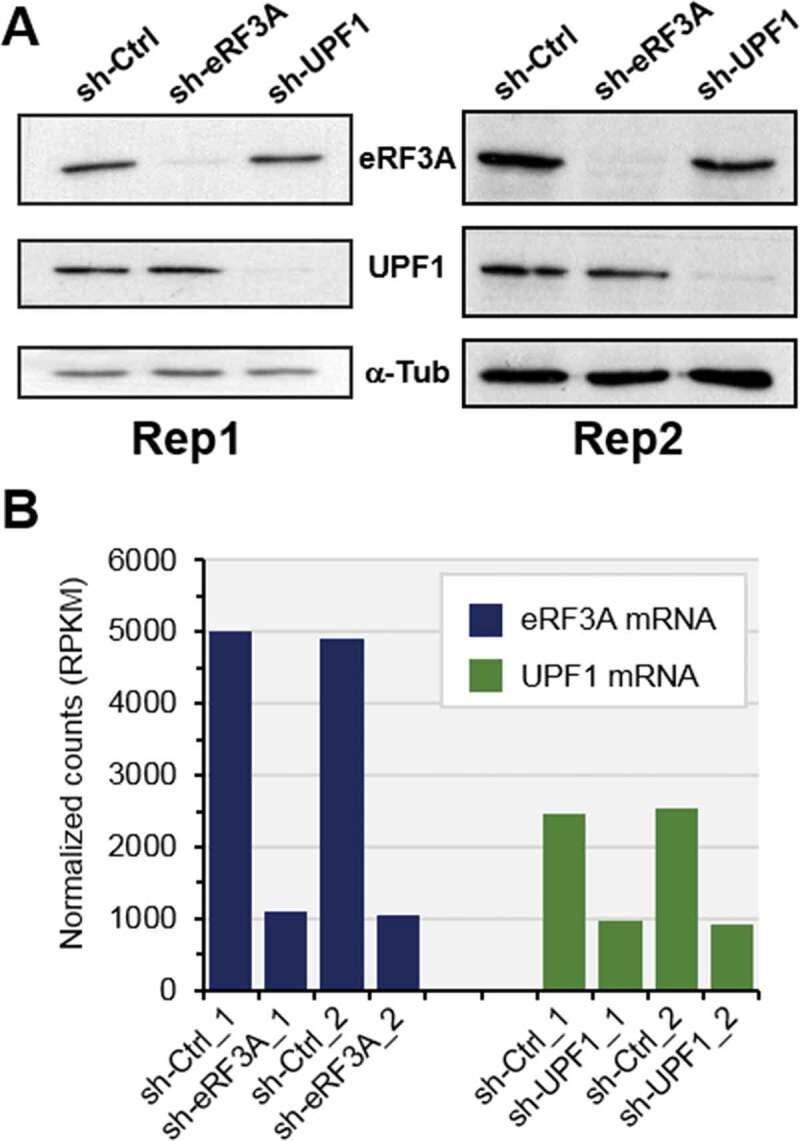
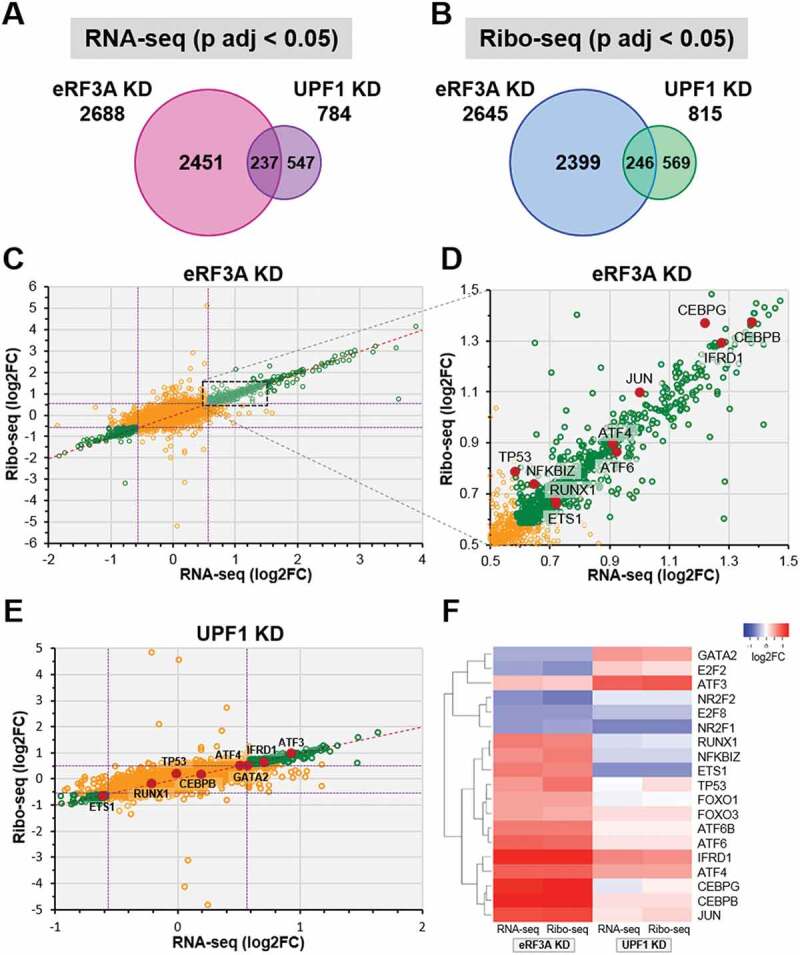
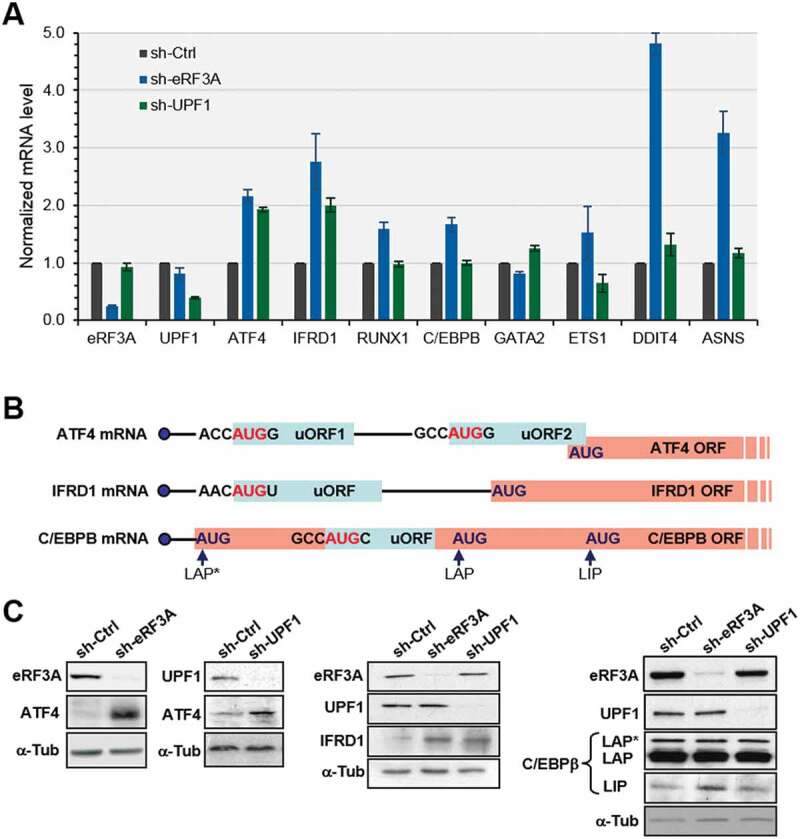
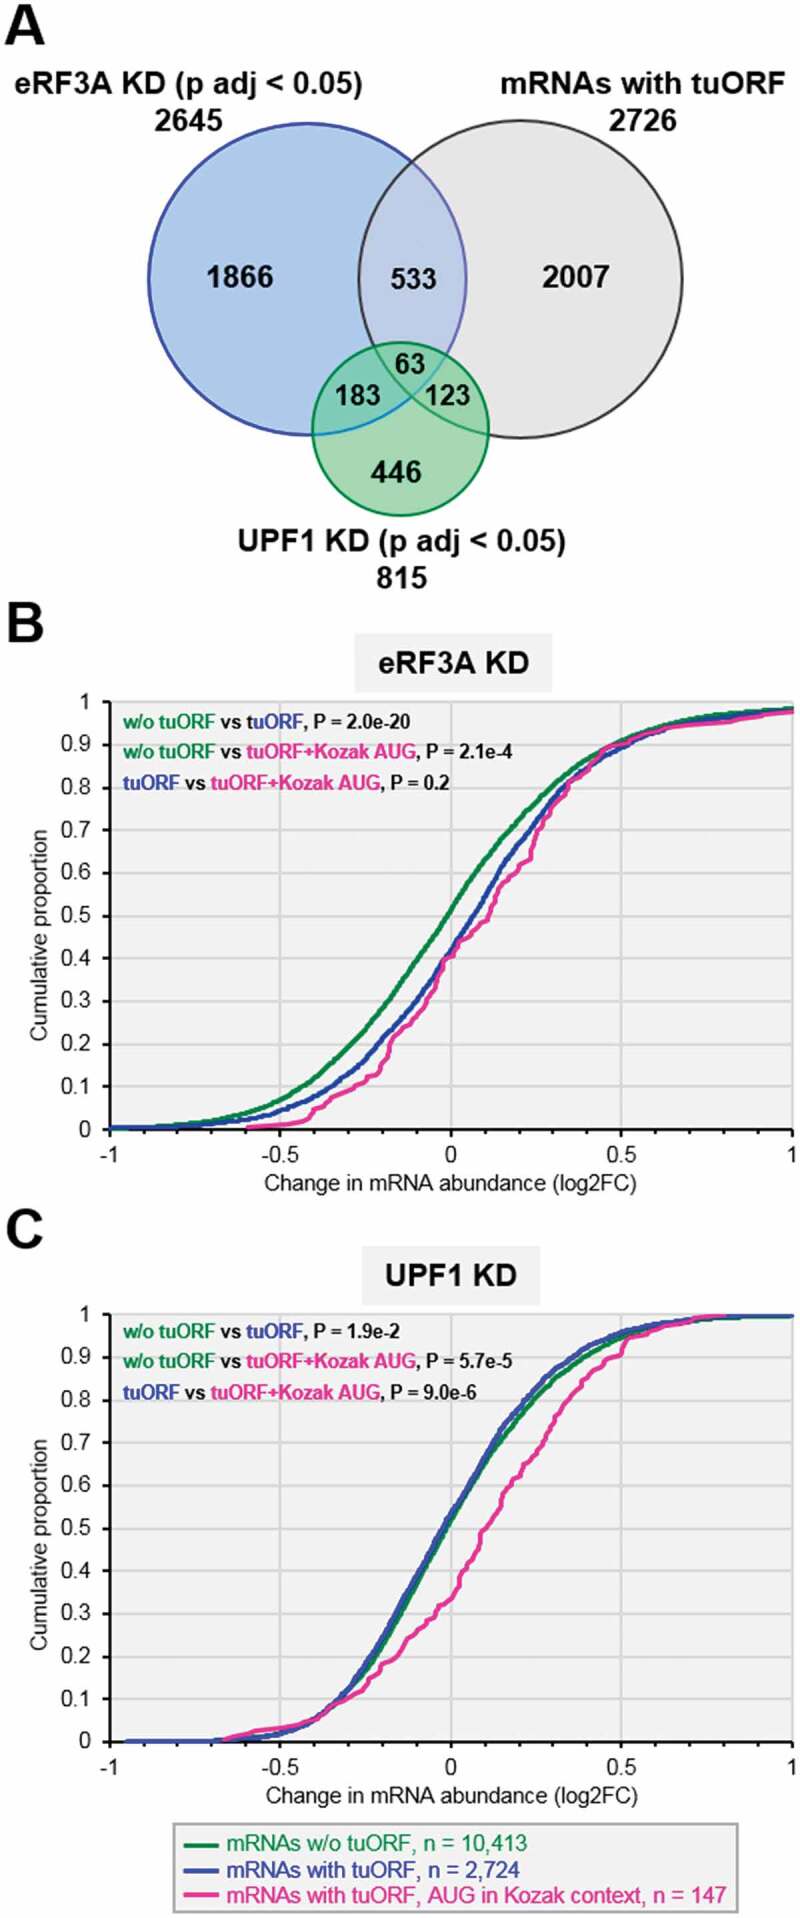
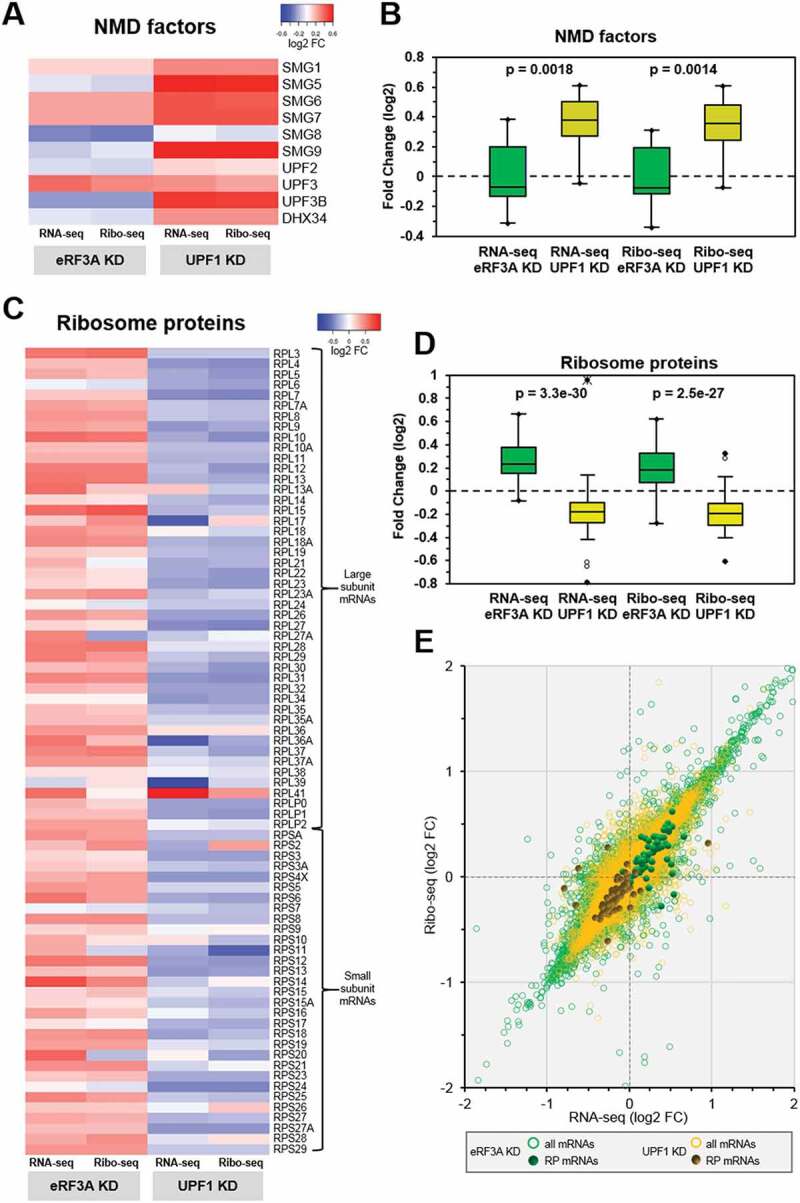
In addition to its role in translation termination, eRF3A has been implicated in the nonsense-mediated mRNA decay (NMD) pathway through its interaction with UPF1. NMD is a RNA quality control mechanism, which detects and degrades aberrant mRNAs as well as some normal transcripts including those that harbour upstream open reading frames in their 5' leader sequence. In this study, we used RNA-sequencing and ribosome profiling to perform a genome wide analysis of the effect of either eRF3A or UPF1 depletion in human cells. Our bioinformatics analyses allow to delineate the features of the transcripts controlled by eRF3A and UPF1 and to compare the effect of each of these factors on gene expression. We find that eRF3A and UPF1 have very different impacts on the human transcriptome, less than 250 transcripts being targeted by both factors. We show that eRF3A depletion globally derepresses the expression of mRNAs containing translated uORFs while UPF1 knockdown derepresses only the mRNAs harbouring uORFs with an AUG codon in an optimal context for translation initiation. Finally, we also find that eRF3A and UPF1 have opposite effects on ribosome protein gene expression. Together, our results provide important elements for understanding the impact of translation termination and NMD on the human transcriptome and reveal novel determinants of ribosome biogenesis regulation.

Keywords: GSPT1; UPF1; eRF3; nonsense-mediated mRNA decay; ribosome protein genes; translation termination; uORF.


Figures

Figure 1.
Figure 1.
Monitoring of eRF3A and UPF1 knockdown in HCT 116 cells. (A) Western blot analysis of eRF3A and UPF1 in the two biological replicates (Rep1 and Rep2) of eRF3A-depleted cells (sh-eRF3A), UPF1-depleted cells (sh-UPF1) and control cells (sh-Ctrl); α-Tubulin (α-Tub) served as a loading control. (B) eRF3A and UPF1 mRNA levels in eRF3A-depleted (sh-eRF3A) and UPF1-depleted (sh-UPF1) and control (sh-Ctrl) cells for the two biological replicates of RNAseq experiments; normalized counts are expressed in RPKM (reads per kilobase million).
Figure 2.
Figure 2.
Comparison of differentially expressed genes in eRF3A and UPF1 knockdown cells. (A and B) Proportional Venn diagrams showing the overlap of differentially expressed genes (adjusted p‐value, p adj < 0.05, DESeq2) between eRF3A knockdown and UPF1 knockdown targets for RNA-seq (A) and Ribo-seq (B) data. For each Venn diagram, the number of differentially expressed genes are indicated. (C) Scatter plot comparing Ribo-seq (y axis) and RNA-seq (x axis) log2 Fold Change (log2FC) for eRF3A-depleted versus control cells (eRF3A KD). Green circles indicate genes with p adj < 0.05, dotted purple lines indicate 1.5 fold change (log2FC = ± 0.585). (D) Enlargement of the dotted rectangle in C. Some transcriptional regulator genes are indicated by red dots. (E) Scatter plot comparing Ribo-seq (y axis) and RNA-seq (x axis) log2 Fold Change (log2FC) for UPF1-depleted versus control cells (UPF1 KD). Green circles indicate genes with p adj < 0.05, dotted purple lines indicate 1.5 fold change. Some transcriptional regulator genes are indicated by red dots. (F) Expression heatmap of a selection of transcriptional regulators for eRF3A and UPF1 knockdown cells. Heatmap was performed using Heatmapper website http://www2.heatmapper.ca/expression/[85] and Complete Linkage clustering method.
Figure 3.
Figure 3.
Validation of differentially expressed genes in eRF3A and UPF1 knockdown cells. (A) RT-qPCR performed on total RNA of HCT 116 cells 3 days after electroporation with shRNAs targeting eRF3A mRNA (sh-eRF3A) or UPF1 mRNA (sh-UPF1) or control shRNA (sh-Ctrl). mRNA levels of eRF3A, UPF1 and selected eRF3A and UPF1 targets are shown. The ratio of mRNA levels in either eRF3A knockdown (sh-eRF3A) or UPF1 knockdown (sh-UPF1) versus control cells (sh-Ctrl) was calculated, mRNA levels in the control cells was set to 1.0. Bars and error bars correspond to mean values and standard deviations from two independent experiments. (B) Schematic illustration of the organization of uORFs in the transcripts of ATF4, IFRD1 and C/EBPβ. The start codon context of the uORFs is indicated. ATF4 mRNA carries two uORFs with uORF2 overlapping ATF4 main ORF, IFRD1 mRNA presents only one uORF and C/EBPβ mRNA present a single uORF located within its main ORF. The different isoforms of C/EBPβ termed LAP* for liver-activating protein*, LAP and LIP for liver inhibitory protein are translated from three consecutive in-frame AUG codons[86]. (C) Western blot analysis of eRF3A, UPF1 and ATF4 (left panels), IFRD1 (central panel), or C/EBPβ proteins (right panel) in control cells (sh-Ctrl), eRF3A-depleted cells (sh-eRF3A) and UPF1-depleted cells (sh-UPF1); α-Tubulin (α-Tub) served as a loading control.
Figure 4.
Figure 4.
Expression of uORF carrying mRNAs in eRF3A and UPF1 knockdown cells. A. Proportional Venn diagram showing the overlap between three sets of transcripts: differentially expressed genes (main coding sequence changes in Ribo-seq data; p adj < 0.05) in eRF3A knockdown cells (blue circle, eRF3A KD), UPF1 knockdown cells (green circle, UPF1 KD) and mRNAs carrying translated uORFs – tuORF (purple circle). The number of genes is indicated for each class of mRNA. (B and C) Cumulative distribution functions of changes in mRNA abundance (plotted as log2FC) following eRF3A depletion (B, eRF3A KD) or UPF1 depletion (C, UPF1 KD) for mRNAs without translated uORF corresponding to mRNA devoid of uORF and to mRNAs with non-translated uORFs (w/o tuORF, green line), mRNAs with translated uORFs (tuORF, blue line) and mRNAs carrying a translated uORF with an AUG initiation codon surrounded by a Kozak context (pink line). In B and C, P-values were determined by Wilcoxon rank sum test for the two sided hypothesis with a 95% confidence interval. The number of genes in each category is indicated below the graphs.
Figure 5.
Figure 5.
Feedback control loops in eRF3A and UPF1 knockdown cells. (A) Heatmap representation of the differential expression levels (log2 FC scale) of the NMD factor mRNAs in the transcriptome (RNA-seq) and translatome (Ribo-seq) following eRF3A knockdown (eRF3A KD) or UPF1 knockdown (UPF1 KD). Heatmap was performed using Heatmapper website http://www2.heatmapper.ca/expression/[85] without linkage clustering method. (B) Corresponding box plot of log2FC values for NMD factor mRNAs in RNA-seq and Ribo-seq experiments. The central lines show the medians; the box limits indicate the 25th and 75th percentiles. Two-tailed t-test was used to determine p-values. (C) Heatmap representation of the expression levels of ribosomal protein mRNAs in the transcriptome (RNA-seq) and translatome (Ribo-seq) following eRF3A knockdown (eRF3A KD) or UPF1 knockdown (UPF1 KD). Heatmap was performed as in A. (D) Corresponding box plot of log2FC values for ribosomal protein mRNAs in RNA-seq and Ribo-seq experiments. Box plot was performed as in B. (E) Scatter plot of the Ribo-seq versus RNA-seq differential expression for eRF3A depletion (all mRNAs: green circles and ribosome protein (RP) mRNAs: green dots) and UPF1 depletion (all mRNAs: yellow circles and ribosome protein (RP) mRNAs: dark yellow dots).

References

    1. Jackson RJ, Hellen CUT, Pestova TV.. Termination and post-termination events in eukaryotic translation. Adv Protein Chem Struct Biol. 2012;86:45–93. - PubMed
    1. Lejeune F. Nonsense-mediated mRNA decay at the crossroads of many cellular pathways. BMB Rep. 2017;50:175–185. - PMC - PubMed
    1. Kim YK, Maquat LE. UPFront and center in RNA decay: UPF1 in nonsense-mediated mRNA decay and beyond. RNA. 2019;25:407–422. - PMC - PubMed
    1. Raimondeau E, Bufton JC, Schaffitzel C. New insights into the interplay between the translation machinery and nonsense-mediated mRNA decay factors. Biochem Soc Trans. 2018;46:503–512. - PMC - PubMed
    1. Losson R, Lacroute F. Interference of nonsense mutations with eukaryotic messenger RNA stability. Proc Natl Acad Sci USA. 1979;76:5134–5137. - PMC - PubMed

Publication types

MeSH terms