. 2020 Jan 23;55(1):1900746.
doi: 10.1183/13993003.00746-2019. Print 2020 Jan.

Transcriptional characterisation of human lung cells identifies novel mesenchymal lineage markers

Affiliations

Transcriptional characterisation of human lung cells identifies novel mesenchymal lineage markers

Soula Danopoulos et al. Eur Respir J. .

Abstract

Rationale: The lung mesenchyme gives rise to multiple distinct lineages of cells in the mature respiratory system, including smooth muscle cells of the airway and vasculature. However, a thorough understanding of the specification and mesenchymal cell diversity in the human lung is lacking.

Methods: We completed single-cell RNA sequencing analysis of fetal human lung tissues. Canonical correlation analysis, clustering, cluster marker gene identification and t-distributed stochastic neighbour embedding representation was performed in Seurat. Cell populations were annotated using ToppFun. Immunohistochemistry and in situ hybridisation were used to validate spatiotemporal gene expression patterns for key marker genes.

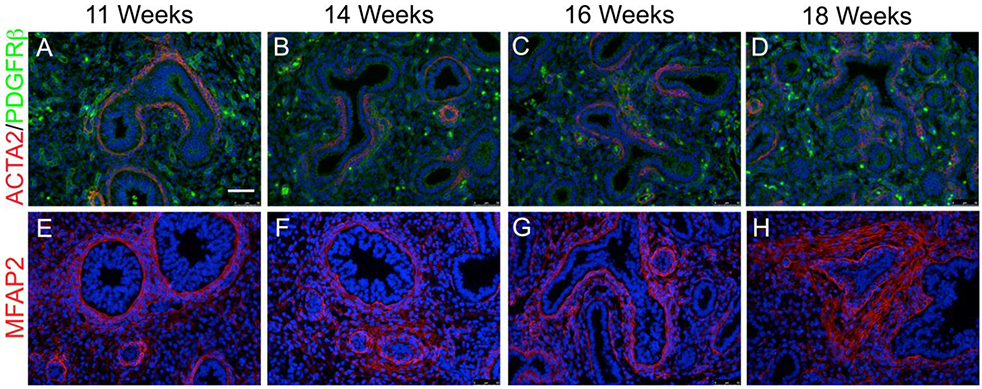
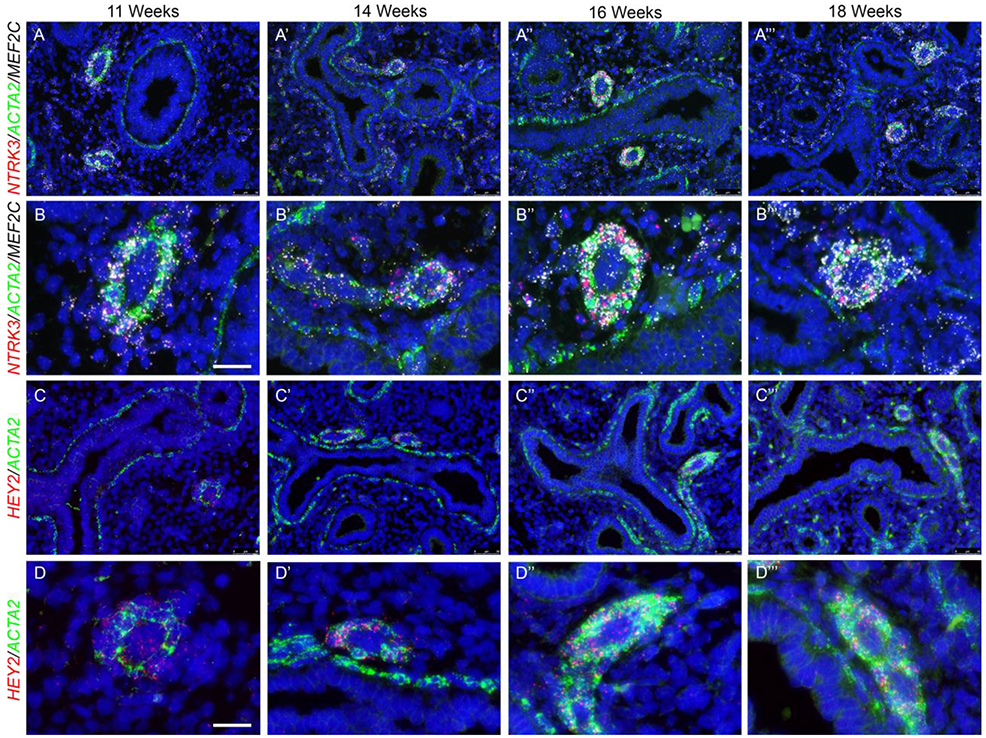
Results: We identified molecularly distinct populations representing "committed" fetal human lung endothelial cells, pericytes and smooth muscle cells. Early endothelial lineages expressed "classic" endothelial cell markers (platelet endothelial cell adhesion molecule/CD31 and claudin 5), while pericytes expressed platelet-derived growth factor receptor-β, Thy-1 membrane glycoprotein and basement membrane molecules (collagen IV, laminin and proteoglycans). We observed a large population of "nonspecific" human lung mesenchymal progenitor cells characterised by expression of collagen I and multiple elastin fibre genes (ELN, MFAP2 and FBN1). We closely characterised the diversity of mesenchymal lineages defined by α2-smooth muscle actin (ACTA2) expression. Two cell populations, with the highest levels of ACTA2 transcriptional activity, expressed unique sets of markers associated with airway or vascular smooth muscle cells. Spatiotemporal analysis of these marker genes confirmed early and persistent spatial specification of airway (HHIP, MYLK and IGF1) and vascular (NTRK3 and MEF2C) smooth muscle cells in the developing human lung.

Conclusion: Our data suggest that specification of distinct airway and vascular smooth muscle cell phenotypes is established early in development and can be identified using the markers we provide.


Conflict of interest statement

Conflict of interest: S. Bhattacharya has nothing to disclose. Conflict of interest: T.J. Mariani has nothing to disclose. Conflict of interest: D. Al Alam has nothing to disclose. Conflict of interest: S. Danopoulos has nothing to disclose.

Figures

Figure 1:
Figure 1:. Single cell (sc) RNA-seq identifies cell populations in human fetal lung.
(A) Unsupervised graph-based clustering of scRNA-seq data from early stages of lung development, visualized using t-distributed stochastic neighbor embedding (tSNE). Each point represents a single cell, and individual clusters are colored and annotated based on cell type associations derived from Toppfun. (B) Gene expression patterns for individual canonical cell lineage markers in fetal lung cell clusters, overlaid on tSNE plots defining cell type clusters. Each point represents a single cell, with blue color indicating expression level of the specified marker gene (darker shade is higher expression). Expression of some lineage markers is highly restricted (e.g., SFTPC to epithelial cells, PECAM1 and CDH5 to endothelial cells, PTPRC and HLA-DRA to leukocytes), while other markers are more widely expressed (KRT8, ACTA2, COL1A1, ELN).
Figure 2:
Figure 2:. Heat map indicating human fetal lung cell population markers.
Heatmap displays gene expression patterns for marker genes (n=10 each; total of 98 due to 2 markers in more than 1 cluster) for each cell population cluster, based on differential expression testing. Individual genes are represented in rows, and individual cells (n=3236) are represented in columns. Yellow indicates high relative gene expression, and purple indicates low or no expression. Each cluster is labeled by its presumed cell type based upon annotation with Toppfun.
Figure 3:
Figure 3:. Spatial validation for matrix fibroblasts.
(A-D) Immunofluorescent (IF) staining of FIBRILLIN1 (FBN1, Red) on 11 weeks (A), 14 weeks (B), 16 weeks (C) and 18 weeks (D) fetal human lung demonstrates localization within the airway and vascular smooth muscle cells. (E-H) IF co-staining of DECORIN (DCN, Red) and COL1A1 (Green) on 11 weeks (E), 14 weeks (F), 16 weeks (G) and 18 weeks (H) fetal lung demonstrates that the two colocalize throughout development in multiple cell populations. Scale bar is 50μm. (n=3 for each gestational stage)
Figure 4:
Figure 4:. Spatial validation of endothelial cells.
(A-D) IF staining of CD31 (Green) on 11 weeks (A), 14 weeks (B), 16 weeks (C), and 18 weeks (D) fetal human lung localized specifically in the endothelial cells. (E-H) IF staining of CLAUDIN5 (CLDN5, Red) on 11 weeks (E), 14 weeks (F), 16 weeks (G), and 18 weeks (H) human fetal lung is primarily localized in the endothelial cells with some expression in the epithelial cells. Scale bar is 50μm. (n=3 for each gestational stage)
Figure 5:
Figure 5:. Spatial validation of pericytes and stromal cells.
(A-D) IF co-staining of ACTA2 (Red) and PDGFR β (Green) on 11 weeks (A), 14 weeks (B), 16 weeks (C), and 18 weeks (D) native fetal human lung demonstrates the two are not co-expressed, and the presence of pericytes from an early developmental stage. (E-H) IF co-staining of MFAP2 (Red) on 11 weeks (E), 14 weeks (F), 16 weeks (G), and 18 weeks (H) native human fetal lung demonstrates strong localization around airway and vascular structures. (n=3 for each gestational stage)
Figure 6:
Figure 6:. Heterogeneity of Cells Expressing Smooth Muscle Actin (ACTA2) expression.
Shown is unsupervised graph-based sub-clustering of scRNA-seq data of cells expressing ACTA2 (raw count>2; n=781), visualized using t-distributed stochastic neighbor embedding (tSNE). Each point represents a single cell, identified as a separate population by unsupervised clustering (A), or colored based on the expression level of ACTA2 (B). Interestingly, cells with highest ACTA2 (ACTA2hi) expression reside in one of two clusters (0 and 3), whose marker genes identify them as myofibroblasts. (C) Shown is a heatmap displaying gene expression of cluster marker genes (n=25 each) for the two ACTA2hi cell populations (sub-clusters 0 and 3). Individual genes are represented in rows, and individual cells (n=264) are represented in columns. Yellow indicates high relative gene expression, and purple indicates low or no expression. (D) We performed in-depth cell type annotation analysis using marker genes for ACTA2 expressing populations. Shown are the frequencies for marker genes being annotated to specific lung (LungMAP) cell types. Multiple ACTA2 sub-clusters have several smooth muscle/mesenchymal stromal cell-related annotations (sub-clusters 1, 2 and 9). However, the two ACTA2hi sub-clusters have unique smooth muscle cell annotations, one associated with trachea (sub-cluster 0) and one associated with vasculature (sub-cluster 3).
Figure 7:
Figure 7:. Airway smooth muscle cell spatial validation.
(A-A’”) Fluorescent in situ hybridization (FISH) of hedgehog-interacting protein (HHIP) (red), myosin light-chain kinase (MYLK) (white), and ACTA2 (green) on fetal human lung sections at 11 weeks (A), 14 weeks (A), 16 weeks (A”) and 18 weeks (A’”) gestation demonstrated co-localization around the airway smooth muscles with no presence around the vascular smooth muscles. (B-B’”) FISH of insulin-like growth factor 1 (IGF-1) (Red) in conjunction with ACTA2 (green) on fetal human lung sections at different gestational stages demonstrates that IGF1 is solely localized in the airway smooth muscle cells throughout development. (C-C’”) FISH of FGF18 (Green) in conjunction with ACTA2 IF (Red) demonstrates that FGF18 is localized in the airway smooth muscled cells and lower expression in the distal epithelium between 11-18 weeks of lung development but is not expressed in the vascular smooth muscle cells. Scale bar is 50μm. High magnification panels of 16 week gestation confirm co-localization of markers within the airway smooth muscle cells (A””, B””, C””). High magnification panels for other gestations are provided in Supplemental Figure 4. Scale bar is 25μm. (n=3 for each gestational stage)
Figure 8:
Figure 8:. Vascular smooth muscle cell spatial validation.
(A-A’”) FISH of neurotrophic tyrosine kinase, receptor, type 3 (NTRK3) (Red) and myocyte enhancer factor-2C (MEF2C) (White) in conjunction with ACTA2 (Green) on human fetal lung sections at different gestational stages demonstrates that NTRK3 is localized in the vascular smooth muscle cells with no expression in the airway smooth muscle cells, whereas MEF2C is predominantly expressed in the vascular smooth muscle cells with minimal expression in the airway smooth muscle cells throughout development. (B-B’”) High magnification panels to confirm co-localization of NTRK3 and MEF2C within the vascular smooth muscle cells. (C-C’”) FISH of Hairy/enhancer-of-split related with YRPW motif protein 2 (HEY2) (red) and ACTA2 (green) displayed that HEY2 is solely expressed in the vascular smooth muscle cells with some expression in the proximal epithelium, but not expression in the airway smooth muscle cells. (D-D’”) High magnification panels to confirm co-localization of HEY2 within the vascular smooth muscle cells. Scale bar is 50μm. Scale bar for high magnifications is 25μm. (n=3 for each gestational stage)

Comment in

References

    1. Chung MI, Hogan BLM. Ager-CreER(T2): A New Genetic Tool for Studying Lung Alveolar Development, Homeostasis, and Repair. Am J Respir Cell Mol Biol 2018. - PMC - PubMed
    1. Yang Y, Riccio P, Schotsaert M, Mori M, Lu J, Lee DK, Garcia-Sastre A, Xu J, Cardoso WV. Spatial-Temporal Lineage Restrictions of Embryonic p63(+) Progenitors Establish Distinct Stem Cell Pools in Adult Airways. Dev Cell 2018; 44: 752–761 e754. - PMC - PubMed
    1. Mori M, Mahoney JE, Stupnikov MR, Paez-Cortez JR, Szymaniak AD, Varelas X, Herrick DB, Schwob J, Zhang H, Cardoso WV. Notch3-Jagged signaling controls the pool of undifferentiated airway progenitors. Development 2015; 142: 258–267. - PMC - PubMed
    1. Jain R, Barkauskas CE, Takeda N, Bowie EJ, Aghajanian H, Wang Q, Padmanabhan A, Manderfield LJ, Gupta M, Li D, Li L, Trivedi CM, Hogan BL, Epstein JA. Plasticity of Hopx(+) type I alveolar cells to regenerate type II cells in the lung. Nat Commun 2015; 6: 6727. - PMC - PubMed
    1. Lange AW, Sridharan A, Xu Y, Stripp BR, Perl AK, Whitsett JA. Hippo/Yap signaling controls epithelial progenitor cell proliferation and differentiation in the embryonic and adult lung. J Mol Cell Biol 2015; 7: 35–47. - PMC - PubMed

Publication types

LinkOut - more resources