. 2019 Nov 5;93(19):e1756-e1767.
doi: 10.1212/WNL.0000000000008441. Epub 2019 Oct 16.

Large variation in effects during 10 years of enzyme therapy in adults with Pompe disease

Affiliations

Large variation in effects during 10 years of enzyme therapy in adults with Pompe disease

Laurike Harlaar et al. Neurology. .

Abstract

Objective: To determine the effects of 10 years of enzyme replacement therapy (ERT) in adult patients with Pompe disease, focusing on individual variability in treatment response.

Methods: In this prospective, multicenter cohort study, we studied 30 patients from the Netherlands and France who had started ERT during the only randomized placebo-controlled clinical trial with ERT in late-onset Pompe disease (NCT00158600) or its extension (NCT00455195) in 2005 to 2008. Main outcomes were walking ability (6-minute walk test [6MWT]), muscle strength (manual muscle testing using Medical Research Council [MRC] grading), and pulmonary function (forced vital capacity [FVC] in the upright and supine positions), assessed at 3- to 6-month intervals before and after the start of ERT. Data were analyzed with linear mixed-effects models for repeated measurements.

Results: Median follow-up duration on ERT was 9.8 years (interquartile range [IQR] 8.3-10.2 years). At the group level, baseline 6MWT was 49% of predicted (IQR 41%-60%) and had deteriorated by 22.2 percentage points (pp) at the 10-year treatment point (p < 0.001). Baseline FVC upright was 54% of predicted (IQR 47%-68%) and decreased by 11 pp over 10 years (p < 0.001). Effects of ERT on MRC sum score and FVC supine were similar. At the individual level, 93% of patients had initial benefit of ERT. Depending on the outcome measured, 35% to 63% of patients had a secondary decline after ≈3 to 5 years. Still, at 10 years of ERT, 52% had equal or better 6MWT and/or FVC upright compared to baseline.

Conclusions: The majority of patients with Pompe disease benefit from long-term ERT, but many patients experience some secondary decline after ≈3 to 5 years. Individual variation, however, is considerable.

Classification of evidence: This study provides Class IV evidence that for the majority of adults with Pompe disease, long-term ERT positively affects, or slows deterioration in, muscle strength, walking ability, and/or pulmonary function.


Figures

Figure 1
Figure 1. Definition of response patterns
Individual response to enzyme replacement therapy was classified into 1 of 8 different response patterns defined: (A) improvement throughout the study, (B) initial improvement followed by stabilization, (C) initial improvement followed by decline, (D) stable throughout the study, (E) initial stabilization followed by decline, (F) decline throughout the study, (G) initial decline followed by stabilization or improvement, and (H) unclassifiable.
Figure 2
Figure 2. Disease course of the individual patients over time (n = 30)
Each bar represents 1 individual patient. The length of each bar represents the symptom duration before the start of enzyme replacement therapy (ERT) (light blue), follow-up period during ERT (dark blue), and follow-up duration after stopping ERT (red). The age at the start of using a wheelchair (green diamond), ventilation (yellow square), or death (red cross) is indicated.
Figure 3
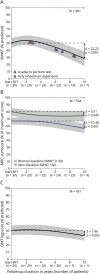
Figure 3. Effect of ERT on walking ability and muscle strength
Disease course at the group level after the start of enzyme replacement therapy (ERT) for (A) 6-minute walk test (6MWT), (B) Medical Research Council (MRC) sum score, and (C) QMT leg score. Solid lines represent the measured course during treatment. The 95% confidence intervals are shown in gray. For 6MWT, the triangles mark the time point from which individual patients were not able to perform the test due to the risk of falling (blue triangle) or full wheelchair dependency (red triangle). For MRC sum score, the disease courses of the best (men, baseline 6MWT >50% predicted) and worst (women, baseline 6MWT ≤50% predicted) subgroups are shown. The other 2 subgroups (men, baseline 6MWT ≤50% predicted; women, baseline 6MWT >50% predicted) had an intermediate course. M = total number of measurements; n = number of patients at that time of follow-up.
Figure 4
Figure 4. Effect of ERT on pulmonary function
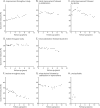
Disease course at group level after start of enzyme replacement therapy (ERT) for forced vital capacity (FVC) in the upright and supine positions and maximal inspiratory (MIP) and maximal expiratory (MEP) pressures compared to (A–D) baseline or (E and F) the extrapolated natural disease course. Solid lines represent the measured natural course of the disease and/or the course during treatment. Dashed line represents the natural course extrapolated on the basis of natural course data. The 95% confidence intervals are shown in gray. For FVC supine, the triangles mark the time point from which patients were not able to perform the test due to severe orthopnea or full wheelchair dependency. M = total number of measurements; n = number of patients at that time of follow-up.
Figure 5
Figure 5. Effect of ERT in individual patients
(A) Initial, secondary, and overall disease course at the individual patient level after the start of enzyme replacement therapy (ERT) for 6-minute walk test (6MWT), Medical Research Council (MRC) sum score, quantitative muscle testing (QMT) leg score, and forced vital capacity (FVC) upright and FVC supine separately. Combined individual patients' response on 6MWT and FVC in upright position, subdivided into (B) initial, (C) secondary, and (D) overall response (D). One patient was excluded from this specific analysis due to the short follow-up time on ERT (1 month). The initial and secondary responses of each individual patient were classified by visual judgment of the disease course (using scatterplots). The overall response was calculated by subtracting the last measurement during ERT from that at the start of ERT.

References

    1. van der Ploeg AT, Reuser AJ. Pompe's disease. Lancet 2008;372:1342–1353. - PubMed
    1. Reuser AJJ, Hirschhorn R, Kroos MA. Pompe disease: glycogen storage disease type II, acid α-glucosidase (acid maltase) deficiency. In: Valle D, Beaudet AL, Vogelstein B, et al., editors. The Online Metabolic and Molecular Bases of Inherited Disease. New York: McGraw-Hill; 2018;part 16, chapter 135.
    1. van der Beek NA, de Vries JM, Hagemans ML, et al. . Clinical features and predictors for disease natural progression in adults with Pompe disease: a nationwide prospective observational study. Orphanet J Rare Dis 2012;7:88. - PMC - PubMed
    1. van der Beek NA, Hagemans ML, Reuser AJ, et al. . Rate of disease progression during long-term follow-up of patients with late-onset Pompe disease. Neuromuscul Disord 2009;19:113–117. - PubMed
    1. Anderson LJ, Henley W, Wyatt KM, et al. . Effectiveness of enzyme replacement therapy in adults with late-onset Pompe disease: results from the NCS-LSD cohort study. J Inherit Metab Dis 2014;37:945–952. - PubMed

Publication types

MeSH terms