. 2019 Oct 29;116(44):22173-22178.
doi: 10.1073/pnas.1906592116. Epub 2019 Oct 16.

Proteostasis collapse is a driver of cell aging and death

Affiliations

Proteostasis collapse is a driver of cell aging and death

Mantu Santra et al. Proc Natl Acad Sci U S A. .

Abstract

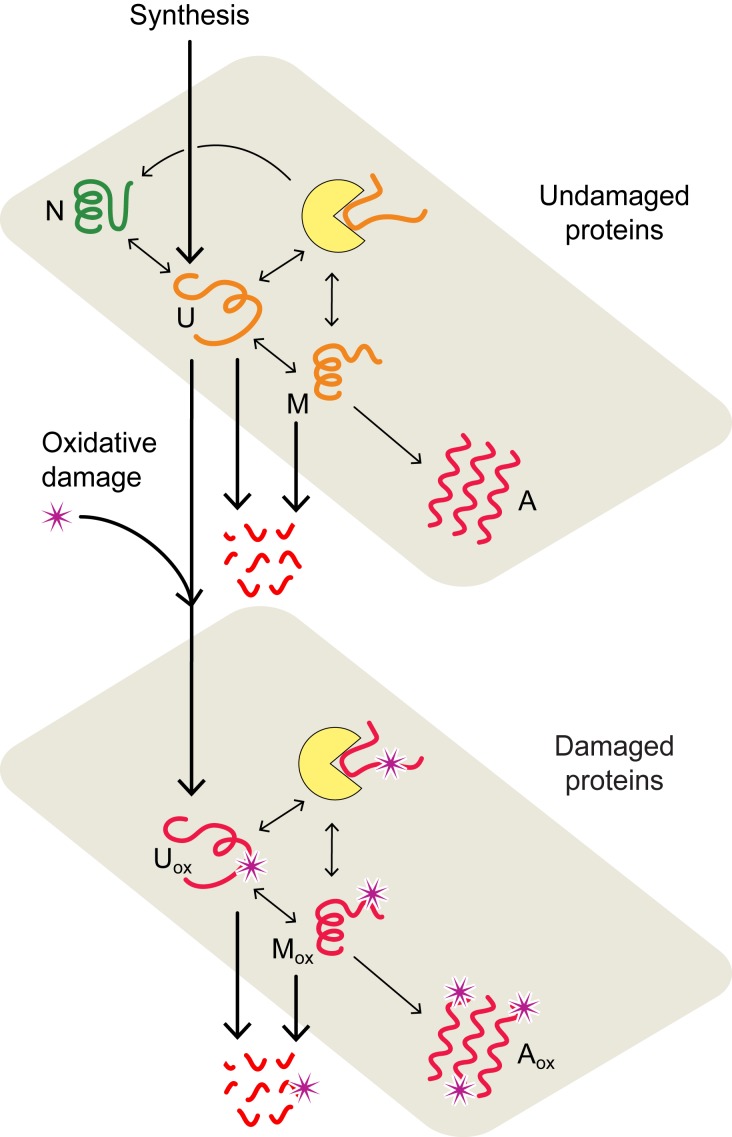
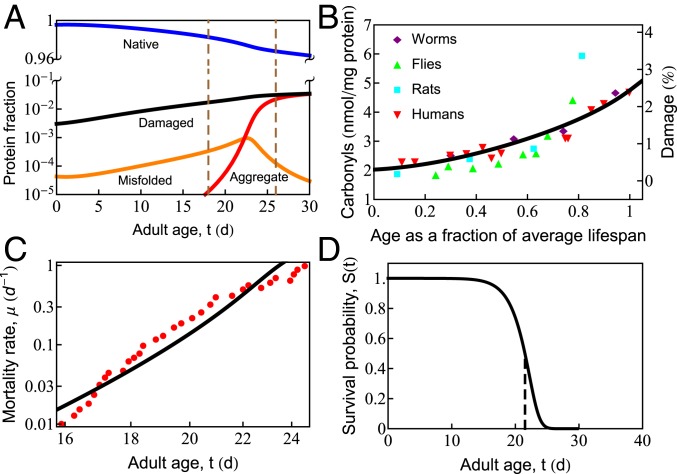
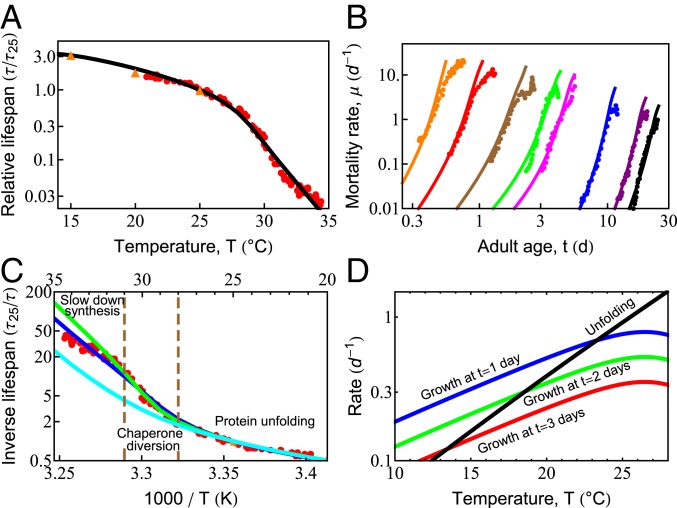
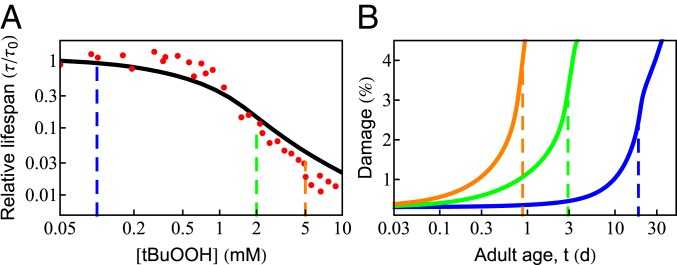
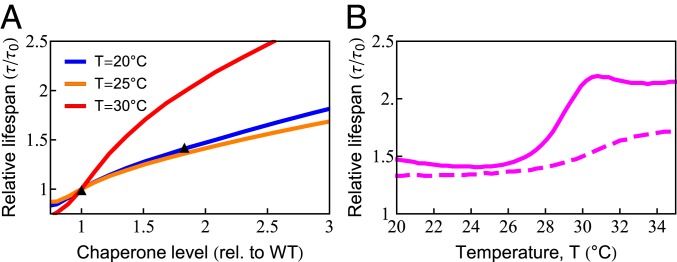
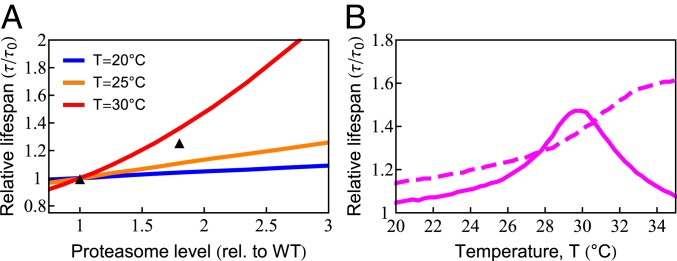
What molecular processes drive cell aging and death? Here, we model how proteostasis-i.e., the folding, chaperoning, and maintenance of protein function-collapses with age from slowed translation and cumulative oxidative damage. Irreparably damaged proteins accumulate with age, increasingly distracting the chaperones from folding the healthy proteins the cell needs. The tipping point to death occurs when replenishing good proteins no longer keeps up with depletion from misfolding, aggregation, and damage. The model agrees with experiments in the worm Caenorhabditis elegans that show the following: Life span shortens nonlinearly with increased temperature or added oxidant concentration, and life span increases in mutants having more chaperones or proteasomes. It predicts observed increases in cellular oxidative damage with age and provides a mechanism for the Gompertz-like rise in mortality observed in humans and other organisms. Overall, the model shows how the instability of proteins sets the rate at which damage accumulates with age and upends a cell's normal proteostasis balance.

Keywords: aging; chaperones; misfolding; oxidative damage; proteostasis.


Conflict of interest statement

The authors declare no competing interest.

Figures

Fig. 1.
Fig. 1.
Proteostasis model of cell aging. In the model, proteins convert between native (N), unfolded (U), misfolded (M), and aggregated (A) states (upper plane) with rates estimated from experimental data (33, 42). Chaperone-dependent folding of newly synthesized or thermally unfolded proteins compete with the processes of protein oxidation, aggregation, and degradation, collectively defining the quality of the proteome and proteostasis at a given age. The lower plane describes the interconversion of oxidatively damaged unfolded (Uox), misfolded (Mox), and aggregated (Aox) states. Chaperones are represented by yellow disks.
Fig. 2.
Fig. 2.
In cell aging, oxidative damage leads to increased misfolding and aggregation, which eventually causes cell death. (A) The age-dependent slowing of synthesis and degradation causes the accumulation of damaged (black line), misfolded (orange line), and aggregated (red line) states and depletion of the native (blue line) state. Progressive cell aging causes proteostasis to transition through 2 phases: 1) the progressive titration of chaperones by damaged proteins, causing the accumulation of misfolded protein, followed by 2) misfolded proteins crossing their solubility threshold, triggering late-life aggregation (the region inside the vertical dashed lines). (B) The gradual increase of protein damage with age in different organisms, as measured by carbonyl content. The black line indicates the percentage of damaged protein predicted by the current model. (C) Age-dependent mortality rate data at T = 20.1 C (red symbols). The black line is the theoretical fit to the data. (D) Predicted survival curve in wild-type Caenorhabditis elegans at T = 20 C. The vertical dashed line shows the point of 50% survival and is taken as the average life span of the organism.
Fig. 3.
Fig. 3.
Temperature dependence of survival probability and life span is dictated by the fundamental properties of proteins. (A) Predicted decay of life span with increasing temperature (black line), compared with experimental data from Stroustrup et al. (61) (red circles) and Van Voorhies and Ward (51) (orange triangles). (B) Predicted rates of mortality at different temperatures (solid lines) compared with experimental data from Stroustrup et al. (61) (symbols). The temperatures are, from black to orange, 20 ○C (20.1 ○C), 22.1 ○C (23.7 ○C), 25.5 ○C (25.2 ○C), 28.3 ○C (29.1 ○C), 28.9 ○C (30 ○C), 30 ○C (30.9 ○C), 31.3 ○C (31.3 ○C), and 32.4 ○C (32.5 ○C); the values in the brackets are those reported in Stroustrup et al. (61). (C) The inverse life span as a function of inverse absolute temperature shows distinct regions in which different processes dominate life-span behavior. The blue line represents the prediction of the current model. The green line is the prediction in the absence of the slowed growth rate observed experimentally at high temperatures (SI Appendix, Fig. S2, orange line). The cyan curve represents the prediction if damaged proteins are not allowed to bind and effectively deplete chaperones. (D) With increasing temperature, the average unfolding rate of proteins (black line) increases faster than enzymatic processes like protein synthesis, shown at 1, 2, and 3 d of adulthood (blue, green, and red lines, respectively).
Fig. 4.
Fig. 4.
Effect of oxidative damage on survival probability and life span. (A) The predicted dependence of life span on the concentration of external oxidant, tBuOOH (black solid line), compared with experimental data [red circles; Stroustrup et al. (61)]. Beyond a critical concentration (0.5 mM), life span drops sharply in an approximately power-law fashion. (B) The age-dependent rise in protein damage is shown for 3 concentrations of tBuOOH (indicated by vertical dashed lines in A). The vertical dashed lines in B indicate the average life span.
Fig. 5.
Fig. 5.
Increased chaperone capacity extends life span. (A) Chaperone dependence of relative (rel.) life span (τ/τo, where τo is the life span with wild-type [WT] chaperone level) at T = 20 C (blue line), T = 25 C (orange line), and T=30C (red line). The predicted increase of life span (orange line) quantitatively captures the experimentally observed life span extension at T=25C (black triangles) (77). (B) The temperature dependence of life-span extension due to a 2-fold increase in chaperone level with (solid line) and without (dashed line) the ability of chaperones to bind, and thus be titrated by, damaged protein.
Fig. 6.
Fig. 6.
Increased degradation capacity extends life span. (A) Increasing degradation capacity is predicted to increase life span at different temperatures. The black symbols are experimental data at T=20C. (83). rel., relative; WT, wild type. (B) The benefit of increased degradation capacity depends highly on temperature (solid line). The dashed line is the model prediction in the absence of chaperone diversion.

References

    1. Lopez-Otin C., Blasco M., Partridge L., Serrano M., Kroemer G., The hallmarks of aging. Cell 153, 1194–1217 (2013). - PMC - PubMed
    1. Kirkwood T., Understanding the odd science of aging. Cell 120, 437–447 (2005). - PubMed
    1. Kowald A., Kirkwood T., A network theory of ageing: The interactions of defective mitochondria, aberrant proteins, free radicals and scavengers in the ageing process. Mutat. Res. 316, 209–236 (1996). - PubMed
    1. Soti C., Csermely P., Aging and molecular chaperones. Exp. Gerontol. 38, 1037–1040 (2003). - PubMed
    1. McAuley J., Taylor R., Simonds A., Chawda S., Respiratory difficulty with palatal, laryngeal and respiratory muscle tremor in adult-onset Alexander’s disease. BMJ Case Rep., 10.1136/bcr-2016-218484 (2017). - DOI - PMC - PubMed

Publication types

Substances