. 2019 Oct 17;4(20):e131340.
doi: 10.1172/jci.insight.131340.

Alveolar macrophage secretion of vesicular SOCS3 represents a platform for lung cancer therapeutics

Affiliations

Alveolar macrophage secretion of vesicular SOCS3 represents a platform for lung cancer therapeutics

Jennifer M Speth et al. JCI Insight. .

Abstract

Lung cancer remains the leading cause of cancer-related death in the United States. Although the alveolar macrophage (AM) comprises the major resident immune cell in the lung, few studies have investigated its role in lung cancer development. We recently discovered a potentially novel mechanism wherein AMs regulate STAT-induced inflammatory responses in neighboring epithelial cells (ECs) via secretion and delivery of suppressors of cytokine signaling 3 (SOCS3) within extracellular vesicles (EVs). Here, we explored the impact of SOCS3 transfer on EC tumorigenesis and the integrity of AM SOCS3 secretion during development of lung cancer. AM-derived EVs containing SOCS3 inhibited STAT3 activation as well as proliferation and survival of lung adenocarcinoma cells. Levels of secreted SOCS3 were diminished in lungs of patients with non-small cell lung cancer and in a mouse model of lung cancer, and the impaired ability of murine AMs to secrete SOCS3 within EVs preceded the development of lung tumors. Loss of this homeostatic brake on tumorigenesis prompted our effort to "rescue" it. Provision of recombinant SOCS3 loaded within synthetic liposomes inhibited proliferation and survival of lung adenocarcinoma cells in vitro as well as malignant transformation of normal ECs. Intratumoral injection of SOCS3 liposomes attenuated tumor growth in a lung cancer xenograft model. This work identifies AM-derived vesicular SOCS3 as an endogenous antitumor mechanism that is disrupted within the tumor microenvironment and whose rescue by synthetic liposomes can be leveraged as a potential therapeutic strategy for lung cancer.

Keywords: Cancer; Immunology; Macrophages; Oncology; Tumor suppressors.


Conflict of interest statement

Conflict of interest: US Patent application 16/071,290 describing these liposomes was filed on July 19, 2018, byMPG; liposomes are referring to “synthetic liposomes encapsulating recombinant SOCS3.”

Figures

Figure 1
Figure 1. AM-derived EVs inhibit tumor cell function.
(A) Normal AECs (L2) or A549 adenocarcinoma cells were incubated with either medium alone (control, C) or PKH26-labeled AM-derived EVs for 1 hour (h); EV uptake was determined by flow cytometry and expressed as mean fluorescence intensity (MFI) (n = 3 separate experiments). (B and C) Cells were pretreated with EVs for 2 h, washed, and stimulated with 10 ng/ml IL-6 for 30 minutes, and lysates were analyzed for pSTAT3 and total STAT3 by WB (n = 3 separate experiments). A representative WB (B) and densitometric analysis of multiple such experiments, represented as relative pSTAT3 protein (C), are shown. (D) A549 cells were incubated with AM EVs for 72 h and subjected to CyQuant cell proliferation assay measuring total cellular DNA (n = 3 separate experiments). (E) A549 cells were treated with FasL (as a positive control) or AM EVs for 24 h, and apoptotic cells were determined by annexin V+ staining via flow cytometry (n = 3–5 replicates). (F) A549 cells were treated with AM EVs or FasL for 72 h, with or without the pan-caspase inhibitor Z-VAD-FMK (Z), and cell proliferation was determined using CyQuant assay (n = 6–14 replicates from 3 separate experiments). Student’s 2-tailed t test was used for comparison of 2 groups (C and D) or 1-way ANOVA with Bonferroni’s post hoc analysis was used for multiple comparisons (E and F); *P < 0.05.
Figure 2
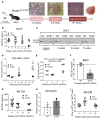
Figure 2. Secreted SOCS3 is reduced in the lungs of NSCLC patients.
(A) Schematic depiction of BALF processing for SOCS3 ELISA. (B) Levels of secreted SOCS3 in patient BALF. Data points represent individual patients; horizontal bars represent mean values (n = 12-22 patients). Two groups are still significantly different even if 3 normal subjects with highest SOCS3 levels are excluded. Students 2-tailed t test was used for comparison of 2 groups; *P < 0.05.
Figure 3
Figure 3. AM packaging of SOCS3 into EVs is reduced in the lungs of Kras mutant mice.
(A) Experimental scheme: WT and LSL-KrasG12D mice were inoculated oropharyngeally with adenoviral Cre recombinase on day 0. BALF was harvested at 4, 8, 12, and 16 weeks after tumor initiation and analyzed for secreted SOCS3 as well as cell counts; alternatively, AMs were purified by adherence for analysis of their CM. Representative histopathologic lesions from mice harvested at the indicated time points are shown. AAH, atypical adenomatous hyperplasia. (B) SOCS3 concentrations as determined by ELISA in BALF harvested at indicated time points from WT and G12D mice (n = 3–7 mice per group; each symbol represents a value from an individual mouse). (C) Representative WB for SOCS3 of BALF samples collected from WT and Kras mutant mice at 4, 8, 12, and 16 weeks after tumor initiation. Each lane represents a sample from an individual mouse (n = 2 mice). Lanes on either side of the dashed line were from the same blot but were noncontiguous. (D) Numbers of total lavageable cells in the BALF of WT and Kras mutant mice at varying times after tumor initiation (n = 3 mice). (E) Numbers of resident AMs (defined as CD11c+CD11bSiglec-F+ cells) in the BALF of WT and Kras mutant mice at various times after tumor initiation (n = 2 groups of cells pooled from 2 individual mice). (F) At 10 weeks after tumor initiation with SPC (alveolar EC targeted) specific adenoviral Cre recombinase, BALF was harvested and analyzed for SOCS3 by ELISA (n = 3–4 mice per group). (G) Concentration of SOCS3 in CM of AMs isolated from WT and Kras mutant mice at the indicated times after tumor initiation. Cells isolated from the BALF of individual mice of each strain (4 mice per group) were pooled and then divided into triplicate samples. Cells were plated at a concentration of 1 × 10⁶ cells/ml for ~20 h. The resulting CM was sonicated and analyzed for SOCS3 by ELISA; data are mean of 3–4 samples. (H) Relative SOCS3 protein levels determined by WB of lysates of AMs obtained at 16 weeks after tumor initiation; note that these are from the same cell cultures whose CM was utilized for ELISA determination in G (n = 3). (I) EV numbers determined in AM CM via flow cytometric analysis and expressed as EV number per 1 × 10⁶ AMs; data are mean of triplicate samples. Student’s 2-tailed t test was used for comparison of 2 groups (F and H), or 1-way ANOVA with Bonferroni’s post hoc analysis was used for multiple comparisons (B, D, E, G, and I); *P < 0.05.
Figure 4
Figure 4. Generation of and characterization of recombinant SOCS3–containing liposomes.
(A) Schematic of liposome generation. (B) Histogram: Size distribution of both empty and SOCS3-containing liposomes from 1 representative liposome preparation. (C) Representative WB comparing relative SOCS3 protein amounts in EVs isolated from 1 × 10⁶ AMs vs. serial dilutions of synthetic SOCS3-containing liposomes. (D) A549 cells were pretreated with liposomes containing 10 ng of SOCS3 protein, or an equal volume of empty liposomes containing only PBS, for 1 h. They were then washed and stimulated with 10 ng/ml IL-6 for 30 minutes, and lysates were probed for pSTAT3. Top: Representative WB; bottom: mean densitometric analysis of 3 separate experiments, represented as relative pSTAT3 protein. Dashed line denotes noncontiguous lanes from the same blot. pSTAT3 and total STAT3 were from separate gels/blots. Student’s 2-tailed t test was used for comparison of 2 groups; *P < 0.05.
Figure 5
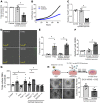
Figure 5. SOCS3 liposomes inhibit lung tumor cell function and epithelial cell transformation.
(A) A549 cells were incubated with liposomes containing 10 ng SOCS3 or an equal volume of liposomes containing PBS alone (empty) for 72 h and analyzed by CyQuant cell proliferation assay measuring total cellular DNA (n = 3 separate experiments). (B) One thousand A549 cells were plated per well of a 96-well tissue culture plate and were incubated with empty or SOCS3 liposomes for 72 h. Cellular confluence was measured using an IncuCyte Live Cell Analysis system. Data points represent the mean of quadruplicate measurements of confluency, expressed as AU per well, and are representative of triplicate wells per condition. (C) A549 cells were treated with empty or SOCS3 liposomes for 24 h and analyzed for FoxM1 mRNA expression by qPCR (n = 3 separate experiments). (D) Representative micrographs of caspase-3/7–positive cells after liposome treatment. Concurrent with the confluence assay in B, A549 cells were incubated with IncuCyte caspase-3/7 apoptosis assay reagent and empty or SOCS3 liposomes. Fluorescence micrographs are representative of 3 triplicate wells per treatment. Scale bar: 100 μm. (E) A549 cells were treated with empty or SOCS3 liposomes or FasL (as a positive control) for 24 h, and annexin V+ cells determined via flow cytometry (n = 4–5 replicate samples). (F) A549 cells were treated with empty or SOCS3 liposomes for 24 h and analyzed for relative FasR mRNA expression by qPCR (n = 4 separate experiments). (G) A549 cells were treated with FasL, empty liposomes, or SOCS3 liposomes for 24 h, with or without the pan-caspase inhibitor Z-VAD-FMK (Z), and cell proliferation was determined by CyQuant assay (n = 5–14 replicates from 3 separate experiments). (H) Top: Schematic depiction of CSE transformation protocol for WT or G12V-RLE cells. A total of 0.5 × 10⁶ RLE-6TN cells were incubated with either WT or G12V retrovirus for 24 h. Cells were washed and selected with puromycin for an additional 48–72 h. Surviving cells were passaged an additional 2 times before use in experiments. For CSE transformation, cells were plated at a concentration of 10,000 cells/well of a 6-well tissue culture dish and treated with 3% CSE, along with empty or SOCS3 liposomes, for 1 h daily for 7 consecutive days. They were then cultured in equal numbers in a soft agar colony assay for an additional 7 days before colonies were enumerated. Bottom left: Representative micrographs of CSE-treated WT or G12V RLEs within a soft agar colony assay. Photographs were taken at 40× magnification. Scale bar: 1000 μm. Bottom right: Data represents mean colony counts from 7 separate 40× fields per treatment from 3 separate experiments. Student’s 2-tailed t test was used for comparison of 2 groups (A, C, F, and H), or 1-way ANOVA with Bonferroni’s post hoc analysis was used for multiple comparisons (E and G); *P < 0.05 or #P < 0.05 represents comparison to control or empty liposomes, respectively.
Figure 6
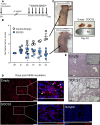
Figure 6. Intratumoral administration of SOCS3 liposomes inhibits tumor growth in nude mice.
(A) Experimental scheme: 1 × 10⁶ A549 cells were injected s.c. in athymic nude mice at day 0. After palpable tumors were observed at ~28 days, mice were randomized into 2 groups and treated s.c. with liposomes containing 10 ng SOCS3 or an equal volume of liposomes containing PBS (at 2 sites per tumor) in 50 µl PBS approximately every other day for a total of 6 treatments. Tumor measurements were taken 2 days prior to the first liposome injection and on every subsequent injection day. (B) Mean tumor volumes from empty and SOCS3 treated mice (n = 4–7 mice per group). (C) Images of representative whole tumors from mice treated with empty and SOCS3 liposomes. (D) Representative images of isotype, pSTAT3 and DAPI labeled tumors sections. Solid arrows represent nuclear-associated pSTAT3; open arrowheads represent cytoplasmic-associated pSTAT3. (E) Representative H&E-stained tumors from A549 tumor–bearing mice treated with empty and SOCS3 liposomes. One-way ANOVA with Bonferroni’s post hoc analysis was used for multiple comparisons.

References

    1. Ferrara R, et al. Hyperprogressive Disease in Patients With Advanced Non-Small Cell Lung Cancer Treated With PD-1/PD-L1 Inhibitors or With Single-Agent Chemotherapy. JAMA Oncol. 2018;4(11):1543–1552. doi: 10.1001/jamaoncol.2018.3676. - DOI - PMC - PubMed
    1. Karamouzis MV, Konstantinopoulos PA, Papavassiliou AG. The role of STATs in lung carcinogenesis: an emerging target for novel therapeutics. J Mol Med. 2007;85(5):427–436. doi: 10.1007/s00109-006-0152-3. - DOI - PubMed
    1. Li Y, Du H, Qin Y, Roberts J, Cummings OW, Yan C. Activation of the signal transducers and activators of the transcription 3 pathway in alveolar epithelial cells induces inflammation and adenocarcinomas in mouse lung. Cancer Res. 2007;67(18):8494–8503. doi: 10.1158/0008-5472.CAN-07-0647. - DOI - PubMed
    1. Qu P, et al. Stat3 downstream genes serve as biomarkers in human lung carcinomas and chronic obstructive pulmonary disease. Lung Cancer. 2009;63(3):341–347. doi: 10.1016/j.lungcan.2008.05.025. - DOI - PMC - PubMed
    1. Chikuma S, Kanamori M, Mise-Omata S, Yoshimura A. Suppressors of cytokine signaling: Potential immune checkpoint molecules for cancer immunotherapy. Cancer Sci. 2017;108(4):574–580. doi: 10.1111/cas.13194. - DOI - PMC - PubMed

Publication types

MeSH terms