. 2019 Oct 17;4(20):e129240.
doi: 10.1172/jci.insight.129240.

Brain pharmacology of intrathecal antisense oligonucleotides revealed through multimodal imaging

Affiliations

Brain pharmacology of intrathecal antisense oligonucleotides revealed through multimodal imaging

Curt Mazur et al. JCI Insight. .

Abstract

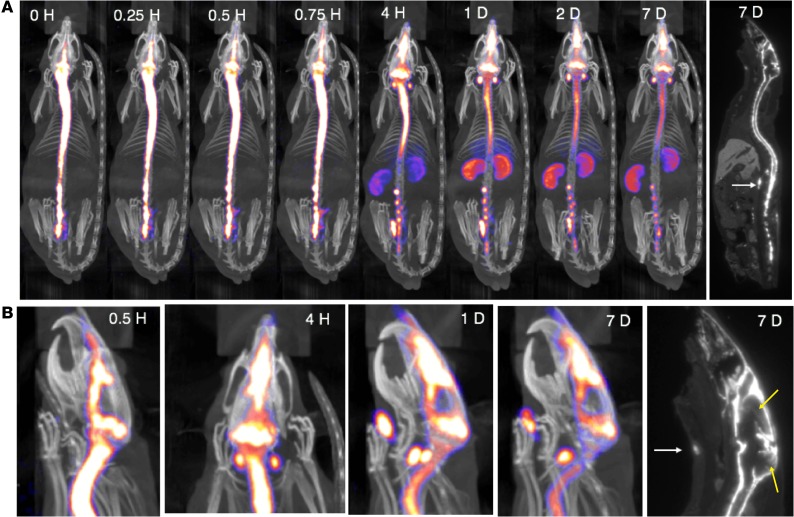
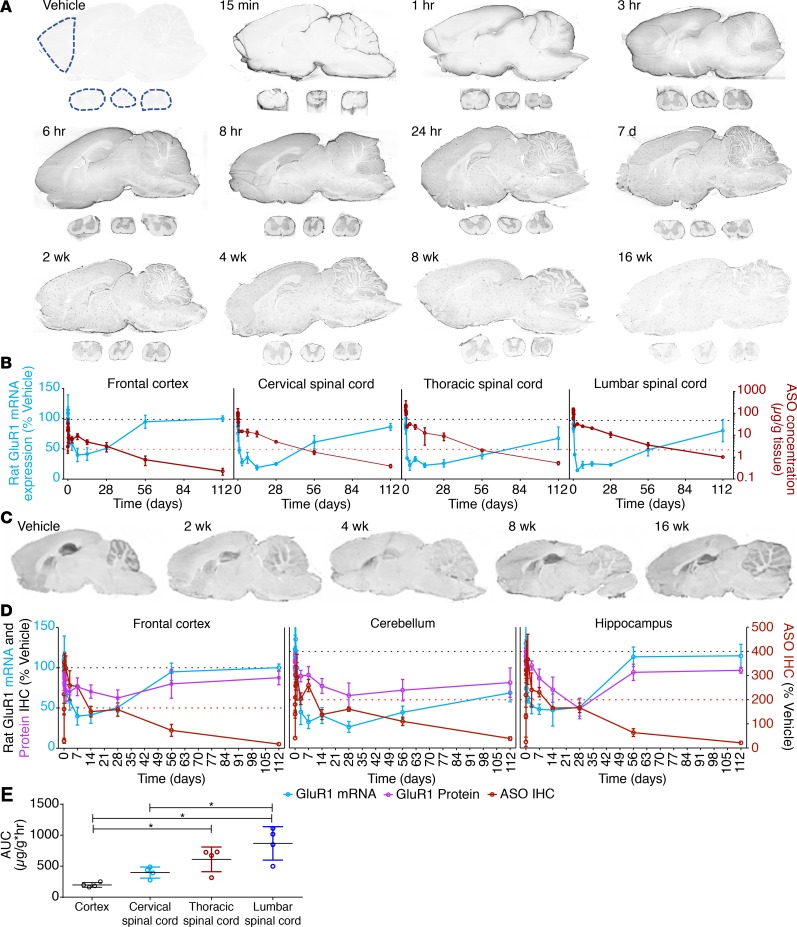
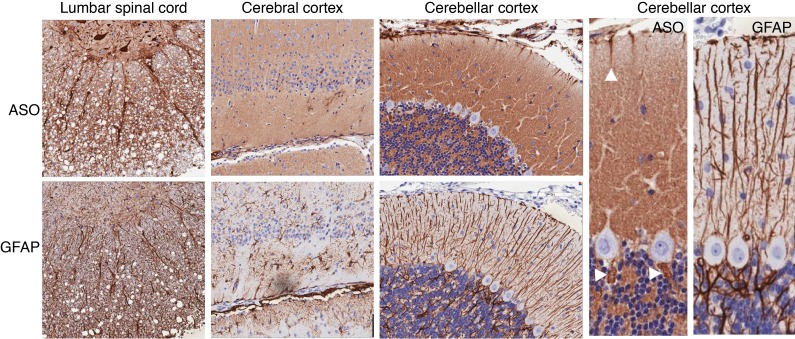
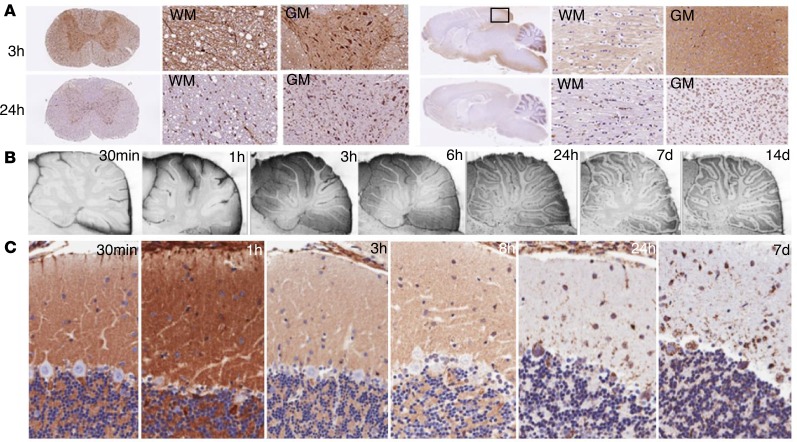
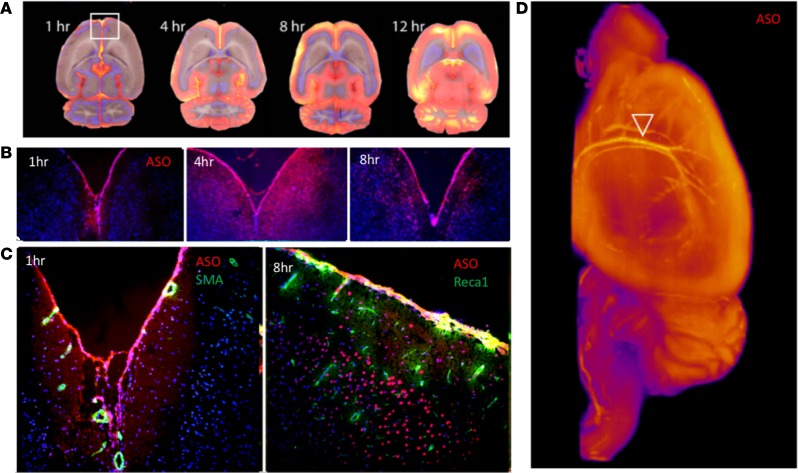
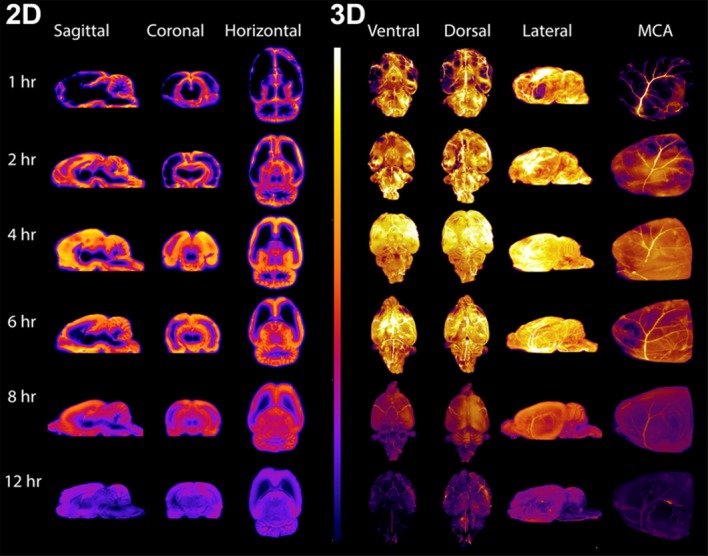
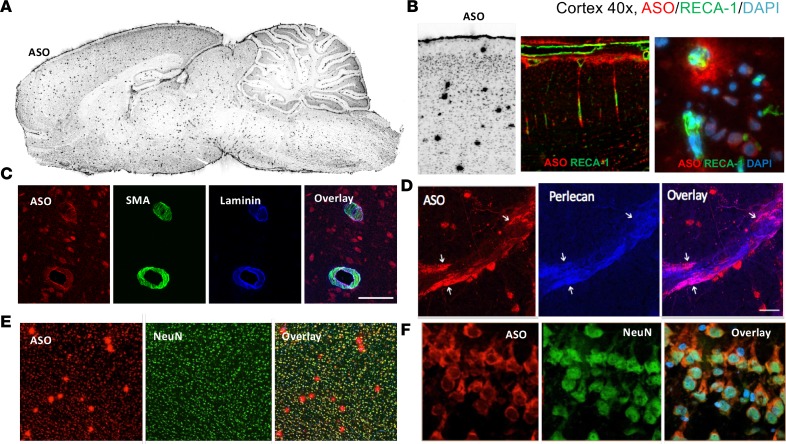
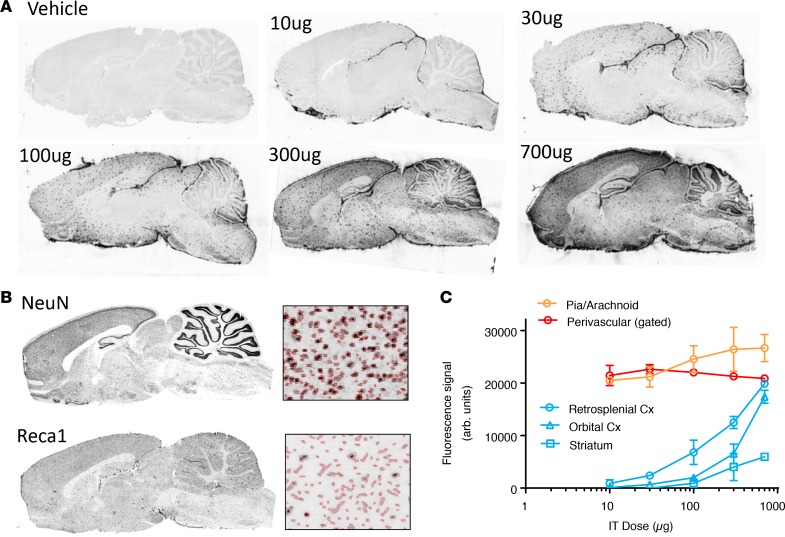
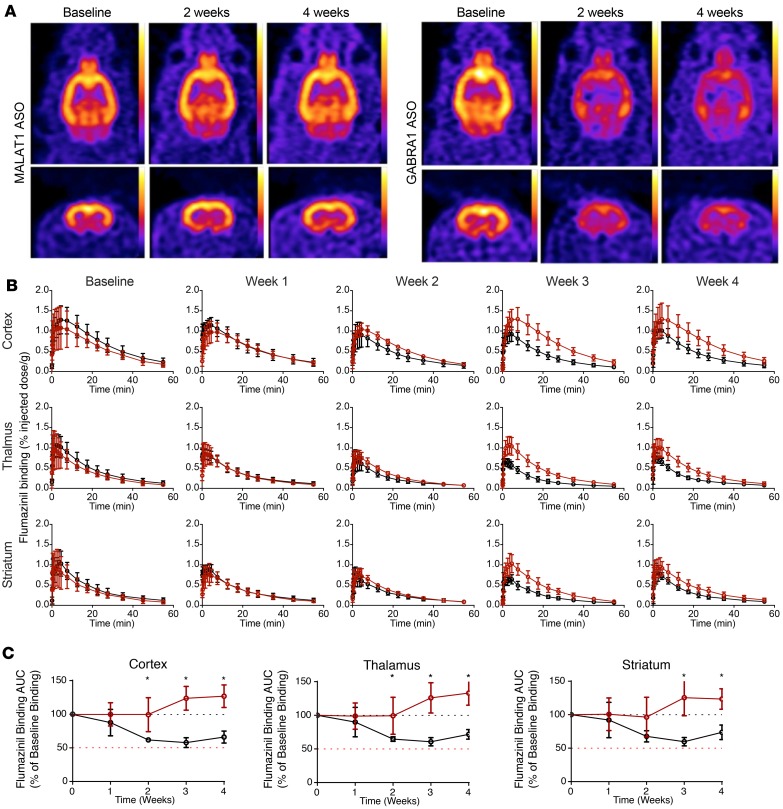
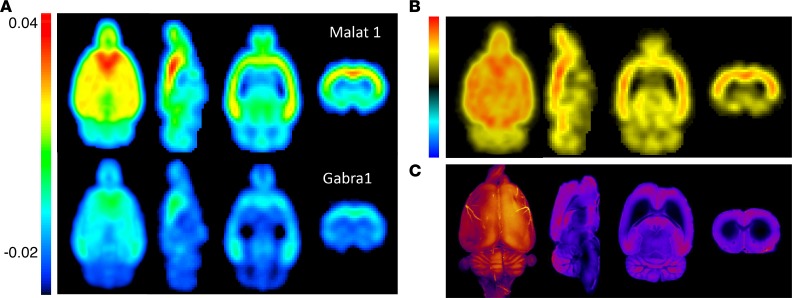
Intrathecal (IT) delivery and pharmacology of antisense oligonucleotides (ASOs) for the CNS have been successfully developed to treat spinal muscular atrophy. However, ASO pharmacokinetic (PK) and pharmacodynamic (PD) properties remain poorly understood in the IT compartment. We applied multimodal imaging techniques to elucidate the IT PK and PD of unlabeled, radioactively labeled, or fluorescently labeled ASOs targeting ubiquitously expressed or neuron-specific RNAs. Following lumbar IT bolus injection in rats, all ASOs spread rostrally along the neuraxis, adhered to meninges, and were partially cleared to peripheral lymph nodes and kidneys. Rapid association with the pia and arterial walls preceded passage of ASOs across the glia limitans, along arterial intramural basement membranes, and along white-matter axonal bundles. Several neuronal and glial cell types accumulated ASOs over time, with evidence of probable glial accumulation preceding neuronal uptake. IT doses of anti-GluR1 and anti-Gabra1 ASOs markedly reduced the mRNA and protein levels of their respective neurotransmitter receptor protein targets by 2 weeks and anti-Gabra1 ASOs also reduced binding of the GABAA receptor PET ligand 18F-flumazenil in the brain over 4 weeks. Our multimodal imaging approaches elucidate multiple transport routes underlying the CNS distribution, clearance, and efficacy of IT-dosed ASOs.

Keywords: Neuroimaging; Neuroscience; Pharmacology.


Conflict of interest statement

Conflict of interest: CM, BP, JM, FK, MO, HK, and EES are employees of and stock holders in Ionis Pharmaceuticals, Inc. JH is a cofounder and managing partner of Invicro, LLC as well as an equity shareholder. KZ, HD, MS, JMS, RWH, MQ, IP, RC, VG, and CMG were employees of Invicro, LLC when the studies were performed. JMS is currently an employee of Biogen Inc. NJA, LK, and ROC are employees of the University of Southampton. MB is an employee of 3D Imaging, and AV was an employee of Biogen Inc. at the time that this work was performed.

Figures

Figure 1
Figure 1. SPECT/CT live imaging of IT-dosed ASO.
125I-Malat1 ASO was given as an IT bolus (~180 μg; 230.7 ± 42.6 μCi) in male Sprague-Dawley Rats (n = 5, 270.8 ± 30.6 g). (A) Representative whole-body SPECT/CT and autoradiogram (far right) performed at indicated times after dosing. (B) Head and neck close-up of SPECT/CT images showing egress to nasal turbinates and lymph nodes (white arrows). Head and neck closeup of autoradiogram (far right) shows parenchymal radioactive signal in cerebral cortex and cerebellum (yellow arrows). This is imaging from 1 representative animal from a group of 4 that were imaged in this experiment.
Figure 2
Figure 2. Ex vivo PK and PD effects of IT-dosed ASOs on brain neurotransmitter receptor mRNA and protein expression.
(A) IHC of GluR1 ASO uptake by brain and spinal cord at various times after dosing (0.7 mg IT bolus) from animals representative of the groups of 4 at each time point. (B) Regional GluR1 ASO PK and PD effect on GluR1 mRNA knockdown via PCR graphed versus time after dosing (in days). Dashed lines in A indicate regions used for analysis. (C) IHC for GluR1 protein at various time after dosing from animals representative of the groups of 4 at each time point. (D) Regional relationship between GluR1 ASO IHC and GluR1 mRNA and protein levels as determined by IHC. (E) AUC analysis of ASO concentrations in frontal cortex, lumbar, thoracic, and cervical spinal cord samples versus time. All data are graphed as mean ± SD with n values of 4 for all groups. Analysis of differences between AUCs of the tissues was by 1-way ANOVA with Bennett’s post hoc test; *P < 0.05.
Figure 3
Figure 3. ASO colocalization with axonal and glial structures.
IHC performed for ASO and GFAP at 30 minutes after lumbar IT dosing of anti-GluR1 ASOs. From left to right, staining is shown associated with lumbar spinal cord axonal bundles, axon- and astrocyte-rich sub-pial tissue in cerebral cortex, and the Bergmann glia-rich layers of the cerebellar cortex. Arrowheads show early ASO signal that was observed in what appear to be Bergman glial cell bodies adjacent to Purkinje cells, as stained by GFAP IHC in adjacent sections Images in the left 3 columns are at ×20 magnification and the right 2 images have additional ×2 digital magnification.
Figure 4
Figure 4. Cellular uptake patterns of ASOs.
(A) Time-dependent ASO uptake patterns in white and gray matter (WM and GM) of the spinal cord and cerebral cortex. (B) Temporal ASO uptake into layers of the cerebellar cortex (×10 magnification). (C) Early diffuse staining in the cerebellar molecular layer up to 8 hours after dosing transformed to predominately intracellular staining pattern in Purkinje cells by 24 hours that persisted out to 7 days (×20 magnification).
Figure 5
Figure 5. Cryofluorescence tomography (CFT) of ASO permeation into brain tissue.
(A) Cy7-labeled Gabra1 ASOs (700 μg) were dosed IT, brains removed for CFT at various times after dosing, and photographed under white and fluorescent light after each 25-μm block-face section. (B) Trans-pia movement of Gabra1 Cy7-ASOs (×10 magnification). (C) Vascular association and cell uptake of Gabra1 Cy7-ASOs (×20 magnification). (D) Peri-arterial association of Cy7-ASO in 3D reconstruction of CFT data. Arrowhead points to basilar and middle cerebral arteries. Deeper vessels seen include the interhemispheric anterior cerebral artery.
Figure 6
Figure 6. 2D and 3D CFT display of IT-dosed Gabra1 Cy7-ASO brain penetration over time.
Left side shows sagittal, coronal, and horizontal virtual sections through the 3D-reconstructed CFT fluorescence images of animals euthanized 1, 2, 4, 6, 8, and 12 hours after IT dosing of Cy7-labeled Gabra1 ASOs (700 μg). Right side shows the surface images of the ventral, dorsal, and lateral aspects of the 3D-reconstructed CFT fluorescence images at the same time points. On the far right are images of the forebrain surface of the 3D-reconstructed CFT fluorescence images showing the fluorescently labeled ASO association with the left middle cerebral artery (MCA) at the different time points. For all images the fluorescence intensity was kept constant to evaluate the relative distribution of the ASO in the brain.
Figure 7
Figure 7. Perivascular and neuronal association of ASO 24 hours after dosing.
(A) Punctate perivascular staining of ASOs by IHC throughout brain at 24 hours after IT dosing. (B) Colocalization of ASOs and the vascular endothelial marker Reca1 in cerebral cortex (×10 magnification left 2 images, ×40 magnification right image). (C) Colocalization of Cy7-ASO with vascular α-smooth muscle actin (αSMA) and basement membrane component laminin α2 (×20 magnification). (D) Colocalization of ASOs with basement membrane component perlecan (×20 magnification). (E) ASO colocalization with neurons and vessels in cerebral cortex (×10 magnification). (F) ASO colocalization with neuronal cells in hippocampus (×40 magnification).
Figure 8
Figure 8. IT dose response of ASO interaction with vascular and neuronal elements.
(A) IHC of GluR1 ASO at 14 days following IT administration at different doses. (B) Neuronal (NeuN) versus vascular (Reca1) gaiting of ASO signal. (C) Differential dose response of ASO interaction with pia, perivascular space, and neuronal cells. Data in C are graphed as mean ± SD, with n values of 4 for each group. All histological images are of 12-μm-thick sections. Cx, cortex.
Figure 9
Figure 9. Live pharmacodynamic PET imaging of Gabra1 ASO–mediated receptor knockdown.
(A) 18F-flumazenil brain uptake in representative Malat1 ASO– or Gabra1 ASO–treated animals. Horizontal and coronal images. (B) 18F-flumazenil tissue concentration curves in Malat1 ASO (black) or Gabra1 ASO (red) groups at baseline or various time points after dosing. (C) AUC of 18F-flumazenil tissue concentration curves at each time point expressed as a percentage of baseline AUC for different brain regions. Malat1 ASO group is shown in red and Gabra1 ASO group is shown in black. Data are graphed as mean ± SD, with n values of 4 for each group. Analysis of differences between AUCs between groups and time points was by 2-way ANOVA with Bonferroni’s post hoc test; *P < 0.05.
Figure 10
Figure 10. Nuclear and fluorescence imaging maps of ASO PK and PD.
(A) Group-averaged AUC images of 18F-flumazenil PET data from Malat1 ASO– or Gabra1 ASO–treated animals (n = 6 each) at 4 weeks. (B) Map of 18F-flumazenil PET signal difference between Malat1 ASO– and Gabra1 ASO–treated animals at 4 weeks. (C) 3D and 2D CFT images of Gabra1 Cy7-ASO at 8 and 12 hours, respectively.

References

    1. Wurster CD, et al. Intrathecal administration of nusinersen in adolescent and adult SMA type 2 and 3 patients. J Neurol. 2019;266(1):183–194. doi: 10.1007/s00415-018-9124-0. - DOI - PubMed
    1. Finkel RS, et al. Treatment of infantile-onset spinal muscular atrophy with nusinersen: a phase 2, open-label, dose-escalation study. Lancet. 2016;388(10063):3017–3026. doi: 10.1016/S0140-6736(16)31408-8. - DOI - PubMed
    1. Southwell AL, Skotte NH, Bennett CF, Hayden MR. Antisense oligonucleotide therapeutics for inherited neurodegenerative diseases. Trends Mol Med. 2012;18(11):634–643. doi: 10.1016/j.molmed.2012.09.001. - DOI - PubMed
    1. DeVos SL, Miller TM. Antisense oligonucleotides: treating neurodegeneration at the level of RNA. Neurotherapeutics. 2013;10(3):486–497. doi: 10.1007/s13311-013-0194-5. - DOI - PMC - PubMed
    1. Zhao J, et al. Treatment of Epstein-Barr virus associated central nervous system diseases after allogeneic hematopoietic stem cell transplantation with intrathecal donor lymphocyte infusion. Bone Marrow Transplant. 2019;54(6):821–827. doi: 10.1038/s41409-018-0409-9. - DOI - PubMed

Publication types

MeSH terms