Case Reports
. 2019 Oct 17;4(20):e131355.
doi: 10.1172/jci.insight.131355.

STAT6/Arg1 promotes microglia/macrophage efferocytosis and inflammation resolution in stroke mice

Affiliations
Case Reports

STAT6/Arg1 promotes microglia/macrophage efferocytosis and inflammation resolution in stroke mice

Wei Cai et al. JCI Insight. .

Abstract

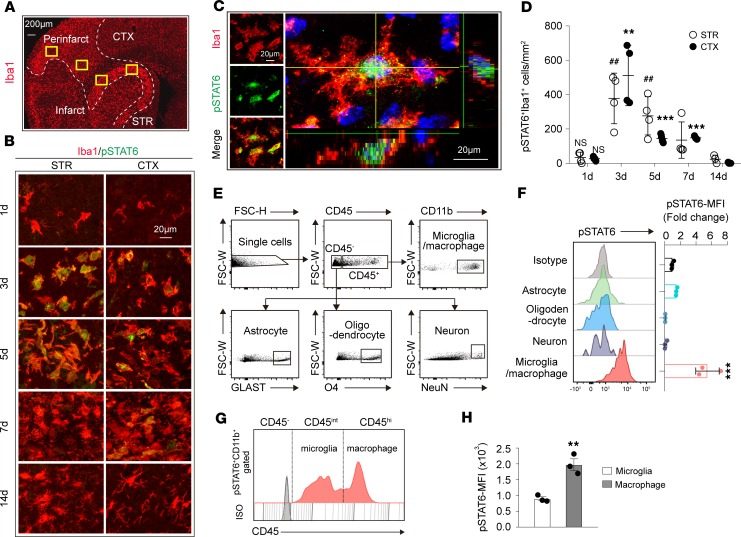
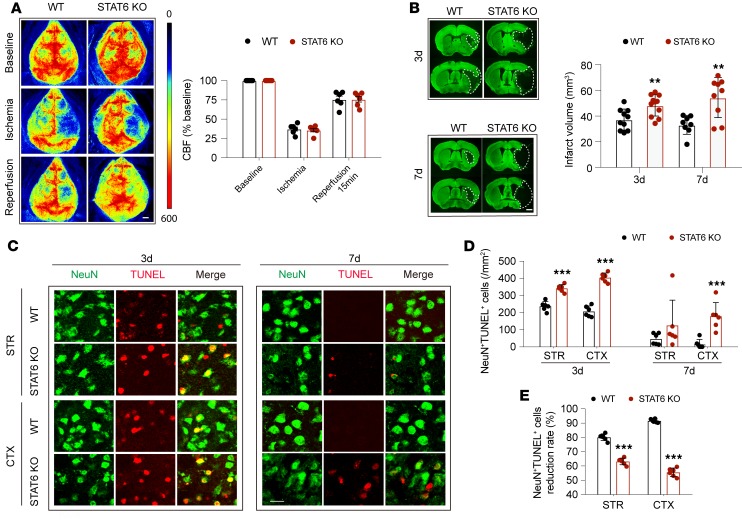
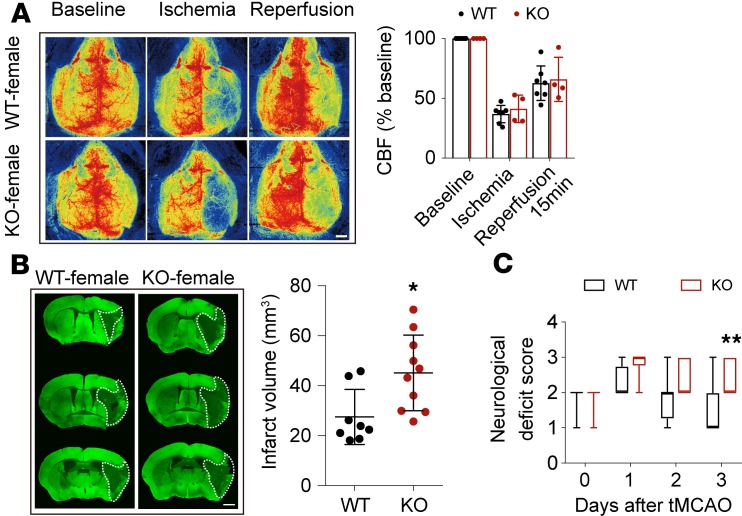
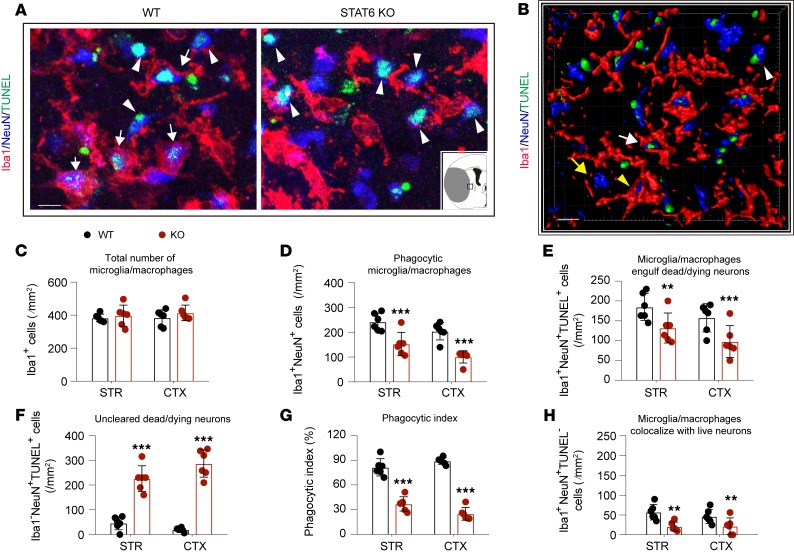
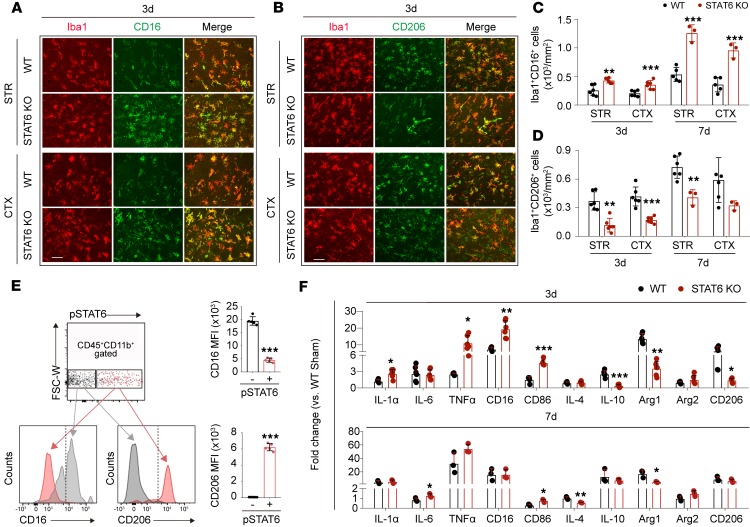
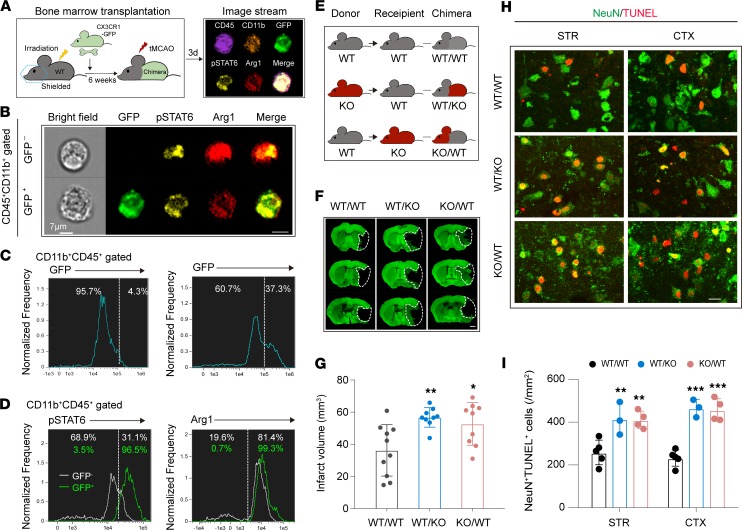
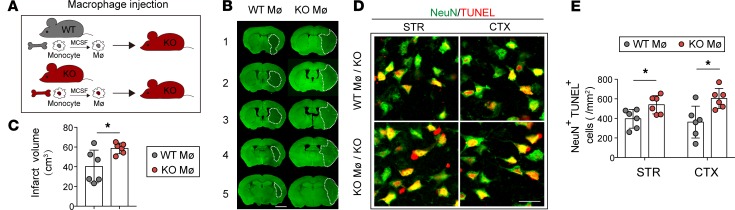
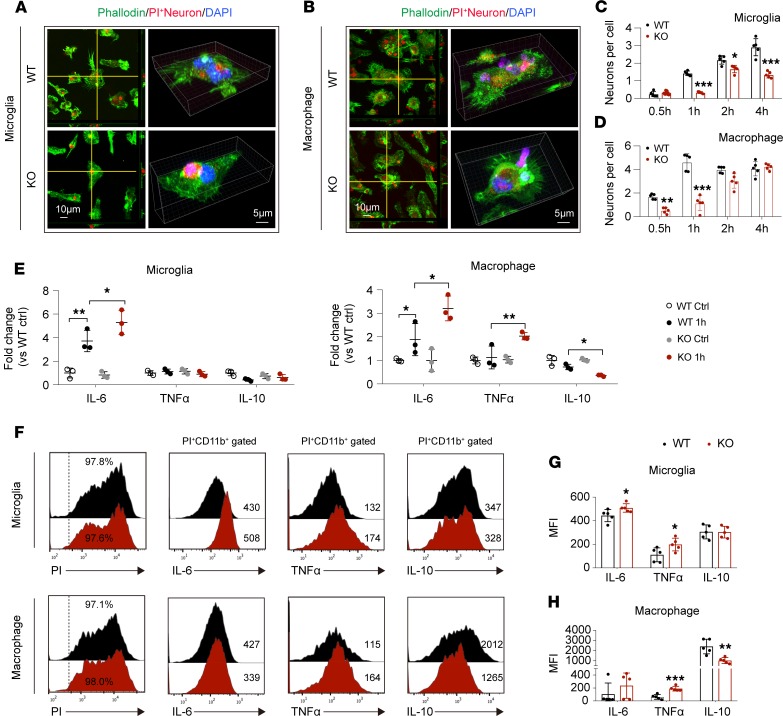
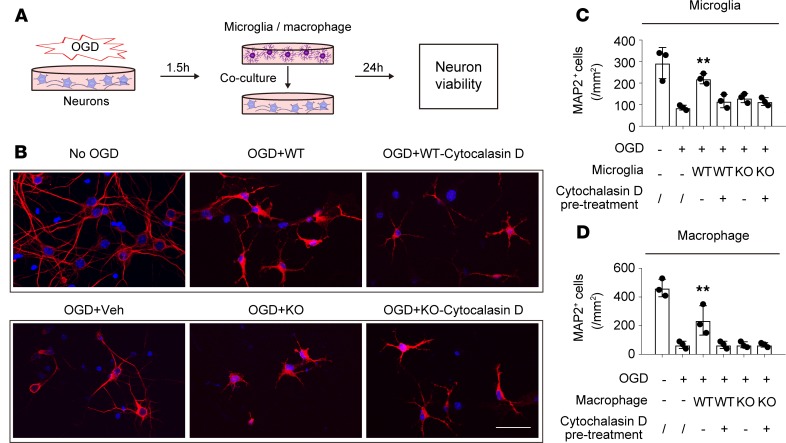
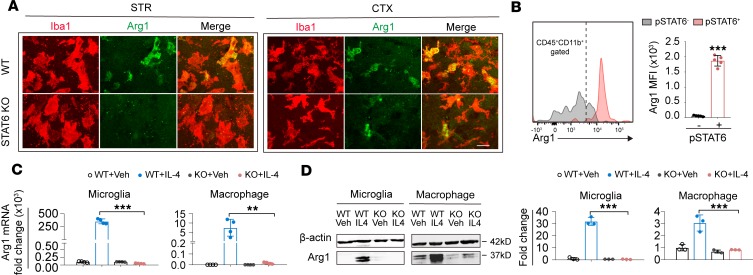
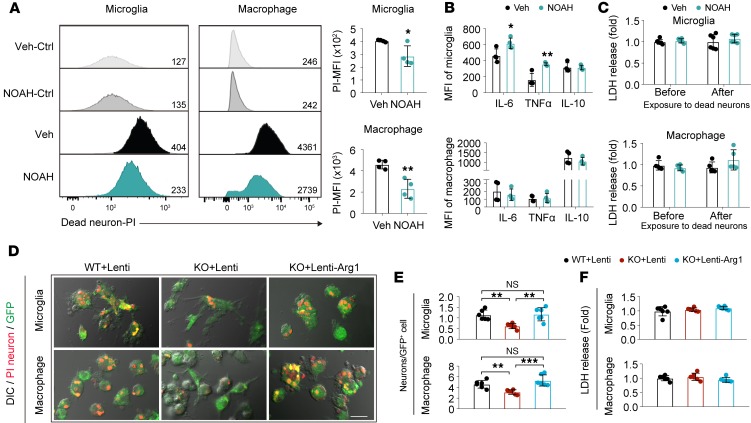
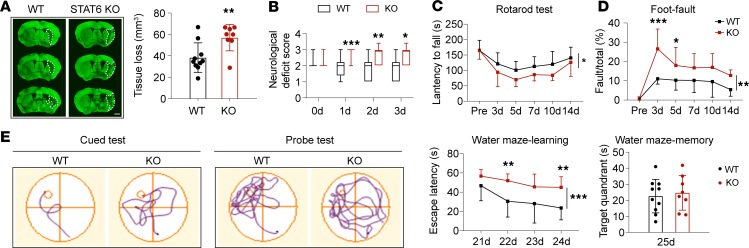
Efferocytosis, or phagocytic clearance of dead/dying cells by brain-resident microglia and/or infiltrating macrophages, is instrumental for inflammation resolution and restoration of brain homeostasis after stroke. Here, we identify the signal transducer and activator of transcription 6/arginase1 (STAT6/Arg1) signaling axis as a potentially novel mechanism that orchestrates microglia/macrophage responses in the ischemic brain. Activation of STAT6 was observed in microglia/macrophages in the ischemic territory in a mouse model of stroke and in stroke patients. STAT6 deficiency resulted in reduced clearance of dead/dying neurons, increased inflammatory gene signature in microglia/macrophages, and enlarged infarct volume early after experimental stroke. All of these pathological changes culminated in an increased brain tissue loss and exacerbated long-term functional deficits. Combined in vivo analyses using BM chimeras and in vitro experiments using microglia/macrophage-neuron cocultures confirmed that STAT6 activation in both microglia and macrophages was essential for neuroprotection. Adoptive transfer of WT macrophages into STAT6-KO mice reduced accumulation of dead neurons in the ischemic territory and ameliorated brain infarction. Furthermore, decreased expression of Arg1 in STAT6-/- microglia/macrophages was responsible for impairments in efferocytosis and loss of antiinflammatory modality. Our study suggests that efferocytosis via STAT6/Arg1 modulates microglia/macrophage phenotype, accelerates inflammation resolution, and improves stroke outcomes.

Keywords: Inflammation; Neuroscience; Stroke.


Conflict of interest statement

Conflict of interest: The authors have declared that no conflict of interest exists.

Figures

Figure 1
Figure 1. STAT6 is activated in microglia/macrophages after tMCAO.
(A) Representative image demonstrates the peri-infarct area defined by Iba1 staining. Two randomly selected microscopic fields in the cortex (CTX) and 2 in the striatum (STR) of each section were subjected for analysis. Scale bar: 200 μm. (B) Representative images of coronal brain sections showing the phosphorylation of STAT6 (green) in Iba1+ microglia/macrophages (red) at indicated time points after tMCAO. Scale bar: 20 μm. (C) Representative images of coronal brain slices collected 3d after tMCAO showing the nuclear (DAPI, blue) localization of pSTAT6 (green) in Iba1+ (red) microglia/macrophages. Scale bar: 20 μm. (D) Quantification of the number of pSTAT6+Iba1+ cells in the ischemic regions indicated in B at different time points after tMCAO. n = 3–4 mice per group. **P ≤ 0.01, ***P ≤ 0.001 vs. 1d in CTX. ##P ≤ 0.01 vs. 1d in STR, 1-way ANOVA. (E and F) Flow cytometric analysis of pSTAT6 in brain cells 3d after tMCAO. (E) Representative dot plots demonstrate the gating strategy for microglia/macrophages (CD45+CD11b+), astrocytes (CD45GLAST+), oligodendrocytes (CD45O4+), and neurons (CD45NeuN+). (F) Mean fluorescence intensity (MFI) of pSTAT6 in brain cells. n = 3 mice. ***P ≤ 0.01, Student’s t test. (G) Representative plot of STAT6 activation (pSTAT6) in microglia (CD45intermediate; CD45int) and macrophages (CD45hi) in pSTAT6+CD11b+ population. (H) STAT6 activation evaluation in microglia and macrophages by MFI of pSTAT6. n = 3 mice. **P ≤ 0.01, Student’s t test.
Figure 2
Figure 2. STAT6 deficiency exacerbates brain infarction and neuronal death after tMCAO.
Male WT and STAT6-KO mice were subjected to 60 minutes of tMCAO. (A) No difference in regional cerebral blood flow (CBF) between WT and STAT6-KO mice was detected. n = 6 mice per group. Scale bar: 1 mm. (B) Infarct volume at 3d (n = 10–11 mice per group) and 7d (n = 8–9 mice per group) after tMCAO was quantified in MAP2-stained (green) coronal sections. Dashed lines outline the infarct area. Scale bar: 1 mm. (C–E) Neuronal death increased in STAT6-KO brains 3d and 7d after tMCAO. (C) Representative images demonstrating TUNEL (red) colabeling with the neuronal marker NeuN (green) in infarct areas indicated in Figure 1A. Scale bar: 10 μm. (D) Quantification of NeuN+TUNEL+ neurons in cortex (CTX) and striatum (STR). (E) The reduction rate of dead/dying neurons from 3d–7d after tMCAO was calculated as described in Methods. n=6 mice per group. **P ≤ 0.01, ***P ≤ 0.001 STAT6-KO vs. WT, Student’s t test.
Figure 3
Figure 3. STAT6 deficiency exacerbates brain infarction in ovariectomized female mice after tMCAO.
(A) There was no difference in cerebral blood flow (CBF) between female WT and STAT6-KO mice. n = 7 for WT and n = 4 for STAT6-KO. (B) Infarct volume 3d after tMCAO was quantified on MAP2-stained (green) coronal sections. Dashed lines define the infarct area. n = 8 for WT and n = 10 for STAT6-KO. Scale bar: 1 mm. (C) Neurological deficit score was assessed during the first 3d after tMCAO. n = 8 for WT and n=10 for STAT6-KO. *P ≤ 0.05, **P ≤ 0.01 vs. WT, Student’s t test (A and B) or Mann-Whitney U test (C).
Figure 4
Figure 4. Capacity of dead/dying neuron clearance in microglia/macrophages was impaired in STAT6-KO mice.
WT and STAT6-KO mice were subjected to 60 minutes of tMCAO. Brains were collected 3d after tMCAO. (A) Representative images of NeuN (blue), TUNEL (green), and Iba1 (red) triple-staining. Scale bar: 10 μm. The inset image depicts the hemisphere ipsilateral to stroke, where brain infarction is shown in gray and the area for image analysis is indicated by the box. (B) High-power 3-D image generated from A. White arrows indicate microglia/macrophages that engulfed dead/dying neurons (Iba1+NeuN+TUNEL+). White arrowheads indicate dead/dying neurons that were not engulfed by microglia/macrophages (Iba1NeuN+TUNEL+). Yellow arrows indicate live neurons (Iba1NeuN+TUNEL). Yellow arrowhead indicates a TUNEL neuron touched by an Iba1+ cell (Iba1+NeuN+TUNEL). Scale bar: 10 μm. (C) Quantification of the total number of Iba1+ microglia/macrophages in ischemic areas as indicated in Figure1A. (D) The number of Iba1+NeuN+ cells in ischemia areas. (E) The number of Iba1+NeuN+TUNEL+ cells (microglia/macrophages with engulfed dead/dying neurons) in ischemic areas. (F) The number of Iba1NeuN+TUNEL+ nonengulfed dead neurons in ischemic areas was quantified. (G) Phagocytic index, the percentage of dead/dying neurons engulfed by microglia/macrophages ([number of Iba1+NeuN+TUNEL+ cells/number of NeuN+TUNEL+ cells] × 100%), was calculated in WT and STAT6-KO brains. (H) Quantification of Iba1+NeuN+TUNEL cells (microglia/macrophages colocalize with TUNEL neurons) in ischemic areas. n = 6 mice per group. **P ≤ 0.01, ***P ≤ 0.001 STAT6-KO vs. WT, Student’s t test.
Figure 5
Figure 5. STAT6 deficiency enhances the proinflammatory phenotype of microglia/macrophages and aggravates neuroinflammation after ischemic stroke.
Brains were collected from WT and STAT6-KO mice 3d and 7d after 60 minutes tMCAO. (A–D) Analysis of microglia/macrophage phenotypes. (A) Representative images of microglia/macrophage marker Iba1 (red) and proinflammatory phenotype marker CD16 (green) double-staining. Scale bar: 50 μm. (B) Representative images of microglia/macrophage marker Iba1 (red) and antiinflammatory phenotype marker CD206 (green) double-staining. Scale bar: 50 μm. (C) Quantification of Iba1+CD16+ proinflammatory microglia/macrophages in ischemic areas at 3d and 7d after tMCAO. (D) Quantification of Iba1+CD206+ antiinflammatory microglia/macrophages in ischemic areas at 3d and 7d after tMCAO. n = 3–6 mice per group. **P ≤ 0.01, ***P ≤ 0.001 STAT6-KO vs. WT, Student’s t test. (E) The expression of CD16 and CD206 in pSTAT6+ and pSTAT6 microglia/macrophages (CD45+CD11b+) in ipsilateral hemisphere from WT mice was measured by flow cytometry 3d after tMCAO. Mean fluorescent intensity (MFI) of CD16 or CD206 in pSTAT6CD45+CD11b+ (gray) and pSTAT6+CD45+CD11b+ (pink) populations was quantified. n = 5 per group. ***P ≤ 0.001 pSTAT6+ vs. pSTAT6 population, Student’s t test. (F) mRNA expression of proinflammatory and antiinflammatory markers were measured by RT-qPCR in the ipsilateral hemisphere 3d and 7d after ischemic stroke. n = 6 mice per group for 3d. n = 3 mice per group for 7d. *P ≤ 0.05, **P ≤ 0.01, ***P ≤ 0.001 STAT6-KO vs. WT, Student’s t test.
Figure 6
Figure 6. Both CNS microglia and peripheral macrophages contribute to STAT6-afforded protection against ischemic stroke.
(A) Schematic illustration for the construction of WT/CX3CR1-GFP chimeric mice. (B–D) ImageStream analysis of pSTAT6 and Arg1 in CD45+CD11b+GFP cells and CD45+CD11b+GFP+ macrophages in ipsilateral hemisphere of chimeric mice was performed 3d after tMCAO. (B) Representative images indicating pSTAT6 and Arg1 signal in both CD45+CD11b+GFP cells and CD45+CD11b+GFP+ macrophages in ipsilateral brains. Scale bar: 7 μm. (C) Percentages of GFP cells and GFP+ macrophages among CD45+CD11b+ cells were assessed in WT (left) and WT/CX3CR1-GFP chimeric mice (right). (D) Percentages of pSTAT6+ cells (left) and Arg1+ cells (right) observed among CD45+CD11b+GFP cells and CD45+CD11b+GFP+ macrophages. n = 3 mice. (E) Chimeric mice were constructed by transplanting WT BM to WT recipients (WT/WT), STAT6-KO BM to WT recipients (WT/KO), or WT BM to STAT6-KO recipients (KO/WT) after irradiation of recipients. Chimeric mice were subjected to 60 minutes of tMCAO at 6 weeks after irradiation. (F and G) Infarct volume at 3d after tMCAO was quantified in MAP2-stained (green) coronal sections. Dashed lines outline the infarct area. n = 9–10 mice per group. Scale bar: 1 mm. (H and I) Neuronal death in chimeric mice was quantified by TUNEL (red) and NeuN (green) colabeling in infarct areas 3d after tMCAO. Scale bar: 10 μm. n = 3–5 mice per group. *P ≤ 0.05, **P ≤ 0.01, ***P ≤ 0.001 vs. WT/WT, 1-way ANOVA.
Figure 7
Figure 7. WT macrophage adoptive transfer improves stroke outcomes in STAT6-KO mice.
(A) Two million macrophages (Mø) prepared from either WT mice or STAT6-KO mice were adoptively transferred (i.v. route) into the STAT6-KO mice 2 hours after 60 minutes of tMCAO. (B and C) Infarct volume at 3d after tMCAO was quantified in MAP2-stained coronal sections. Dashed lines outline the infarct area. Scale bar: 1 mm. n = 6/group. (D and E) Neuronal death was quantified by TUNEL (red) and NeuN (green) colabeling in infarct areas 3d after tMCAO. Scale bar: 20 μm. n = 6 mice per group. *P ≤ 0.05 vs. WT/WT, Student’s t test.
Figure 8
Figure 8. STAT6 signaling facilitates efferocytosis and antiinflammatory responses in both microglia and macrophages.
(A–D) PI-labeled dead/dying neurons were added to WT or STAT6-KO microglia or macrophages. (A and B) Representative images showing phagocytosis of PI+ dead/dying neurons (red) in phalloidin-labeled microglia (green, A) or macrophages (green, B). Blue shows DAPI staining of nuclei. (C and D) Quantification of engulfed PI+ neurons in microglia (C) and macrophages (D) at indicated time points after coincubation. Data represent 5 independent experiments in duplicate. *P ≤ 0.05, **P ≤ 0.01, ***P ≤ 0.001 vs. WT at corresponding time points, Student’s t test. (E) RT-qPCR analysis of mRNA expression of proinflammatory (IL-6 and TNF-α) and antiinflammatory (IL-10) factors in microglia and macrophages at 1 hour after efferocytosis of PI+ dead/dying neurons. Data represent 3 independent experiments in duplicate. *P ≤ 0.05, **P ≤ 0.01, 1-way ANOVA. (F–H) Flow cytometry analysis of protein expression of proinflammatory (IL-6 and TNF-α) and antiinflammatory (IL-10) factors in microglia and macrophages 6 hours after incubation with PI+ dead/dying neurons. Data represent 5 independent experiments in duplicate. *P ≤ 0.05, **P ≤ 0.01, ***P ≤ 0.001 vs. WT, Student’s t test.
Figure 9
Figure 9. STAT6 deficiency negates microglia/macrophage-induced protection of ischemic neurons.
(A) Experimental design. Primary neurons were subjected to 90-minute OGD and then cocultured with WT or STAT6-KO microglia/macrophages. Neuronal survival was measured 24 hours later by MAP2 staining. (B) Representative images of MAP2-stained neurons after coculturing with WT or STAT6-KO microglia. Scale bar: 50 μm. (C and D) The number of MAP2+ (red) neurons was quantified 24 hours after coculturing with WT or STAT6-KO microglia (C) or macrophages (D). In some groups, WT microglia or macrophages were treated with cytochalasin D (10 μM, 1 hour) to inhibit phagocytosis. Data represent 3 independent experiments in duplicate. **P ≤ 0.01 vs. OGD alone (2nd bar), 1-way ANOVA.
Figure 10
Figure 10. Arginase 1 is a downstream target of STAT6 signaling in microglia and macrophages.
(A) Immunostaining of Arginase 1 (Arg1, green) in Iba1+ microglia/macrophages (red) in the ischemic striatum (STR) and cortex (CTX) 3d after cerebral ischemia. Scale bar: 20 μm. (B) The expression of Arg1 in pSTAT6+ (pink) and pSTAT6 (gray) microglia/macrophage (CD45+CD11b+ gated) was measured 3d after tMCAO in ipsilateral hemisphere of WT mice by flow cytometry. Mean fluorescent intensity (MFI) of Arg1 was quantified. n = 5 mice. ***P ≤ 0.001 vs. pSTAT6 population, Student’s t test. (C) RT-qPCR analysis of Arg1 mRNA expression in WT and STAT6-KO microglia or macrophages without stimulation and after activating STAT6 signaling with IL-4 (20 ng/mL for 48 hours). Data were collected from 4 independent experiments. **P ≤ 0.01, *** P ≤ 0.001, 1-way ANOVA. (D) Western blot analysis of Arg1 protein expression in microglia or macrophages without stimulation and after activating STAT6 signaling with IL-4. Data were collected from 3 independent experiments. ***P ≤ 0.001, 1-way ANOVA.
Figure 11
Figure 11. Arg1 is essential for efferocytic activity of primary cultured microglia and macrophages.
NOAH, an arginase inhibitor, or vehicle control was applied to microglia and macrophages for 1 hour before exposure to PI+ dead/dying neurons. (A) Phagocytosis of PI+ dead/dying neurons by microglia or macrophages was quantified as MFI of PI in microglia or macrophages using flow cytometry. Data were collected from 4 independent experiments. *P ≤ 0.05, **P ≤ 0.01 NOAH vs. vehicle, Student’s t test. (B) Protein expression of proinflammatory (IL-6 and TNF-α) and antiinflammatory (IL-10) factors in microglia and macrophages was quantified by flow cytometry at 6 hours after efferocytosis. Data were collected from 4 independent experiments. *P ≤ 0.05, **P ≤ 0.01 NOAH vs. vehicle, Student’s t test. (C) Cell death was quantified by the LDH assay. Data were collected from 6 independent experiments for microglia and 5 independent experiments for macrophage. (D–F) STAT6-KO microglia and macrophages were infected with lentiviral vectors carrying Arg1 cDNA and GFP (Lenti-Arg1) or control lentivirus carrying GFP only (Lenti) for 2d and incubated with PI-labeled post-OGD neurons. Phagocytosis of PI+ dead/dying neurons by Lenti-GFP–transfected WT (WT+Lenti), Lenti-GFP–transfected STAT6-KO (KO+Lenti), or Lenti-Arg1-GFP–transfected STAT6-KO (KO+Lenti-Arg1) microglia and macrophages was quantified 4 hours (microglia) and 1.5 hours (macrophage) after coculture. (D) Representative images of microglia/macrophage (green) phagocytosis of dead/dying neurons (red) overlaid on DIC images. Scale bar: 20 μm. (E) Quantification of the number of engulfed PI+ neurons observed in GFP+ microglia or GFP+ macrophages. (F) Quantification of LDH release in conditioned medium collected from microglia or macrophages after virus transfection. Data represent 6 independent experiments in duplicate. **P ≤ 0.01, ***P ≤ 0.001, 1-way ANOVA.
Figure 12
Figure 12. STAT6 deficiency impairs long-term recovery after tMCAO.
WT and STAT6-KO mice were subjected to 60 minutes of tMCAO. (A) Brain tissue loss 35d after tMCAO was quantified on MAP2-stained (green) coronal sections. n = 8–10 mice per group. Scale bar: 1 mm. (B) Neurological deficit score was assessed during the first 3d after tMCAO. (C and D) Sensorimotor deficits were evaluated with rotarod (C) and foot-fault (D) tests 3d–14d after tMCAO. (E) Cognitive function was assessed with Morris water maze at 21d–25d after tMCAO. Latency to find the hidden platform in the cued test (spatial learning) and time spent in the target quadrant in the probe test (memory) were measured. n = 8–10 mice per group. *P ≤ 0.05, **P ≤ 0.01, ***P ≤ 0.001 vs. WT, Student’s t test (A), Mann-Whitney U test (B), or 2-way ANOVA repeated measurement (CE).

References

    1. An C, et al. Molecular dialogs between the ischemic brain and the peripheral immune system: dualistic roles in injury and repair. Prog Neurobiol. 2014;115:6–24. doi: 10.1016/j.pneurobio.2013.12.002. - DOI - PMC - PubMed
    1. Shichita T, Ito M, Yoshimura A. Post-ischemic inflammation regulates neural damage and protection. Front Cell Neurosci. 2014;8:319. - PMC - PubMed
    1. Liesz A, et al. DAMP signaling is a key pathway inducing immune modulation after brain injury. J Neurosci. 2015;35(2):583–598. doi: 10.1523/JNEUROSCI.2439-14.2015. - DOI - PMC - PubMed
    1. Arandjelovic S, Ravichandran KS. Phagocytosis of apoptotic cells in homeostasis. Nat Immunol. 2015;16(9):907–917. doi: 10.1038/ni.3253. - DOI - PMC - PubMed
    1. Patel AR, Ritzel R, McCullough LD, Liu F. Microglia and ischemic stroke: a double-edged sword. Int J Physiol Pathophysiol Pharmacol. 2013;5(2):73–90. - PMC - PubMed

Publication types

MeSH terms