. 2019 Oct 16;10(1):4703.
doi: 10.1038/s41467-019-12253-y.

Microbe-host interplay in atopic dermatitis and psoriasis

Affiliations

Microbe-host interplay in atopic dermatitis and psoriasis

Nanna Fyhrquist et al. Nat Commun. .

Abstract

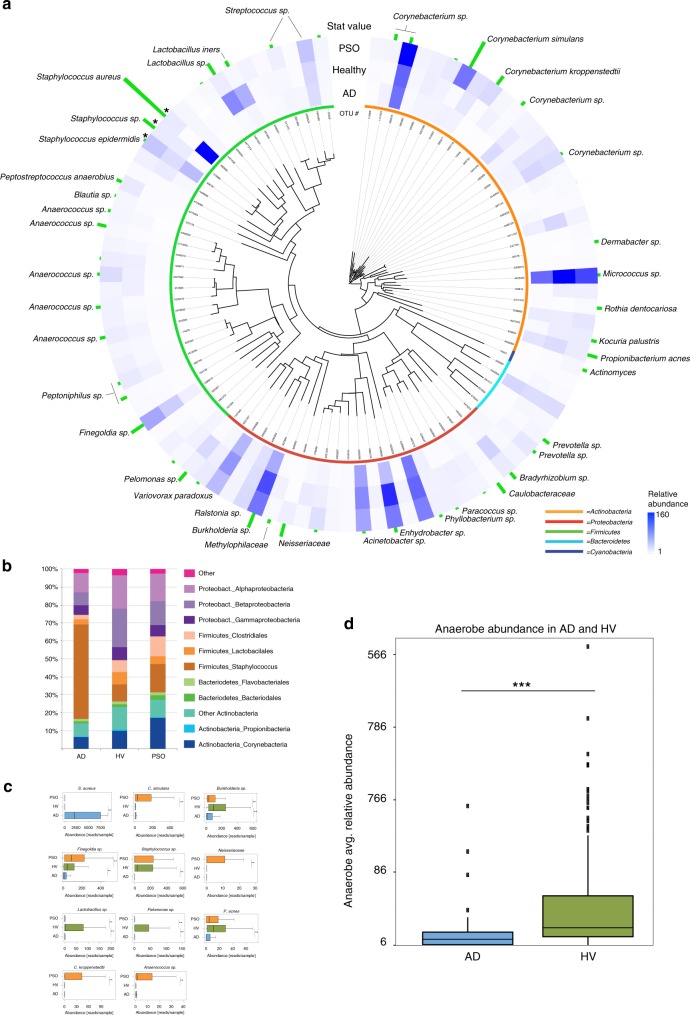
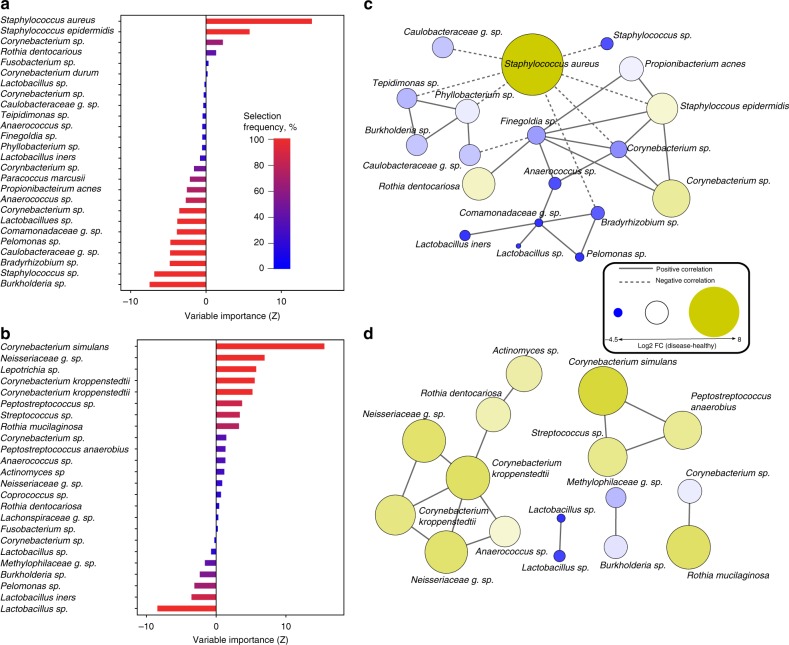
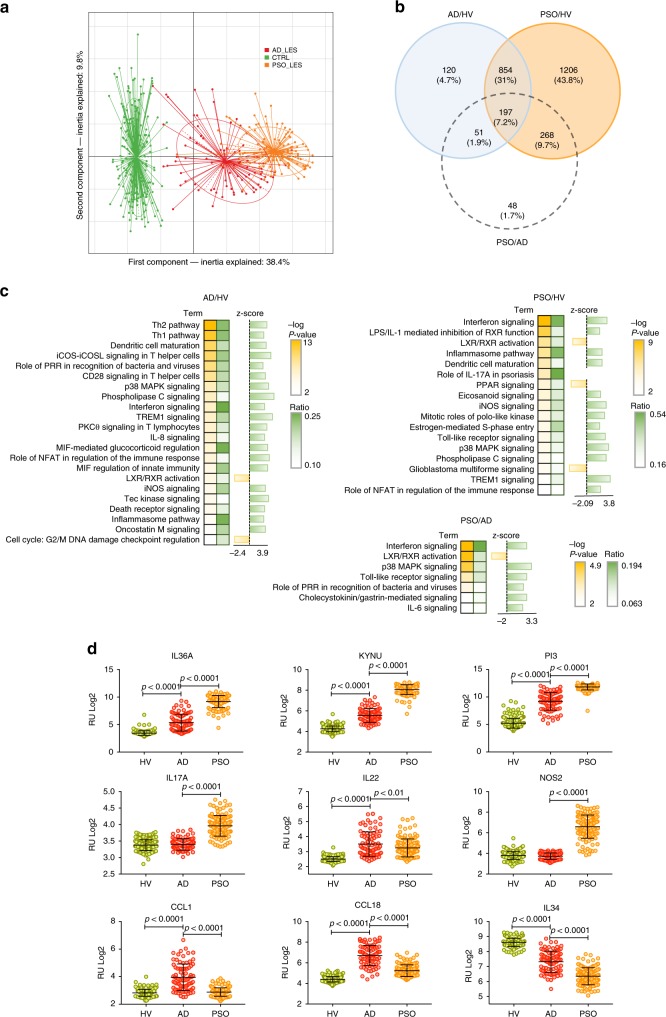
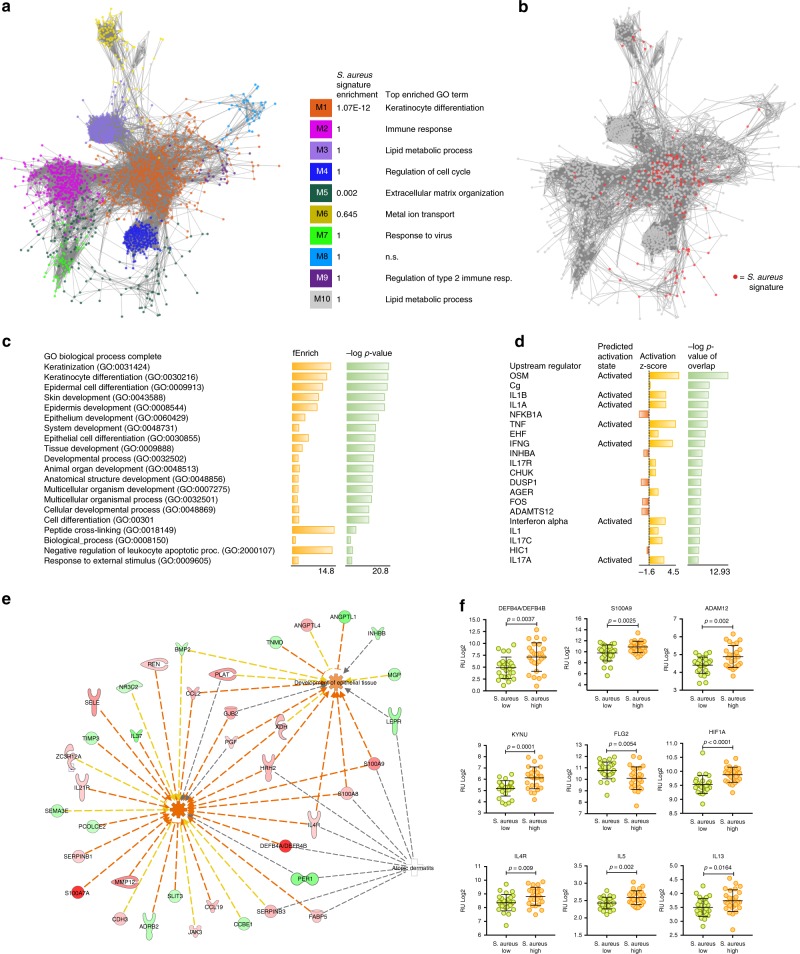
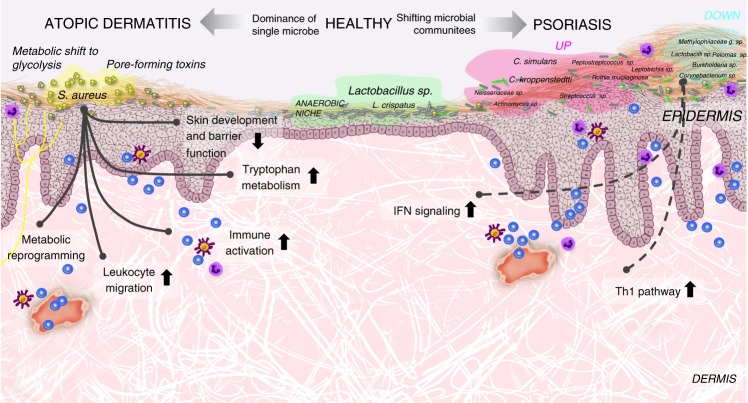
Despite recent advances in understanding microbial diversity in skin homeostasis, the relevance of microbial dysbiosis in inflammatory disease is poorly understood. Here we perform a comparative analysis of skin microbial communities coupled to global patterns of cutaneous gene expression in patients with atopic dermatitis or psoriasis. The skin microbiota is analysed by 16S amplicon or whole genome sequencing and the skin transcriptome by microarrays, followed by integration of the data layers. We find that atopic dermatitis and psoriasis can be classified by distinct microbes, which differ from healthy volunteers microbiome composition. Atopic dermatitis is dominated by a single microbe (Staphylococcus aureus), and associated with a disease relevant host transcriptomic signature enriched for skin barrier function, tryptophan metabolism and immune activation. In contrast, psoriasis is characterized by co-occurring communities of microbes with weak associations with disease related gene expression. Our work provides a basis for biomarker discovery and targeted therapies in skin dysbiosis.


Conflict of interest statement

The authors declare no competing interests.

Figures

Fig. 1
Fig. 1
Characterization of the skin microbiome in AD and PSO. The results show a typical range of skin microbiomes in HV (n = 115) and significant changes in AD (n = 82) and PSO (n = 119). a An evolutionary tree based on 16S rRNA gene sequences, abundance and statistical significance of the 95 most abundant OTUs. The blue color intensity in the heat map shows the relative abundance of each OTU. The three Staphylococcus OTUs (indicated by asterisks) were calculated using a wider scale, due to their relatively high abundance in certain samples. The length of the green vertical bars indicate nonparametric statistical score (Kruskal−Wallis test, FDR, p < 0.05). The color bars by each OTU number indicates bacterial phylum (green: Firmicutes; red: Proteobacteria; cyan: Bacteroidetes; blue: Cyanobacteria; orange: Actinobacteria). b The most abundant bacterial groups depicted for HV, AD and PSO. c Statistical analysis (Mann−Whitney U test (FDR, p < 0.05)) of the 11 OTUs showing the most significant changes in AD and/or PSO vs. HV after correction for confounding factors. The values on the x axis are in number of reads, out of a total of 8495 reads/sample. The asterisks indicate statistically significant differences and correspond to p < 0.01 (**) and p < 0.001 (***). The center line in the boxplots corresponds to the median, the bounding box is the interquantile range (IQR) and the whiskers are defined as 1.5 times IQR. d Statistical analysis (Mann−Whitney U test, p < 0.05) of the relative abundance of OTUs representing strictly anaerobic bacteria in AD lesions and HV. The x-axis units and the elements of the boxplots are as in (c). The source data files used to generate the present figure are available from the NCBI Sequence Read Archive under accession PRJNA554499
Fig. 2
Fig. 2
Microbiota-based classification of AD and PSO. a Variable importance for the best set of discriminatory AD (n = 82) taxa identified through Random Forest feature selection and classification (RF) analysis. Bars are colored by selection frequency (Red = OTU selected in all folds, blue = OTU selected in one fold). b Variable importance for the best set of discriminatory PSO (n = 119) taxa identified by RF analysis. c Co-occurrence network of AD-associated OTUs selected by RF selection. Pairwise correlations were calculated over AD samples using SparCC and OTUs with a mean Z > 0.2 are shown. A connection represents a correlation >0.2 and significant p < 0.05 correlation. Solid and dashed lines respectively represent positive and negative correlations. The size and color of each node is proportional to the log2 fold change between healthy and disease. d Correlation network of PSO-associated OTUs selected by RF. The source data files used to generate the present figure are available from the NCBI Sequence Read Archive under accession PRJNA554499
Fig. 3
Fig. 3
The AD and PSO skin transcriptomes. a Projection of AD (red, n = 82), PSO (orange, n = 119) and HV (green, n = 115) transcriptome profiles in the subspace spanned by the two first components of the principal component analysis (PCA) performed on the 1000 most variant genes. b Venn diagram of the differentially expressed genes in the AD vs. HV, PSO vs. HV and PSO vs. AD contrasts (identified using the Limma linear model and empirical Bayes method, cut-off: log2 FC > 0.58 and FDR p < 1 × 10−5, corrected using the Benjamini−Hochberg method). c IPA canonic pathway analysis of significantly enriched functions in AD and PSO gene signatures and the PSO vs. AD contrast. d Statistical analysis (unpaired t test) of selected top up- and downregulated genes. The center line in the dot plots corresponds to the mean, and the error bars to the standard deviation. The source data files used to generate the present figure are available from EBI ArrayExpress under accession E-MTAB-8149
Fig. 4
Fig. 4
The “S. aureus signature” and functional associations. a Using AD-associated genes (AD patients, n = 82) identified at FDR level 10−5, we created an AD gene co-expression network, which was partitioned into modules by network community detection. Top enriched GO terms are indicated for each network module. b Differential analysis between S. aureus “high” (n = 27) and “low” (n = 25) samples revealed 256 differentially expressed genes (FDR < 0.05, FCH ≥ 1.5). Hypergeometric tests revealed significant enrichment in S. aureus-associated genes (colored red) that mapped to modules M1 and M5. Gene annotations and Ingenuity Pathway analysis identified c enriched gene ontology terms in the S. aureus signature, and d predicted upstream regulators, respectively. e Molecular networks generated between top functions and associated genes. The red color of the gene symbols indicates upregulated genes, green indicates downregulated genes. Red colored edges indicate predicted activation, yellow edges indicate inconsistent findings, and gray edges lack a predicted effect. f Statistical analysis (unpaired t test) of RNA expression levels of selected genes in S. aureus “high” and “low” abundance samples. The center line in the dot plots corresponds to the mean, and the error bars correspond to the standard deviation. The source data files used to generate the present figure are available from the NCBI Sequence Read Archive under accession PRJNA554499, and from EBI ArrayExpress under accession E-MTAB-8149
Fig. 5
Fig. 5
Host−microbe interaction in atopic dermatitis and psoriasis. AD is characterized by overgrowth of S. aureus, and loss of microbial diversity. In AD, colonization of the skin by S. aureus is associated with dysregulation of genes involved in epithelial barrier function, immune activation, leukocyte migration, trp degradation and metabolic reprogramming. PSO is associated with multiple species, including increased colonization by C. simulans and C. kroppenstedtii, and a loss of Lactobacillus, P. acnes and Corynebacterium spp., which may play regulatory roles

References

    1. Dethlefsen L, McFall-Ngai M, Relman DA. An ecological and evolutionary perspective on human-microbe mutualism and disease. Nature. 2007;449:811–818. - PMC - PubMed
    1. Cho I, Blaser MJ. The human microbiome: at the interface of health and disease. Nat. Rev. Genet. 2012;13:260–270. - PMC - PubMed
    1. Grice EA, Segre JA. The skin microbiome. Nat. Rev. Microbiol. 2011;9:244–253. - PMC - PubMed
    1. Bieber T. Atopic dermatitis. N. Engl. J. Med. 2008;358:1483–1494. - PubMed
    1. Nestle FO, Kaplan DH, Barker J. Psoriasis. N. Engl. J. Med. 2009;361:496–509. - PubMed

Publication types

MeSH terms

Substances