. 2019 Oct 16;10(1):4693.
doi: 10.1038/s41467-019-12399-9.

Phosphate acts directly on the calcium-sensing receptor to stimulate parathyroid hormone secretion

Affiliations

Phosphate acts directly on the calcium-sensing receptor to stimulate parathyroid hormone secretion

Patricia P Centeno et al. Nat Commun. .

Abstract

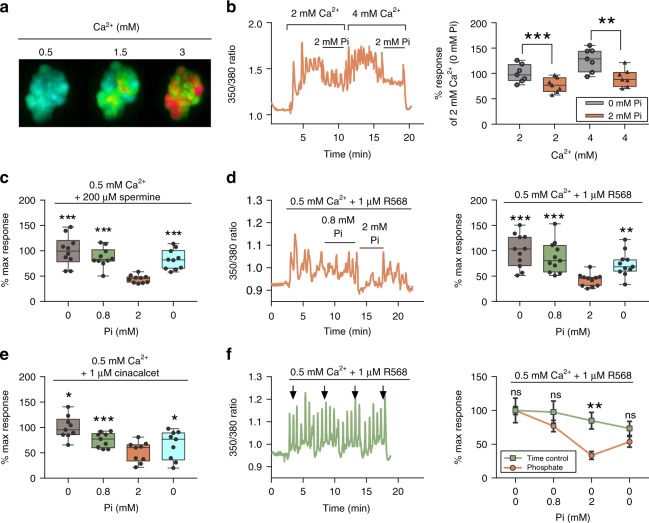
Extracellular phosphate regulates its own renal excretion by eliciting concentration-dependent secretion of parathyroid hormone (PTH). However, the phosphate-sensing mechanism remains unknown and requires elucidation for understanding the aetiology of secondary hyperparathyroidism in chronic kidney disease (CKD). The calcium-sensing receptor (CaSR) is the main controller of PTH secretion and here we show that raising phosphate concentration within the pathophysiologic range for CKD significantly inhibits CaSR activity via non-competitive antagonism. Mutation of residue R62 in anion binding site-1 abolishes phosphate-induced inhibition of CaSR. Further, pathophysiologic phosphate concentrations elicit rapid and reversible increases in PTH secretion from freshly-isolated human parathyroid cells consistent with a receptor-mediated action. The same effect is seen in wild-type murine parathyroid glands, but not in CaSR knockout glands. By sensing moderate changes in extracellular phosphate concentration, the CaSR represents a phosphate sensor in the parathyroid gland, explaining the stimulatory effect of phosphate on PTH secretion.


Conflict of interest statement

The authors declare no competing interests.

Figures

Fig. 1
Fig. 1
Pathophysiologic concentrations of Pi significantly inhibit the CaSR. a Representative false-color images from epifluorescence imaging of Fura2-loaded CaSR-HEK cells showing CaSR-mediated Cai2+ mobilization upon stimulation with increasing Cao2+ concentrations (as indicated with warm colors). bf Inhibitory effect of Pi on CaSR-mediated Cai2+ mobilization upon stimulation with different concentrations of Ca2+ (b), and cotreatment with R568 (d, f), spermine (c), and cinacalcet (e). b, d, f (left) Representative Cai2+ mobilization traces (Fura2 ratio) from a single cell in response to Pi (b, d), and time-matched buffer changes without Pi (f). f Inhibitory effect of Pi on CaSR-mediated Cai2+ mobilization upon stimulation with R568 compared with time-matched control in the absence of Pi; data shown as %mean ± SEM. Data expressed as percent control of the area under the curve for each treatment, n = 7 (b), n = 10 (c), n = 11 (d), n = 9 (e), and n = 9 (f). Data shown in box-and-whisker plots: box ends indicate upper and lower quartiles; midline indicates the median while error bars indicate the range. Data were analyzed by using RM-ANOVA with Dunnett’s multiple comparison (be) or unpaired t test (f). ns not significant; *P < 0.05, **P < 0.01, and ***P < 0.001. Source data are provided as a Source Data file
Fig. 2
Fig. 2
Pi inhibits the CaSR in a noncompetitive manner. a Representative immunoblot showing Pi-mediated inhibition of CaSR-induced pERK after 10 min of treatment with Pi and acidosis (pH 7.2). Changes in pERK were determined by densitometry, corrected for β-actin abundance and normalized to Pi-free CaSR-stimulated control (n = 8 dishes from four experiments; 0.5 mM Ca2+ shown as a negative control). b Representative traces showing Cai2+ mobilization from single cells exposed to buffers containing increasing levels of Cao2+ (left), and Ca2+ concentration-effect curves (right) in the presence of 0 (n = 7), 0.8 (n = 9), and 2 (n = 10) mM Pi from three independent experiments. Emax expressed as %mean ± SEM. c Pi concentration-effect curves for Cai2+-mobilization upon stimulation with cinacalcet and 1 or 1.5 mM Cao2+ (n = 7, two independent experiments). d SO4 concentration-effect curves for Cai2+-mobilization upon stimulation with R568 and 1.5 mM Cao2+ (n = 8, two independent experiments). bd Area under the curve was calculated for each treatment and normalized to maximal response. Data were fitted to a four-parameter Hill equation (Eq. (1)) for sigmoidal dose response variable slope, and fitted best when EC50 (b)/IC50 (c, d), expressed as mean (95% confidence interval), were shared among data sets, P < 0.01 extra sum-of-square F-test. Data expressed as %mean ± SEM. Data were analyzed by using RM-ANOVA with Dunnett’s multiple comparisons, ns not significant; *P < 0.05, **P < 0.01, and ***P < 0.001. Source data are provided as a Source Data file
Fig. 3
Fig. 3
Pathophysiologic Pi concentrations increase PTH secretion in human parathyroid cells. Effect of hyperphosphatemia on PTH secretion (measured every 2 min) from perifused, freshly isolated human parathyroid cells (upper). One millimolar Ca2+ was used as an internal control to confirm Cao2+ responsiveness and CaSR expression in the cell preparation. Data normalized to baseline (initial exposure to 1.2 mM Cao2+/0.8 mM Pi) and shown in box-and-whisker plots. Data from N = 9 human samples from nine biologically independent patients; individual traces are shown in Supplementary Fig. 4. ns not significant, ***P < 0.001, ****P < 0.0001 by Friedman’s with Dunn’s post hoc test. Source data are provided as a Source Data file
Fig. 4
Fig. 4
Pi increases murine PTH secretion via the CaSR. a Magnified mouse parathyroid gland before dissection in a 10-day-old control mouse. b Serum PTH levels measured from control and KO Casr mice before dissection. Data shown as median and min. to max. range (WT N = 11 and KO Casr N = 3). ****P < 0.0001 by unpaired t test. c Effect of pathophysiologic Pi exposure at different Ca2+ concentrations on PTH secretion in freshly isolated parathyroid glands from 7- to 10-day-old control. WT glands (from four different litters) were sequentially exposed to normal Ca2+ (1.2 mM Ca2+; N = 11), low Ca2+ (0.8 mM Ca2+; N = 7 and 0.6 mM; N = 4), and high Ca2+ (1.6 mM Ca2+; N = 7). The KO Casr glands were exposed to 1.2, 0.8, and then 1.6 mM Ca2+ in turn (N = 3). PTH secretion measured every 30 min and normalized to baseline conditions (0.8 mM Pi/1.2 mM Ca2+) in the time course (left). For bar graphs, data normalized to 0.8 mM Pi at their respective Ca2+ concentration. Data shown as %mean ± SEM. ns not significant, *P < 0.05, **P < 0.01 by RM-ANOVA (Dunnett’s multiple comparison test). Source data are provided as a Source Data file
Fig. 5
Fig. 5
Pi-binding sites in the CaSR extracellular domain. Pi-binding sites in the CaSR’s active and inactive conformations. In the active conformation (left), R62 and R66 interact respectively with E277 (creating a salt bridge) and S302 (hydrogen bond) to keep the upper and lower domain closely associated ensuring a closed/active conformation. In the inactive conformation (right), both interactions are broken and Pi ions stabilize the positive charges of R62 and R66. Also, Pi ions displace a lower domain eliciting an open/inactive conformation, by reducing equilibrium free energy. Note that Pi-binding site 1 is only occupied in the inactive state, whereas Pi-binding site 2 is occupied in both inactive and active conformations integrated within the receptor’s structure. Pink sticks show the R62–E277 salt bridge interaction and green sticks show the R66–S301 hydrogen bond. PDB accession numbers 5k5s and 5k5t. BS binding site
Fig. 6
Fig. 6
CaSR Pi-binding sites are conserved across species. Phylogenetic analysis of the four Pi-binding sites within the CaSR ECD, represented with WebLogo and following the human numbering scheme. The data set comprised 138 aligned nucleotide sequences from the family C GPCRs, including 42 CaSR sequences from different phylogenetic groups. a Aligned amino acid positions from family C GPCRs, including CaSR. b Vertebrate CaSR subset reveals overall higher bit scores, reflecting stabilization and conservation of Pi-binding sites. Conservation at each amino acid position in the binding site is assessed as the WebLogo bit score, with amino acid usage frequencies at that position reflected in the relative size of the single-letter amino acid identifiers within the bit score bars. BS binding sites
Fig. 7
Fig. 7
CaSRR62A is not inhibited by Pi. CaSRR62A-induced Cai2+-mobilization is not sensitive to Pi upon stimulation with Ca2+ (a, n = 7), or cotreatment with R568 (b, n = 10). c CaSRR62A-induced Cai2+-mobilization is also insensitive to SO4 (n = 8). ac Area under the curve was calculated for each treatment and normalized against maximal response. d Cell surface expression levels of CaSRWT, CaSRR62A, and known defective mutants measured in transiently transfected HEK cells with non-transfected HEK-293 cells (NT) used as negative controls (n = 9, performed in triplicate; NT, n = 6). Data normalized to CaSRWT (WT) total expression levels. e Ca2+ concentration−effect curves for Cai2+-mobilization on CaSRR62A (with 0, 0.8, or 2 mM Pi) and CaSRWT (without Pi, shown here for comparison purposes). Data fitted to a four-parameter Hill equation (Eq. (1)) for sigmoidal concentration−response variable slope (n = 8–10, from three independent experiments). Data fitted best when EC50 (shown as mean with 95% confidence interval) values for Cao2+ were different among data sets and Emax was shared, P < 0.01 extra sum-of-square F-test. f Representative immunoblot showing pERK responses by CaSRR62A and CaSRWT after a 10-min stimulation; 0.5 mM Ca2+ used as negative control. Changes in pERK were corrected for β-actin abundance and then normalized to the Pi-free stimulated control (n = 8, from four independent experiments). Data are plotted as %mean ± SEM and analyzed by using RM-ANOVA, Dunnett’s multiple comparisons (be), or unpaired t test (a, f). ns not significant, *P < 0.05 and **P < 0.01. Source data are provided as a Source Data file
Fig. 8
Fig. 8
Pi is an important regulator of CaSR activity. In health, CaSR negatively modulates PTH secretion to control Ca2+ homeostasis. An acute rise in Pi inhibits the CaSR and would permit increased PTH secretion which stimulates renal Pi excretion to help restore normal serum Pi levels. However, in the hyperphosphatemia of CKD, the additional Pi would stabilize the CaSR’s inactive conformation permitting chronically elevated PTH secretion and contributing to SHPT progression. CaSR-ECD crystal models obtained from PDB 5k5s (active) and 5k5t (inactive) and shown as surface. Created with Biorender.com

References

    1. Brown EM, et al. Cloning and characterization of an extracellular Ca(2+)-sensing receptor from bovine parathyroid. Nature. 1993;366:575–580. doi: 10.1038/366575a0. - DOI - PubMed
    1. Drueke TB. Modulation and action of the calcium-sensing receptor. Nephrol. Dial. Transplant. 2004;19:V20–V26. doi: 10.1093/ndt/gfh1052. - DOI - PubMed
    1. Brown EM, MacLeod RJ. Extracellular calcium sensing and extracellular calcium signaling. Physiol. Rev. 2001;81:239–297. doi: 10.1152/physrev.2001.81.1.239. - DOI - PubMed
    1. Nielsen PK, Feldt-Rasmussen U, Olgaard K. A direct effect in vitro of phosphate on PTH release from bovine parathyroid tissue slices but not from dispersed parathyroid cells. Nephrol. Dial. Transplant. 1996;11:1762–1768. doi: 10.1093/oxfordjournals.ndt.a027665. - DOI - PubMed
    1. Almaden Y, et al. Direct effect of phosphorus on PTH secretion from whole rat parathyroid glands in vitro. J. Bone Miner. Res. 1996;11:970–976. doi: 10.1002/jbmr.5650110714. - DOI - PubMed

Publication types

MeSH terms