. 2019 Oct;574(7778):372-377.
doi: 10.1038/s41586-019-1653-x. Epub 2019 Oct 16.

Habenular TCF7L2 links nicotine addiction to diabetes

Affiliations

Habenular TCF7L2 links nicotine addiction to diabetes

Alexander Duncan et al. Nature. 2019 Oct.

Abstract

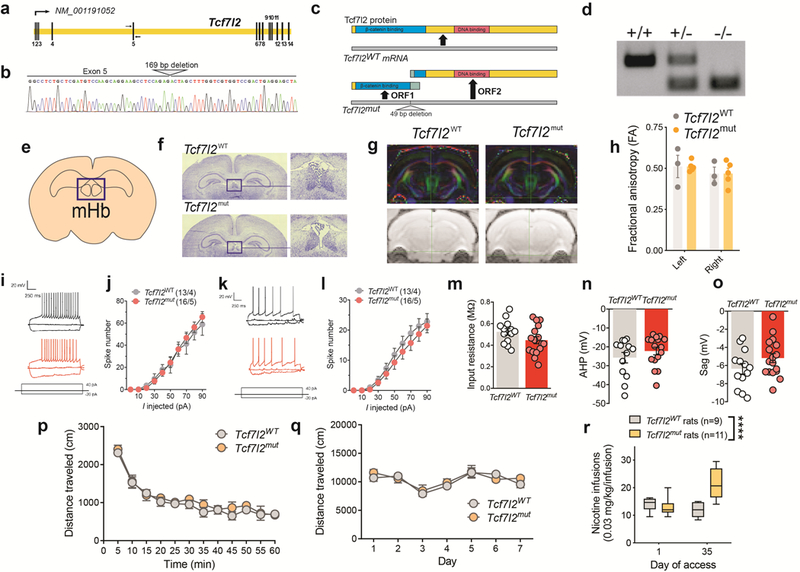
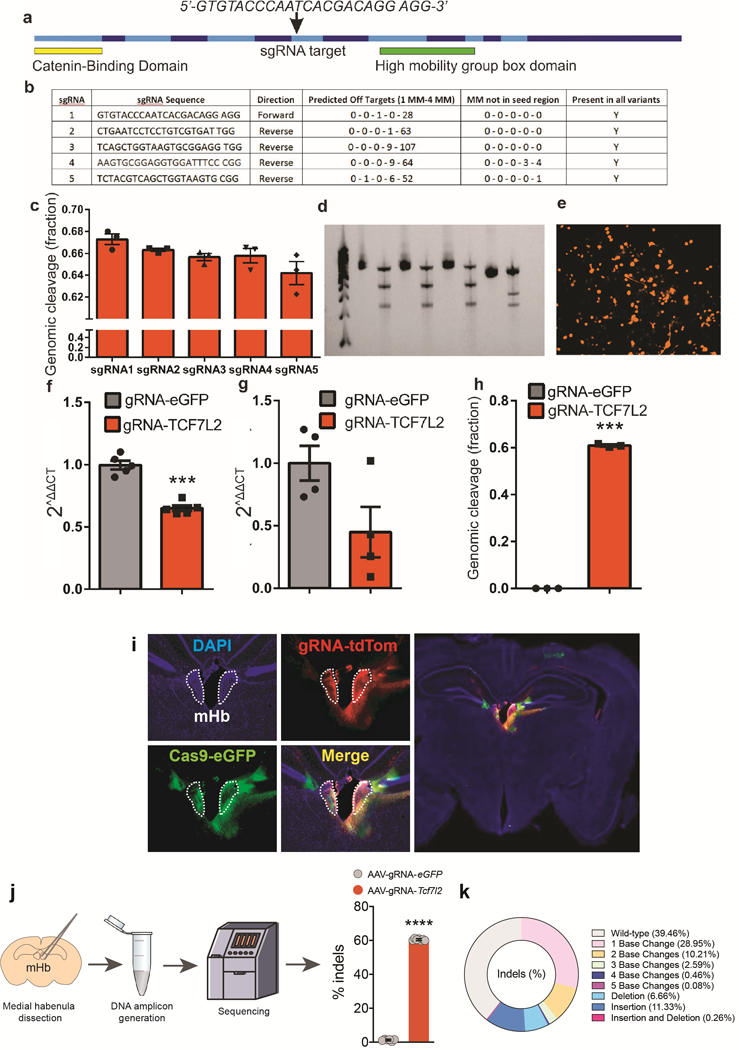
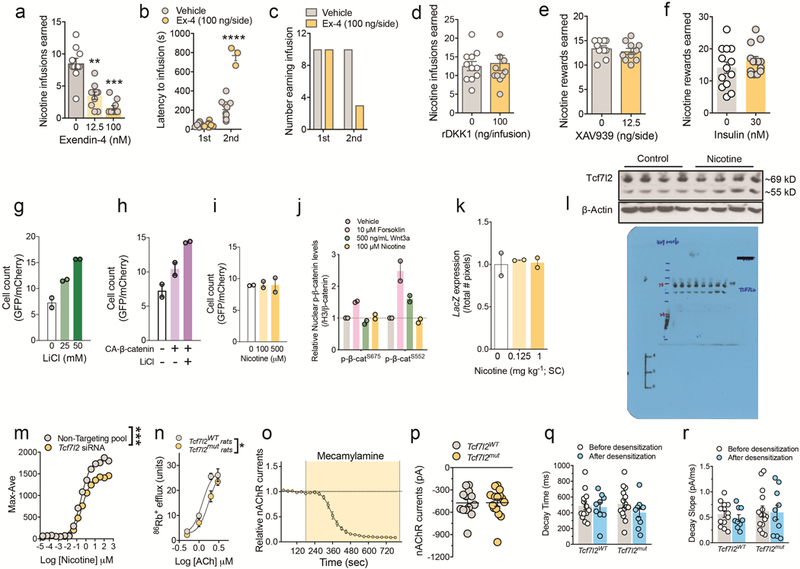
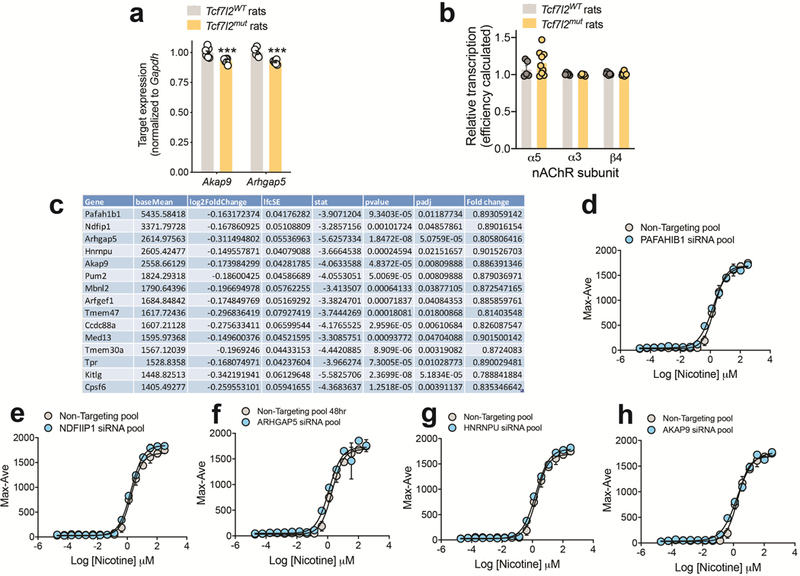
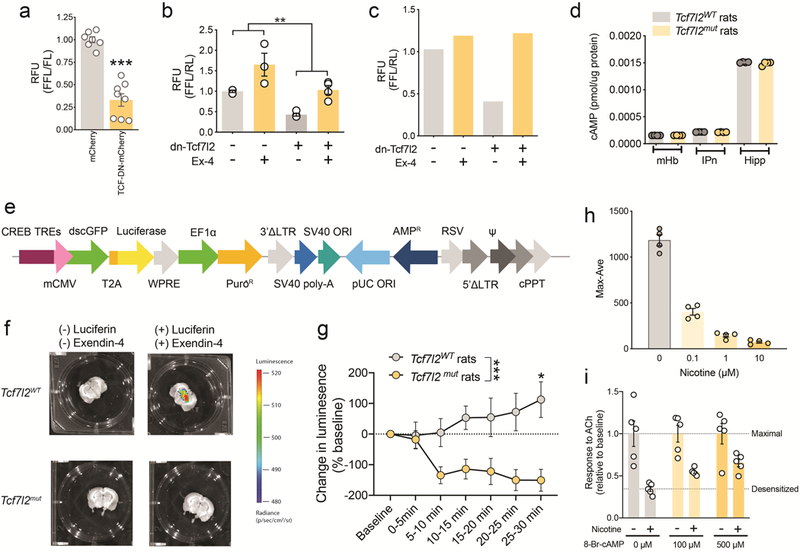
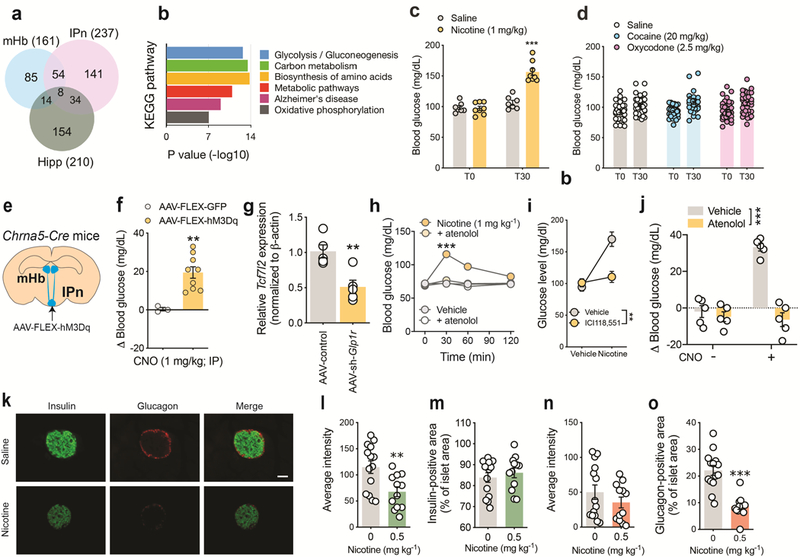
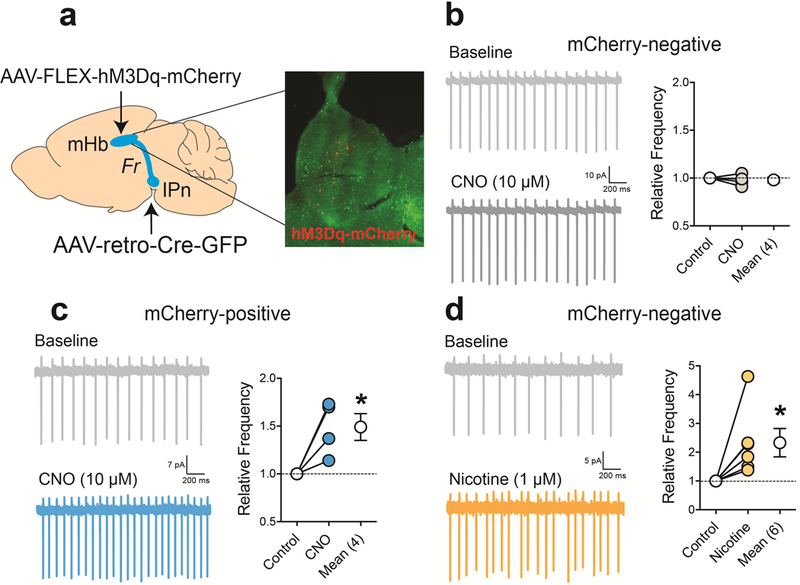
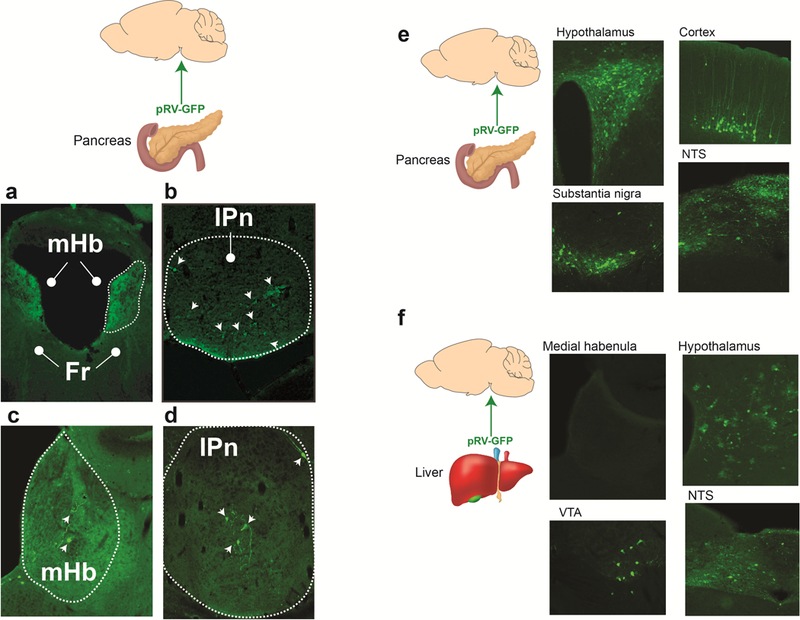
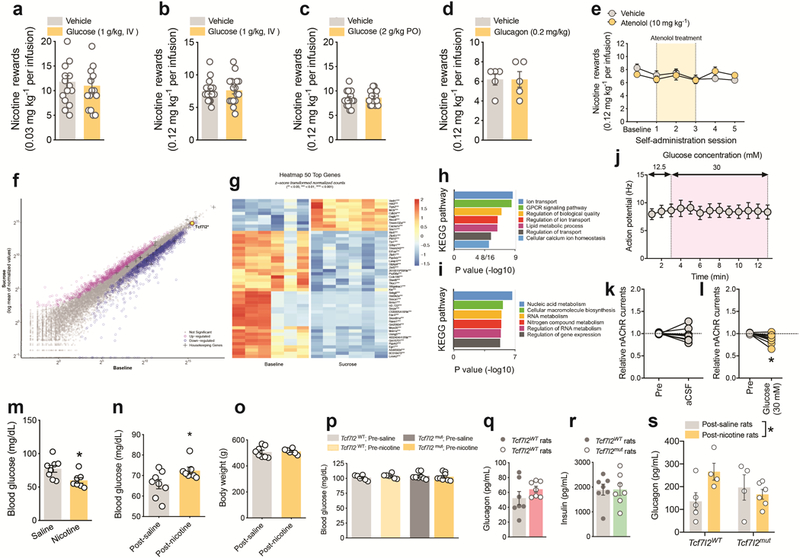
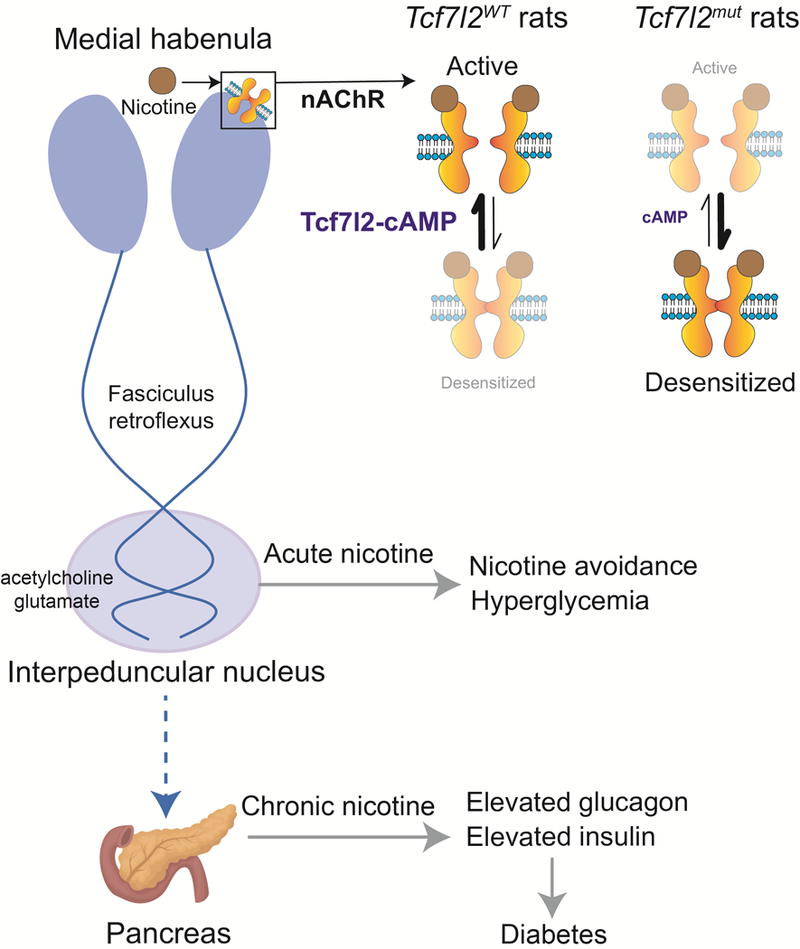
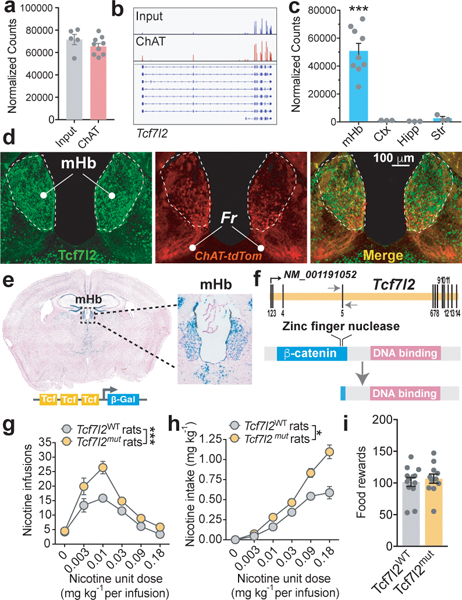
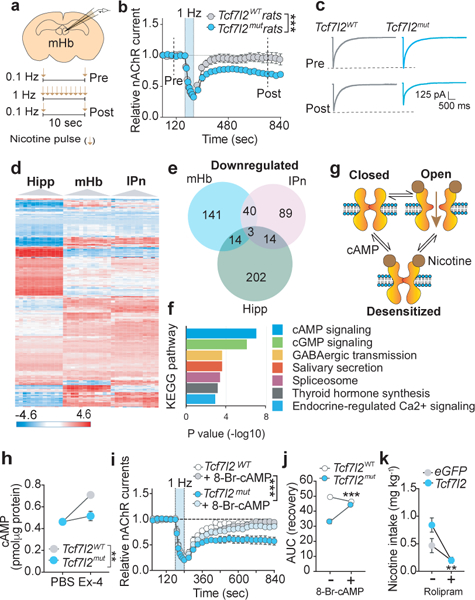
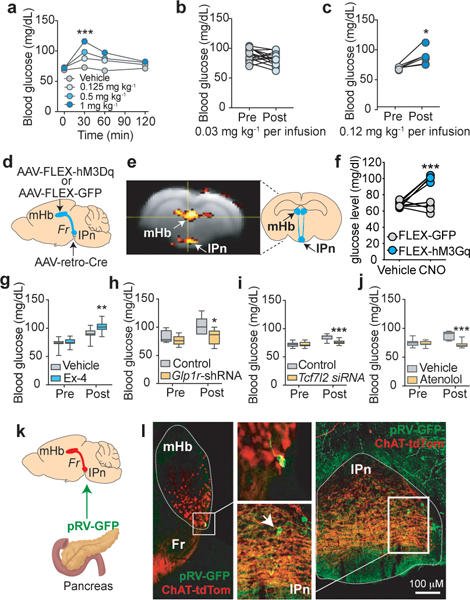
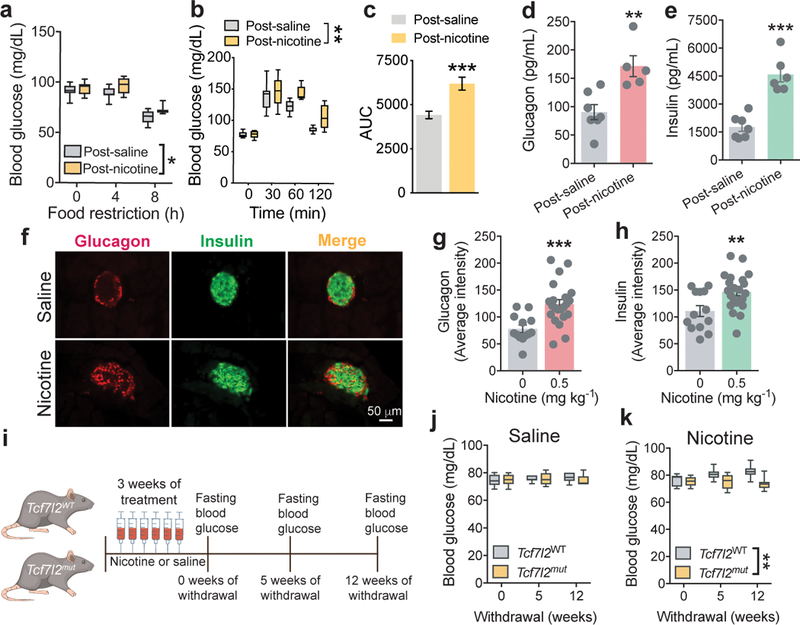
Diabetes is far more prevalent in smokers than non-smokers, but the underlying mechanisms of vulnerability are unknown. Here we show that the diabetes-associated gene Tcf7l2 is densely expressed in the medial habenula (mHb) region of the rodent brain, where it regulates the function of nicotinic acetylcholine receptors. Inhibition of TCF7L2 signalling in the mHb increases nicotine intake in mice and rats. Nicotine increases levels of blood glucose by TCF7L2-dependent stimulation of the mHb. Virus-tracing experiments identify a polysynaptic connection from the mHb to the pancreas, and wild-type rats with a history of nicotine consumption show increased circulating levels of glucagon and insulin, and diabetes-like dysregulation of blood glucose homeostasis. By contrast, mutant Tcf7l2 rats are resistant to these actions of nicotine. Our findings suggest that TCF7L2 regulates the stimulatory actions of nicotine on a habenula-pancreas axis that links the addictive properties of nicotine to its diabetes-promoting actions.


Conflict of interest statement

Competing interests statement

P.J.K. is co-founder of Eolas Therapeutics Inc., which has a incensing agreement with AstraZeneca to develop small molecule treatments for drug dependence. P.J.K. has research support from Eli Lilly and Takeda USA.

Figures

Extended data 1.
Extended data 1.. Generation of Tcf7l2 mutant rats.
a, Schematic of the Rattus norvegicus Tcf7l2 gene. Exons are spliced to generate Tcf7l2 mRNA (NCBI Reference Sequence: NM_001191052.1). Primers for genotyping and Sanger sequencing are indicated by arrows flanking exon 5. b, Sequencing chromatograph of the Tcf7l2 mutant allele. The site of the 169 bp deletion from exon 5 and the following intron is labelled. c, Illustration of Tcf7l2 wild-type protein, containing an N-terminal β-catenin binding domain (blue) and C-terminal DNA binding domain (red). Predicted open reading frames and truncated proteins generated from the Tcf7l2 mutant mRNA. Green regions on predicted truncated proteins denote ectopic amino acid sequences not found in wild-type Tcf7l2 protein. d, Genotyping of Tcf7l2WT and Tcf7l2mut rats: wildtype animal (+/+) with single band at 304 bp; heterozygous animal (+/−) with bands at 304 and 144 bp; and mutant animal (−/−) with a single band at 144 bp. Image is representative of genotyping results obtained for Tcf7l2WT and Tcf7l2mut rats used each experiment. e, Graphical representation of mHb in coronal slice of rat brain. Image adapted from the Allen Brain Reference Atlas. f, Nissl staining showed similar mHb volumes in Tc7l2WT and Tcf7l2mut rats. Image is representative of results obtained in 3 biologically independent animals from each genotype. g, Diffusion tensor imaging (DTI) tractography of the fasciculus retroflexus in Tcf7l2WT (n=3) and Tcf7l2mut (n=5) rats. h, Fractional anisotropy (FA) (± s.e.m.) showed bilateral similar integrity (left and right sides) of the fasciculus retroflexus in Tcf7l2WT (n=3) and Tcf7l2mut (n=5) rats; Genotype: F (1, 6)=0.000003; P=0.99; Brain side: F (1, 6) = 2.562, p=0.16; Genotype x Brain side: F (1, 6) = 0.0007, p=0.98. i, The frequency at different steps of positive current used to calculate the slope of the input-output curve from dorsal mHb neurons. Example traces showing typical current steps at −20, 0 and 40 pA in dorsal mHb neurons from Tcf7l2WT, and Tcf7l2mut rats. j, Input-output curve (mean ± s.e.m.) in dorsal mHb neurons from Tcf7l2WT, and Tcf7l2mut (n=16 cells from 5 rats) rats. k, The frequency at different steps of positive current used to calculate the slope of the input-output curve from ventral mHb neurons. l, Input-output curve (mean ± s.e.m.) in ventral mHb neurons from Tcf7l2WT and Tcf7l2mut (n=16/5) rats. m, Input resistance (mean ± s.e.m.) from mHb neurons from Tcf7l2WT (13 cells from 4 rats) and Tcf7l2mut (16/5) rats; p=0.1036, unpaired two-tailed t-test. n, Afterhyperpolarization (mean ± s.e.m.) in mHb neurons from Tcf7l2WT (13/4) and Tcf7l2mut (16/5) rats; P=0.3043, unpaired two-tailed t-test. o, Sag current (mean ± s.e.m.) in mHb neurons Tcf7l2WT (13/4) and Tcf7l2mut (17/5) rats; p=0.1386, unpaired two-tailed t-test. p, Total distance traveled (mean ± s.e.m.) by drug-naive Tcf7l2WT (n=6) and Tcf7l2mut (n=5) rats during a 60 min session. q, Total distance traveled (mean ± s.e.m.) by Tcf7l2WT (n=6) and Tcf7l2mut (n=5) rats after daily saline or nicotine (0.4 mg kg−1) injections (15 min pretreatment time). r, Responding for the training dose of nicotine (0.03 mg/kg/inf) (mean ± s.e.m.) was assessed in a group of Tcf7l2WT (n=9) and Tcf7l2mut (n=11) rats on day 1 and day 35 of access. Nicotine responding was similar between the of Tcf7l2WT and Tcf7l2mut rats on day 1 of access, but Tcf7l2mut rats escalated their intake such that such that there responding was higher that on day 35 compared with Tcf7l2WT rats, and compared with their own intake on day 1 (F(1, 18) = 30.8, ****p<0.0001, interaction effect between Genotype and Session in two-way ANOVA). Box plot shows min-max range.
Extended data 2.
Extended data 2.. CRISPR cleavage of Tcf7l2.
a, Exon diagram of mouse Tcf7l2 with the two pertinent domains highlighted and the sgRNA targeting locus. b, Bioinformatic comparison of the 5 different sgRNAs tested against Tcf7l2. MM = mismatches. c, Genomic cleavage percentage (mean ± s.e.m.) in N2A cells of the 5 sgRNAs targeted against Tcf7l2. Data represent n=3 biologically independent samples. d, T7-endonuclease-based assay illustrating intact PCR and cleaved bands of Tcf7l2 via CRISPR gene editing. Observations are from a single experiment. e, dTomato expression in N2A cells 48 h following transduction of the AAV carrying sgRNA against Tcf7l2 (AAV:ITR-U6-sgRNA(Tcf7l2)-pCBh-dTomato-WPRE-hGHpA-ITR). Data are representative of three biologically independent samples. f, Relative expression of Tcf7l2 transcripts (mean ± s.e.m.) in the N2A cells transfected with (AAV:ITR-U6-sgRNA(Tcf7l2 or eGFP)-pCBh-dTomato-WPRE-hGHpA-ITR) and AAV-CMV-spCas9 (Vector Biolabs, PA, USA). ***P<0.001, unpaired two-tailed t-test. Data represent n=5 biologically independent samples for each gRNA. g, Relative mRNA expression of habenular Tcf7l2 (mean ± s.e.m.) 6 weeks after viral stereotaxic injections of AAV:ITR-U6-sgRNA(eGFP or Tcf7l2)-pCBh-dTomato-WPRE-hGHpA-ITR or AAV2-hSyn1-WPRE-iCre into the mHb of Rosa26LSL-spCas9-eGFP mice. Data represent n=4 biologically independent samples for each gRNA. h, In vivo estimation of genomic cleavage of habenular Tcf7l2 (mean ± s.e.m.) 6 weeks following viral stereotaxic injection of AAV:ITR-U6-sgRNA(eGFP or Tcf7l2)-pCBh-dTomato-WPRE-hGHpA-ITR and AAV2-hSyn1-WPRE-iCre in Rosa26LSL-spCas9-eGFP mice. Genomic cleavage efficiency was estimated by average re-annealed mismatches in a T7 endonuclease assay. ***P<0.001, unpaired two-tailed t-test. Data represent n=3 biologically independent animals for each gRNA. i, Left panels: Representative DAPI-counterstained brain slice showing Cas9-eGFP (green) and Tcf7l2-gRNA (red) targeted to the mHb of LSL-spCas9-eGFP mice. Right panel: Whole image of brain slice from which left panels are derived. Representative result from n=3 mice. j, Medial habenula from Rosa26LSL-spCas9-eGFP mice injected with AAV-sgRNA-eGFP (n=6 independent mice) or AAV-sgRNA-Tcf7l2 (n=7 independent mice) was dissected and DNA amplicons of targeted region of Tcf7l2 sequenced. Percentage of indels (± s.e.m.) detected in the targeted region of Tcf7l2 is shown. ****P<0.0001, unpaired two-tailed t-test. Coronal brain image adapted from the Allen Brain Reference Atlas. k, Donut graph showing Cas9-induced modifications to Tcf7l2 in mHb of Rosa26LSL-spCas9-eGFP mice treated with AAV-sgRNA-Tcf7l2 (percental of total amplicons sequenced). A total of 13 amplicons (n=6 from AAV-sgRNA-eGFP-treated mice and n=7 from AAV-sgRNA-Tcf7l2-treated mice) were sequenced.
Extended data 3.
Extended data 3.. Mechanism by which Tcf7l2 regulates nAChR function.
a, Effects of intra-mHb infusion of vehicle or Ex-4 (12.5, 100 nM) on nicotine intake (mean ± s.e.m.) in rats (n=10); F(1.696, 15.26) = 38.3, p<0.0001, one-way repeated measures ANOVA; **p<0.01, ***p<0.001, Bonferroni’s multiple comparisons test). b, Effects of intra-mHb infusion of vehicle or Ex-4 (100 nM) on the latency (mean ± s.e.m.) to earn the first and second nicotine infusion of a self-administration session in rats (n= 10); F (1, 29)=311.4, p<0.0001, main effect of Infusion number; F (1, 29) = 125.4, p<0.0001, main effect of Ex-4; F (1, 29) = 126.5, ****p<0.0001, interaction effect; two-way ANOVA). c, Numbers of animals (n=10 in total) that responded for the first and second nicotine infusion of a self-administration session after intra-mHb infusion of vehicle or Ex-4 (12.5, 100 nM). d, Effects of intra-mHb infusion of vehicle or rDKK1 (100 ng/side) on nicotine intake (mean ± s.e.m.) in rats (n=11); p=0.45; unpaired two-tailed t-test. e, Effects of intra-mHb infusion of vehicle or XAV939 (12.5 ng/side) on nicotine intake (mean ± s.e.m.) in rats (n=10); p=0.29; unpaired two-tailed t-test. f, Effects of intra-mHb infusion of vehicle or insulin (12.5 ng/side) on nicotine intake (mean ± s.e.m.) in rats (n=13); p=0.29; unpaired two-tailed t-test. LiCl (g) and CA-β-catenin (h), but not nicotine (i), increased the GFP relative to mCherry expression (mean ± s.e.m.) in PC12 cells transfected with the 7xTcf-eGFP//SV40-mCherry (7TGC) Tcf7l2 reporter. Data reflect results from two independent experiments. j, Levels of β-catenin phosphorylated at serine residue 675 or 552 (mean ± s.e.m.) in rat PC12 cells after forskolin, Wnt3a or nicotine treatment. Data reflect results from two independent experiments. k, LacZ expression (mean ± s.e.m.) in the mHb in the mHb of BAT-GAL β-galactosidase reporter mice after nicotine injection. Data reflect results from two independent animals in each group. l, Expression levels of Tcf7l2 (~69 kD) in the habenula were measured by Western blotting in rats that responded for intravenous nicotine infusions (0.18 mg kg−1 per infusion; n=12) or food rewards (n=12). Each lane contains pooled tissues from n=3 animals. Experiment was performed on a single occasion. For uncropped gel image, see Supplementary Figure 1. m, siRNA-mediated knockdown of Tcf7l2 attenuated intracellular calcium transients (mean ± s.e.m.) induced by nicotine (20 nM-320 μM) in HEK cells heterologously expressing α5α4β2 nAChRs. Two-way RM ANOVA; siRNA: F(1, 4)= 63.38, P<0.005; Nicotine: F(15, 60)=1388, P<0.0001; siRNA x Nicotine: F(15, 60)=20.89, ***P<0.0001; Bonferroni post hoc test after interaction effect in two-way ANOVA. Representative result from three experiments. n, 86Rb+ efflux (mean ± s.e.m.) from synaptosomes generated from IPn tissues derived from Tcf7l2WT (n=6) and Tcf7l2mut (n=6) rats. F(1,39)=4.267, *p=0.045; Shift in EC50 between genotypes using comparison of fits in a non-linear fit model. o, Pharmacologically isolated nAChR currents (normalized; ± SEM) evoked by nicotine (0.1 Hz application) in mHb neurons from wild-type rats (n=3 cells from 1 rat) were rapidly and completely blocked by bath application of mecamylamine (10 μM); F (1.335, 2.670)=332.5; P<0.001; one-way repeated measures ANOVA. p, Baseline nAChR currents (mean ± s.e.m.) in mHb neurons from Tcf7l2WT (n=13 cells/4 rats) and Tcf7l2mut (n=15 cells/4 rats) rats. P = 0.8180, unpaired two-tailed t-test. q, nAChR current decay time (mean ± s.e.m.) after nicotine stimulation (0.1 Hz) before and after nicotine (1 Hz) induced desensitization in mHb neurons from Tcf7l2WT (n=13 cells/4 rats) and Tcf7l2mut (n=9 cells/4 rats) rats; P = 0.7133, unpaired two-tailed t-test. r, Slope of nAChR current decay (mean ± s.e.m.) after nicotine stimulation (0.1 Hz) before and after nicotine (1 Hz) induced desensitization in mHb neurons from Tcf7l2WT (n=13 cells/4 rats) and Tcf7l2mut (n=9 cells/4 rats) rats; P=0.645, unpaired two-tailed t-test.
Extended data 4.
Extended data 4.. Genes regulates by Tcf7l2 in the mHb.
a, Quantitative real-time PCR analysis Akap9 transcript levels (mean ± s.e.m.) in the mHb of Tcf7l2WT (n=8) and Tcf7l2mut (n=7) rats; and Arhgap5 transcript levels (mean ± s.e.m.) in mHb of Tcf7l2WT (n=5) and Tcf7l2mut (n=7) rats; ***P<0.001, unpaired two-tailed t-test. b, Quantitative real-time PCR analysis of α5, α3 and β4 nAChR subunit expression (mean ± s.e.m.) in the mHb of Tcf7l2WT (n=5) and Tcf7l2mut (n=8) rats. c, Top 15 most abundantly expressed genes in the mHb of Tcf7l2WT rats that show differential downregulation in the mHb of Tcf7l2mut rats (n=9 animals per genotype). Genes are organized in descending order according to the baseline expression levels in Tcf7l2WT rats. BaseMean, mean of normalized counts for all samples; log2FoldChange, log2 fold change of down-regulated gene expression in mHb Tcf7l2mut rats compared with Tcf7l2WT rats; lfcSE, standard error of log2 fold change; stat, Wald Chi-Squared Test) of normalized counts for gene transcript in Tcf7l2mut rats versus with Tcf7l2WT rats; pval, uncorrected Wald test p value; padj, p value adjusted for multiple testing using Benjamini-Hochberg to estimate the false discovery rate. Knockdown of PAFAHIB1 (d), NDFIIP1 (e), ARHGAP5 (f), HNRNPU (g), or AKAP9 (h), mRNA transcripts using a pool of validated siRNAs had no effects on nicotine-stimulated increases in [Ca2+]I (mean ± s.e.m.) in HEK cells stably expressing α5α4β2 nAChRs. Data represent n=3 biologically independent samples.
Extended data 5.
Extended data 5.. Tcf7l2 regulates cAMP signaling in PC-12 cells.
a, Expression of dnTcf7l2 in PC12 cells reduced the activity (± s.e.m.) of a cAMP-responsive luciferase reporter (EVX-1 luciferase). ***P<0.001, unpaired two-tailed t-test. Data represent biologically independent samples from cells transfected with mCherry (n=7) or dnTcf7l2 (n=8). RFU, relative fluorescent units; FFL, firefly luciferase; RL, renilla luciferase. b, dnTcf7l2 reduced baseline and Ex-4-induced increases in a cAMP-responsive reporter assay in PC-12cells; F(1, 10)=19.16, **p<0.0014, main effect of dnTcf7l2; F(1, 10) = 21.31, p=0.001, main effect of Ex-4; F(1, 10) = 0.027, p=0.87, dnTcf7l2 x Ex-4 interaction; two-way ANOVA. Data represent biologically independent samples from control cells (n=3 samples), control cells treated with exendin-4 (n=3 samples), cells transfected dnTcf7l2 (n=4 samples) and cells transfected dnTcf7l2 and treated with exendin-4 (n=4 samples). c, dn-Tcf7l2 reduced baseline and Ex-4-evoked increases in EVX-1-luciferase in INS-1 cells, an immortalized rat pancreatic β cell line that constitutively expresses GLP-1 receptors. Data represent results from a single experiment. d, cAMP content (mean ± s.e.m.) of mHb, IPn and hippocampus (hipp) were analyzed in tissues from Tcf7l2WT and Tcf7l2mut rats. Each sample contained mHb tissue from three animals, and data are from four independent samples were analyzed for a total of 12 animals per genotype. e, Vector map for the pGF-CREB-mCMV-dscGFP-P2A-luciferase (CREB reporter) lentivirus. f, Brain slices containing the mHb from Tcf7l2WT and Tcf7l2mut rats injected with CREB reporter lentivirus into mHb and injected with luciferin just before brain collection. g, Exendin-4 increased luciferase activity (mean ± s.e.m.) in mHb of Tcf7l2WT rats (n=3) but not Tcf7l2mut rats (n=4). F (1, 11) = 9.398, p=0.0107, main effect of Genotype; F (6, 66) = 7.945, ***p<0.0001, interaction effect between Genotype and Exendin-4; Two-way repeated-measures ANOVA. h, Pre-incubation (30 min) of HEK cells stably expressing α5α4β2 nAChRs with nicotine (0.1–10 μM) decreased the ability of acetylcholine (0.1 mM) to stimulate increases in [Ca2+]I (mean ± s.e.m.); F (3, 12) = 188.1, p<0.0001, main effect of Nicotine on one-way ANOVA.. Data represent n=4 independent experiment. i, 8-Br-cAMP (100–500 μM) attenuated the inhibitory effects of nicotine (0.1 μM) preincubation (30 min) on acetylcholine (0.1 mM) evoked in increases in [Ca2+]I (mean ± s.e.m.) in α5α4β2 nAChR HEK cells; F (1, 24) = 41.20, p<0.0001, main effect of cAMP in two-way ANOVA. Data represent n=5 independent experiments.
Extended data 6.
Extended data 6.. Hyperglycemic actions of nicotine.
a, Venn diagram of differentially upregulated genes in the hippocampus, mHb and IPn of Tcf7l2mut rats compared with Tcf7l2WT rats. b, KEGG analysis of differentially upregulated genes identified processes relevant to glucose metabolism as those most likely to be perturbed in the mHb of Tcf7l2mut rats (n=9) compared with Tcf7l2WT rats (n=9). Fisher exact test. c, Blood glucose (mean ± s.e.m.) was measured before (T0) and 30 min after (T30) rats (n=7) were injected with saline or nicotine (1 mg kg−1); F (1, 13) = 52.3, ***p<0.0001, interaction effect between Nicotine and Time; Two-way repeated-measures ANOVA. d, Oxycodone (2.5 mg kg−1) or cocaine (20 mg kg−1) injection had no effects on blood glucose (mean ± s.e.m.) in rats (n=36). e, Chrna5-Cre mice were injected into the IPn with FLEX-GFP (n=3) or FLEX-hM3Dq-mCherry (n=9). Image adapted from the Allen Brain Reference Atlas. f, Blood glucose (mean ± s.e.m.) was measured in both groups of mice before and 30 min after injection of CNO (1 mg kg−1); **P<0.0051, unpaired two-tailed t-test. g, Tcf7l2 mRNA levels (mean ± s.e.m.) were reduced in the mHb of rats after shRNA-mediated knockdown of Glpr1 transcript expression. **P<0.0051, unpaired two-tailed t-test. h, Atenolol abolished the hyperglycemic response to experimenter-administered nicotine injection (1 mg kg−1) in rats (n=8): Atenolol, F (3, 25) = 43.54, p<0.0001; Time, F(2.406, 60.15) = 48.69, p<0.0001; Atenolol x Time interaction F (9, 75) =26.88; ***p<0.0001; two-way ANOVA. i, ICI118,551 abolished the elevations in blood glucose (mean ± s.e.m.) induced by experimenter-administered nicotine injection (1 mg kg−1) in rats (n=8): Nicotine, F (1, 7) = 50.83, p=0.002; ICI118,551, F(1, 7) = 13.17, p=0.0084; ICI118,551 x Nicotine interaction F (1, 7) = 27.75, **p=0.0012; two-way repeated-measured ANOVA. j, Atenolol abolished the elevations in blood glucose (mean ± s.e.m.) induced by CNO (3 mg kg−1) in rats (n=8) expressing FLEX-hM3Dq in the mHb-IPn circuit. CNO, F (1, 8) = 213.0, p<0.0001; Atenolol, F (1, 8) = 27.00, p=0.0008; CNO x Atenolol interaction F (1, 8) = 255.5, ***p<0.0001; two-way repeated-measures ANOVA. k, Immunostaining for insulin (left panels), glucagon (middle panels) and their overlap (right panels) in mice treated acutely with saline (upper panels; n=3) or nicotine (0.5 mg kg−1; lower panels; n=3). Quantification of insulin intensity (l), insulin relative area (m), glucagon intensity (n) and glucagon relative area (o) (mean ± s.e.m. in all cases) in pancreatic islets from the saline (n=3)- and nicotine (n=3)-treated mice; **P=0.0059, ***p<0.001 t-test, unpaired two-tailed t-test. Image is representative of results obtained in from 3 biologically independent animals in each treatment group.
Extended data 7.
Extended data 7.. Chemogenetic stimulation of the habenula.
a, Rats were injected with AAV-retro-Cre into IPn and FLEX-GFP or FLEX-hM3Dq-mCherry into mHb. mCherry-positive cells were detected in mHb, confirming that virus targeting was effective. b, CNO (10 μM) had no effects on the relative spike frequency (mean ± s.e.m.) of mCherry-negative cells (n=4 cells/2 rats). c, CNO (10 μM) increased the relative spike frequency (mean ± s.e.m.) of mCherry-positive cells (n=4 cells/3 rats); *p=0.0124, unpaired two-tailed t-test. d, Nicotine (1 μM) increased the relative spike frequency (mean ± s.e.m.) of mHb neurons by a magnitude similar to that seen in mCherry-positive neurons after CNO treatment (n=6 cells/3 rats). *p=0.042, unpaired two-tailed t-test.
Extended data 8.
Extended data 8.. pRV mapping of polysynaptic projections from brain to pancreas and liver.
a, c Images of a pRV-GFP-labelled cells (indicated by white arrows) and fibers in the mHb. Fr = fasciculus retroflexus. b, d Representative images of pRV-GFP-labelled IPn neurons (indicated by white arrows). e, Images of GFP-labelled cells in hypothalamus, cortex, substantia nigra and nucleus of the solitary tract (NTS) after pancreas injection of pRV-GFP. r, Images of a GFP-labelled cells in hypothalamus, ventral tegmental area (VTA) and NTS after liver injection of pRV-GFP. Note the absence of GFP-positive cells in the medial habenula. Images are representative of results obtained from 3 separate experiments.
Extended data 9.
Extended data 9.. Consequences of hyperglycemic actions of nicotine.
a, Effects of glucose (1 mg kg−1, IV) on nicotine (0.03 mg kg−1 per infusion) intake (mean ± s.e.m.) in rats (n=15). b, Effects of glucose (1 mg kg−1, IV) on nicotine (0.12 mg kg−1 per infusion) intake (mean ± s.e.m.) in rats (n=16). c, Effects of glucose (2 mg kg−1, PO) on nicotine (0.12 mg kg−1 per infusion) intake (mean ± s.e.m.) in rats (n=16). d, Effects of glucagon (0.2 mg kg−1, IV) on nicotine (0.12 mg kg−1 per infusion) intake (mean ± s.e.m.) in rats (n=5). e, Atenolol (10 mg kg−1) delivered prior to the self-administration on three consecutive days did not alter nicotine (0.12 mg kg−1 per infusion) intake (mean ± s.e.m.) in rats (n=8). f, Scatterplots of average TRAP IP samples from sucrose-drinking (y axis; n=28) versus IP samples from sucrose-naïve (x axis; n=8) ChATDW167 mice representing increased (>0.5 log2 fold change, magenta) or decreased (less than −0.5 log2 fold change, blue) levels of transcripts undergoing translation (tissues from n=4 mice were pooled for each sample; 7 samples from sucrose-drinking and 2 samples from sucrose-naïve mice were used). Differentially expressed genes were identified by performing a negative binomial test using DESeq2, with default settings. Significant P values were corrected to control the false discovery rate of multiple testing according to the Benjamini–Hochberg procedure at 0.05 threshold and minimum threshold of 0.6 log2 fold change. g, Expression levels (z-score transformed normalized counts) of the top 50 genes impacted by sucrose consumption in mHb cholinergic neurons. h, KEGG analysis of differentially upregulated genes in the mHb of ChATDW167 mice described in panel f identified pathways likely to be impacted in the mHb by sucrose consumption. Fisher exact test. i, KEGG analysis of differentially downregulated genes in the mHb of ChATDW167 mice described in panel f identified pathways likely to be impacted in the mHb by sucrose consumption. Fisher exact test. j, The frequency of action potentials (mean ± s.e.m.) in mHb neurons was unaltered by elevating the glucose concentrations in the extracellular solution from 12.5 to 30 mM (n=6 cells from 3 rats). k, Maintaining glucose concentration in artificial cerebrospinal fluid (aCSF) in the extracellular solution at 12.5 mM did not alter the magnitude of nicotine-evoked nAChR currents (mean ± s.e.m.) in mHb neurons (n=6 cells from 3 rats). l, Increasing the glucose concentration in the extracellular solution from 12.5 to 30 mM decreased the magnitude of nicotine (1 μM) evoked nAChR currents (mean ± s.e.m.) in mHb neurons (n=6 cells from 3 rats). *P<0.0121, unpaired two-tailed t-test. m, Blood glucose levels (mean ± s.e.m.) measured in rats 24 h after their final nicotine (0.12 mg kg−1 per infusion; n=7) or saline (n=8) self-administration session; *P<0.0223, unpaired two-tailed t-test. n, Blood glucose levels (mean ± s.e.m.) measured in rats 6 weeks after their final nicotine (0.12 mg kg−1 per infusion; n=7) or saline (n=8) self-administration session. *P<0.0371, unpaired two-tailed t-test. o, Body weights (mean ± s.e.m.) in post-saline (n=8) and post-nicotine rats (n=6) measured 6 weeks after their final self-administration session. p, Fasting blood glucose levels (mean ± s.e.m.) in Tcf7l2WT (n=14 in total) and Tcf7l2mut (n=14 in total) rats measured before chronic saline or nicotine injections commenced. q, Circulating levels (mean ± s.e.m.) of glucagon in nicotine-naïve Tcf7l2WT (n=7) and Tcf7l2mut (n=7) rats. r, Circulating levels of insulin (mean ± s.e.m.) in nicotine-naïve Tcf7l2WT (n=7) and Tcf7l2mut (n=7) rats. s, Circulating glucagon levels (mean ± s.e.m.) in Tcf7l2WT (n=9 in total) and Tcf7l2mut (n=10 in total) rats measured before chronic saline or nicotine injections ended; F(1, 15) = 4.606), *p<0.0486, interaction effect of Genotype x Nicotine in two-way ANOVA.
Extended data 10.
Extended data 10.. Proposed mechanism through which Tcf7l2 regulates the motivational properties of nicotine and its disruptive effects on blood glucose homeostasis.
Shown is a representation of a mHb neuron projecting to the IPn (both in blue), via the fasciculus retroflexus, and to the pancreas via a polysynaptic pathway. The mHb neurons expresses nAChRs that are activated by nicotine and that undergo nicotine-induced desensitization. In Tcf7l2WT rats, nAChRs rapidly recover from desensitization by a process involving cAMP signaling. In Tcf7l2mut rats, cAMP signaling is compromised, resulting in persistently desensitized nAChRs and diminished sensitivity of mHb neurons to nicotine. When mHb neurons are activated by nicotine, IPn neurons are stimulated by mHb-derived acetylcholine and glutamate. This triggers nicotine avoidance and a hyperglycemic response, both of which are attenuated in Tcf7l2mut rats. After chronic exposure to the hyperglycemic actions of nicotine, circulating levels of the pancreas-derived hormones glucagon and insulin are elevated, resulting in a diabetes-like disruption of glucose homeostasis. This diabetes-promoting action of nicotine is also attenuated in Tcf7l2mut rats.
Figure 1.
Figure 1.. Tcf7l2 is enriched in medial habenula and regulates nicotine intake.
a, BAC-TRAP from ChATDW167 mice showed that Tcf7l2 is highly expressed in habenular cholinergic cells of mice compared with total habenular input (from n=9 mice for IP; n=5 for mice Input). b, Example of RNA-seq reads from habenula of ChATDW167 TRAP mice aligned to the Tcf7l2 gene; observation replicated in subsequent TRAP experiments. c, RNA-Seq showed that Tcf7l2 reads (mean ± S.E.M.) are higher in the mHb (from n=9 mice) than cortex (n=3 mice), hippocampus (n=3 mice) or striatum (n=3 mice) of mice (F3,14=23.6, P<0.001; One-way ANOVA; ***P<0.001 compared with each of the other brain regions, Bonferroni’s multiple comparisons test). d, Immunofluorescence detection of Tcf7l2 (green) in the mHb of ChAT-tdTom (red) reporter mice. e, β-Gal activity in the mHb of BAT-GAL reporter mice (seen independently in n=3 mice). f, Strategy for deleting the β-catenin binding domain of the Tcf7l2 gene using zinc finger nucleases in rats. g, Responding for nicotine (mean ± S.E.M.) was increased in Tcf7l2mut rats (n=30) compared with Tcf7l2WT rats (n=22) (F(1, 236) = 32.75, ***p<0.0001, main effect of Genotype in Two-way ANOVA). h, Total nicotine intake (mean ± S.E.M.) was increased in Tcf7l2mut rats compared with Tcf7l2WT rats (F (1, 193) = 6.72; *p=0.0102, main effect of Genotype in Two-way ANOVA). i, Responding for food rewards (mean ± S.E.M.) was similar in Tcf7l2mut and Tcf7l2WT rats (P=0.61, unpaired two-tailed t-test).
Figure 2.
Figure 2.. Tcf7l2 regulates habenular sensitivity to nicotine.
a, CRISPR-mediated cleavage of Tcf7l2 lowers Tcf7l2 mRNA in N2a cells (from three independent experiments); ***P<0.001, unpaired two-tailed t-test. b, Tcf7l2 Cleavage decreases Tcf7l2 transcriptional activity (from three independent experiments); *P=0.014, unpaired two-tailed t-test. c, Graphical representation showing delivery of Cre-expressing and sgRNA-expressing viruses to mHb. d, DAPI-counterstained brain slice from a ROSALSL-spCas9-eGFP mouse showing GFP- and tdTom-labelled cells in mHb. Representative result from n=3 mice. e, Responding for nicotine (mean ± S.E.M.) was increased in ROSALSL-spCas9-eGFP mice treated with AAV-sgRNA-Tcf7l2 (n=8) compared with those treated with AAV-sgRNA-eGFP (n=7) (F (1, 39) = 34.2; ***P<0.0001, main effect in Two-way ANOVA). f, Total nicotine intake (mean ± S.E.M.) was increased in ROSALSL-spCas9-eGFP mice treated with AAV-sgRNA-Tcf7l2 compared with those treated with AAV-sgRNA-eGFP (F (1, 13) = 16.98; ***P<0.005, main effect in Two-way ANOVA). g, Responding for food rewards (mean ± S.E.M.) was similar in ROSALSL-spCas9-eGFP mice treated with AAV-sgRNA-Tcf7l2 (n=8) compared with those treated with AAV-sgRNA-eGFP (n=7). h, Graphical representation of rat brain showing cannula above mHb (upper) and coronal brain slice showing accurate targeting of dye into mHb. i, Confirmation of siRNA-mediated Tcf7l2 knockdown using real-time PCR (n=5 biologically independent control rats; n=6 biologically independent siRNA rats). ***P=0.0007, unpaired two-tailed t-test. j, Tcf7l2 knockdown in mHb increased nicotine (0.03 mg kg−1 per infusion) intake (mean ± S.E.M.; n=8 biologically independent rats) (F (2, 26) = 5.03; *P=0.0142; interaction effect in two-way ANOVA). k, siRNA-mediated knockdown of Tcf7l2 in mHb increased nicotine (0.12 mg kg−1 per infusion) intake (mean ± S.E.M.; n=7 biologically independent rats) (F (2, 22) = 7.52; *P=0.0007; interaction effect in two-way ANOVA). l, Graphical representation of angled brain slice containing the mHb, fasciculus retroflexus (Fr) and IPn (upper panel) and representative brain slice showing position of pipettes for nicotine delivery and recording (lower panel). m, Representative traces of sEPSCs recorded in IPn neurons from Tcf7l2WT and Tcf7l2mut rats after delivery of nicotine to mHb neurons. n, Nicotine-induced increases in sEPSCs frequency (mean ± S.E.M.) were lower in IPn of Tcf7l2mut rats compared with Tcf7l2WT rats (F (1, 16) = 8.08; *P=0.0118, interaction effect in Two-way ANOVA). o, Nicotine did not alter the amplitude of sEPSCs (mean ± S.E.M.) in IPn of Tcf7l2WT or Tcf7l2mut rats.
Figure 3.
Figure 3.. Tcf7l2 regulates habenular nAChR function.
a, Representation of recording sites in mHb (upper) and protocol for nicotine delivery (lower). Image adapted from the Allen Brain Reference Atlas. b, Relative nAChR-mediated currents (mean ± S.E.M.) in response to low (0.1 Hz; Pre), high (1 Hz), then low (0.1 Hz; Post) frequency nicotine (30 μM) pulses in mHb neurons from Tcf7l2WT (10 cells from 4 animals) and Tcf7l2mut (11 cells from 4 animals) rats (F (31, 558) = 5.42; ***P<0.001, interaction effect in Two-way ANOVA). Dotted lines identify time-points at which representative traces shown in panel c were collected. c, Representative nAChR current traces in mHb neurons from Tcf7l2WT and Tcf7l2mut rats evoked by nicotine before (Pre) and after (Post) high-frequency nicotine pulses to desensitize nAChRs. d, Heatmap of RNA-Seq expression data from the hippocampus, mHb and IPn of Tcf7l2WT and Tcf7l2mut rats (n=9 animals per genotype). Displayed are 600 most differentially expressed genes clustered according to brain region. Data are log transformed and z-scored (shown in scale). e, Venn diagram of differentially downregulated genes in the hippocampus, mHb and IPn. f, KEGG analysis of differentially downregulated genes suggests that cAMP signaling is likely to be perturbed in mHb of Tcf7l2mut rats (9 animals per genotype); Fisher exact test. g, Representation of nAChR in the closed (inactive) conformation, nicotine-induced stabilization of the open (active) confirmation, and entry into a desensitized state from which cAMP facilitates recovery. h, cAMP content of mHb tissues (mean ± S.E.M.) from Tcf7l2WT and Tcf7l2mut rats treated with PBS or Ex-4 (100 nM) (3 animals per replicate; 9 animals per genotype); (F (1, 8) = 13.08; **P=0.0068, interaction effect in Two-way ANOVA). i, Relative nAChR-mediated currents (mean ± S.E.M.) in response to low, high and then low frequency nicotine pulses from Tcf7l2WT (6 cells/4 animals), Tcf7l2mut (6 cells/3 animals) rats, Tcf7l2WT+8-Br-cAMP (200 μM) (6 cells/3 animals) and Tcf7l2mut+8-Br-cAMP (6 cells/4 animals) neurons. (F (31, 640) = 2.42; ***P<0.0001; interaction effect in Three-way ANOVA). j, Area under the curve (AUC) of nAChR recovery from desensitization from time of maximal desensitization (240 sec) to end of the recording period (840 sec) in mHb neurons from Tcf7l2WT and Tcf7l2mut rats; (F (1, 20) = 44.1; ***P<0.0001; interaction effect Two-way ANOVA). Data are mean (± S.E.M.) AUC from 6 Tcf7l2WT cells (from 3 animals) and 6 Tcf7l2mut cells (from 3 animals). k, Rolipram decreased nicotine intake (mean ± S.E.M.) in ROSALSL-spCas9-eGFP mice that received intra-mHb injections of AAV-sgRNA-Tcf7l2 (F (1, 9) = 20.9; ***P<0.0001; interaction effect in Two-way ANOVA; n=5 AAV-sgRNA-Tcf7l2 mice, n=6 AAV-sgRNA-eGFP mice).
Figure 4.
Figure 4.. Habenular Tcf7l2 regulates hyperglycemic response to nicotine.
a, Nicotine elevated fasting blood glucose in rats (F (9, 66) = 13; ***P<0.0001; interaction effect in Two-way ANOVA; n=8). b, Self-administration of the standard dose of nicotine (0.03 mg kg−1 per infusion) did not alter blood glucose levels in rats (n=15). c, Self-administration of a higher nicotine dose (0.12 mg kg−1 per infusion) elevated blood glucose in rats (n=6). **P=0.0092, two-tailed paired t-test. d, Graphical representation of rat brain showing strategy to chemogenetically stimulate the mHb-IPn circuit. Retro-AAV-Cre was delivered into the IPn and Cre-dependent FLEX-hM3Dq (n=5) or FLEX-GFP (n=5) was delivered into the mHb. e, Clozapine-N-oxide (CNO) (3 mg kg−1) increased activity of the mHb-IPn circuit of rats expressing FLEX-hM3Dq but not in those expressing FLEX-GFP, reflected by changes in BOLD signal measured by fMRI. Experiment was performed on a single occasion. Coronal brain image adapted from the Allen Brain Reference Atlas. f, CNO injection elevated fasting blood glucose levels in rats expressing FLEX-hM3Dq (n=5 rats) compared with those expressing FLEX-GFP (n=5 rats); F (1, 8) = 85.2; ***P<0.0001; interaction effect in Two-way ANOVA. g, Intra-mHb infusion of Ex-4 (100 ng) enhanced the hyperglycemic response to self-administered nicotine in rats (n=10); F (1, 21) = 8.39; **P=0.0086; interaction effect in Two-way ANOVA. Box plot shows min-max range. h, Knockdown of Glp1r transcripts in mHb abolished the hyperglycemic response to self-administered nicotine infusions in rats (n=6 per virus); F (1, 10) = 5.15; *P=0.0466; interaction effect in Two-way ANOVA. Box plot shows min-max range. i, Tcf7l2 knockdown in mHb abolished the hyperglycemic response to self-administered nicotine in rats (n=10); F (1, 18) = 18.6; ***P<0.001; interaction effect in Two-way ANOVA. Box plot shows min-max range. j, Atenolol abolished the hyperglycemic response to self-administered nicotine in rats (n=7); F (1, 12) = 19.8; ***P<0.001; interaction effect in Two-way ANOVA. Box plot shows min-max range. k, Graphical representation of strategy to trace polysynaptic inputs from the mHb-IPn circuit to the pancreas in ChAT-tdTom reporter mice. l, Image of a pRV-GFP-labelled cholinergic cell in the ventral region of the mHb, and pRV-GFP-labelled IPn neuron in close apposition to cholinergic fibers (red) from the mHb (inserts show magnified images). Representative result from two independent experiments.
Figure 5.
Figure 5.. Tcf7l2 regulates the diabetes-promoting actions of nicotine.
a, Blood glucose levels were assessed over 8 h of food restriction in rats with a history of self-administering saline (n=8) or nicotine (n=7); F (2, 26) = 71.1; P<0.0001, main effect of Time; F (1, 13) = 8.6; *P<0.05, main effect of Nicotine in Two-way ANOVA. Box plot shows min-max range. b, Glucose clearance was impaired in nicotine-experienced (n=6) compared with saline-experienced (n=8) rats in an oral glucose tolerance test (OGTT). Data are presented as change in blood glucose from time = 0 (F (1, 12) = 6.2; *P=0.0284, main effect in two-way ANOVA. c, Area under the curve (AUC) analysis (mean ± S.E.M.) of the time-course of glucose clearance in nicotine-experienced (n=6) and saline-experienced (n=8) rats in the OGTT. ***P=0.0007, unpaired two-tailed t-test. d, Circulating glucagon levels (mean ± S.E.M.) were elevated in post-nicotine rats (n=6) compared with post-saline rats (n=5). Data from biologically independent animals; **P=0.0042, unpaired two-tailed t-test. e, Circulating insulin levels (mean ± S.E.M.) were elevated in post-nicotine rats (n=6) compared with post-saline rats (n=6). Data from biologically independent animals; ***P<0.001, unpaired two-tailed t-test. f, Immunostaining for glucagon (left panels), insulin (middle panels) and their overlap (right panels) in mice treated chronically with saline (upper panels; n=3) or nicotine (0.5 mg kg−1; lower panels; n=3). Experiment was performed on a single occasion. g, Quantification of glucagon intensity (mean ± S.E.M.) in pancreatic islets from mice treated with saline (from 13 islets images in n=3 mice) or nicotine (from 22 islets images in n=3 mice); ***P=0.0006, unpaired two-trailed t-test. h, Quantification of insulin intensity (mean ± S.E.M.) in pancreatic islets from mice treated with saline (from 13 islets images in n=3 mice) or nicotine (from 22 islets images in n=3 mice); **P<0.006, unpaired two-trailed t-test. i, Graphical representation of experiment designed to test the effects of withdrawal from chronic nicotine injections on blood glucose in Tcf7l2WT and Tcf7l2mut rats. j, Fasting blood glucose levels (mean ± S.E.M.) were similar in Tcf7l2WT (n=6) and Tcf7l2mut (n=6) rats that were treated chronically with saline. Box plot shows min-max range. k, Fasting blood glucose levels (mean ± S.E.M.) were elevated in Tcf7l2WT (n=6) compared with Tcf7l2mut (n=8) rats after chronic nicotine (1 mg kg−1) treatment; F (1, 12) = 10.4; **P=0.0073, main effect in Two-way ANOVA. Box plot shows min-max range.

Comment in

References

    1. Stolerman IP & Jarvis MJ The scientific case that nicotine is addictive. Psychopharmacology (Berl) 117, 2–10; discussion 14–20 (1995). - PubMed
    1. Maskos U et al. Nicotine reinforcement and cognition restored by targeted expression of nicotinic receptors. Nature 436, 103–107, doi:10.1038/nature03694 (2005). - DOI - PubMed
    1. Fowler CD, Lu Q, Johnson PM, Marks MJ & Kenny PJ Habenular alpha5 nicotinic receptor subunit signalling controls nicotine intake. Nature 471, 597–601, doi:10.1038/nature09797 (2011). - DOI - PMC - PubMed
    1. Fowler CD & Kenny PJ Nicotine aversion: Neurobiological mechanisms and relevance to tobacco dependence vulnerability. Neuropharmacology 76 Pt B, 533–544, doi:10.1016/j.neuropharm.2013.09.008 (2014). - DOI - PMC - PubMed
    1. Tuesta LM et al. GLP-1 acts on habenular avoidance circuits to control nicotine intake. Nat Neurosci 20, 708–716, doi:10.1038/nn.4540 (2017). - DOI - PMC - PubMed

Publication types

MeSH terms