

In vitro Characterization of Gut Microbiota-Derived Bacterial Strains With Neuroprotective Properties
- PMID: 31619962
- PMCID: PMC6763572
- DOI: 10.3389/fncel.2019.00402
In vitro Characterization of Gut Microbiota-Derived Bacterial Strains With Neuroprotective Properties
Abstract
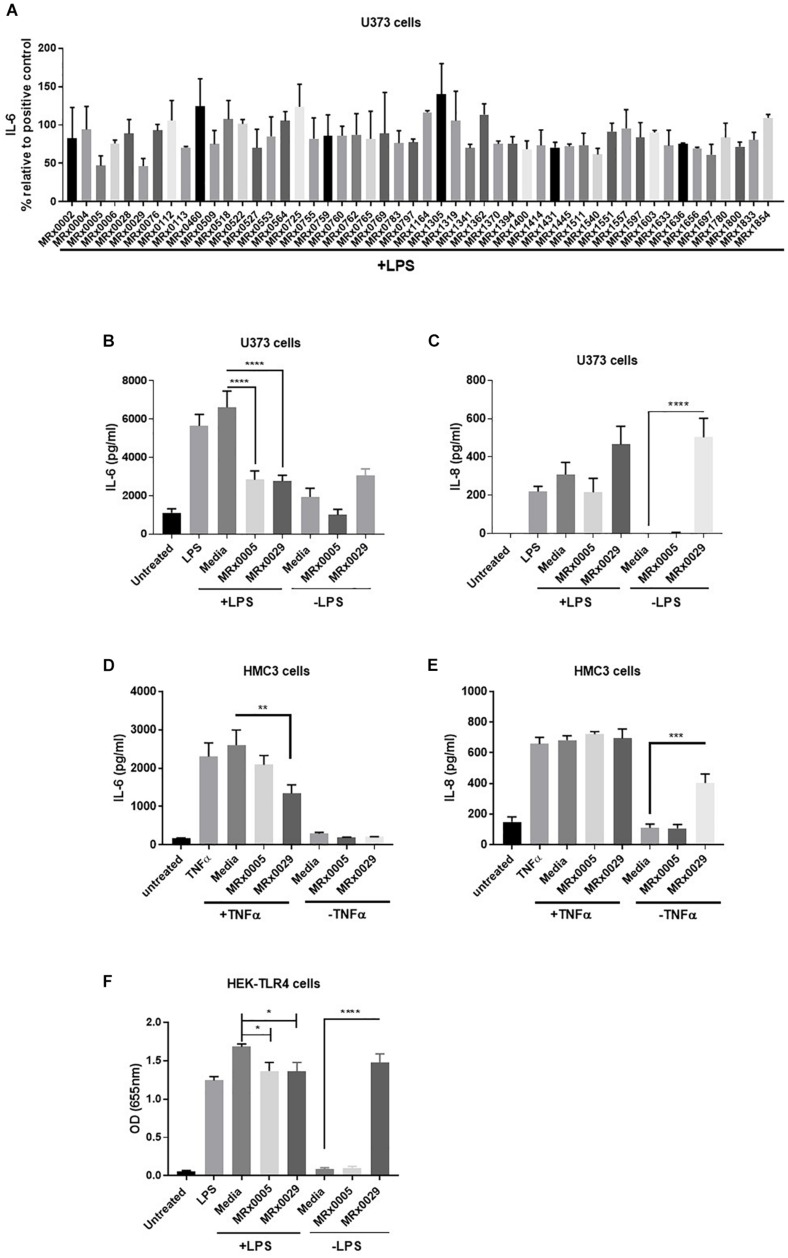
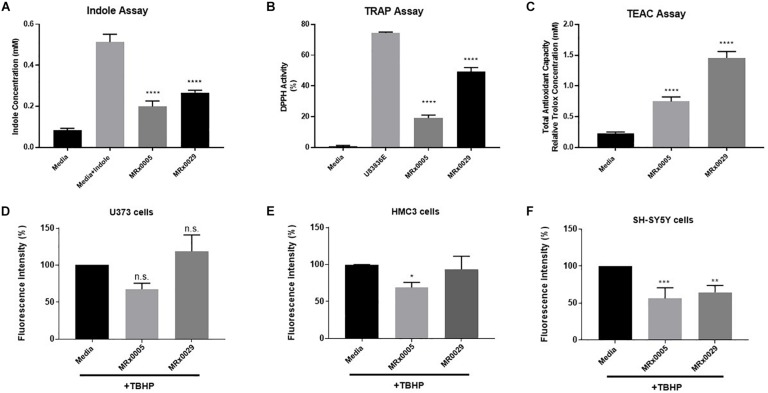
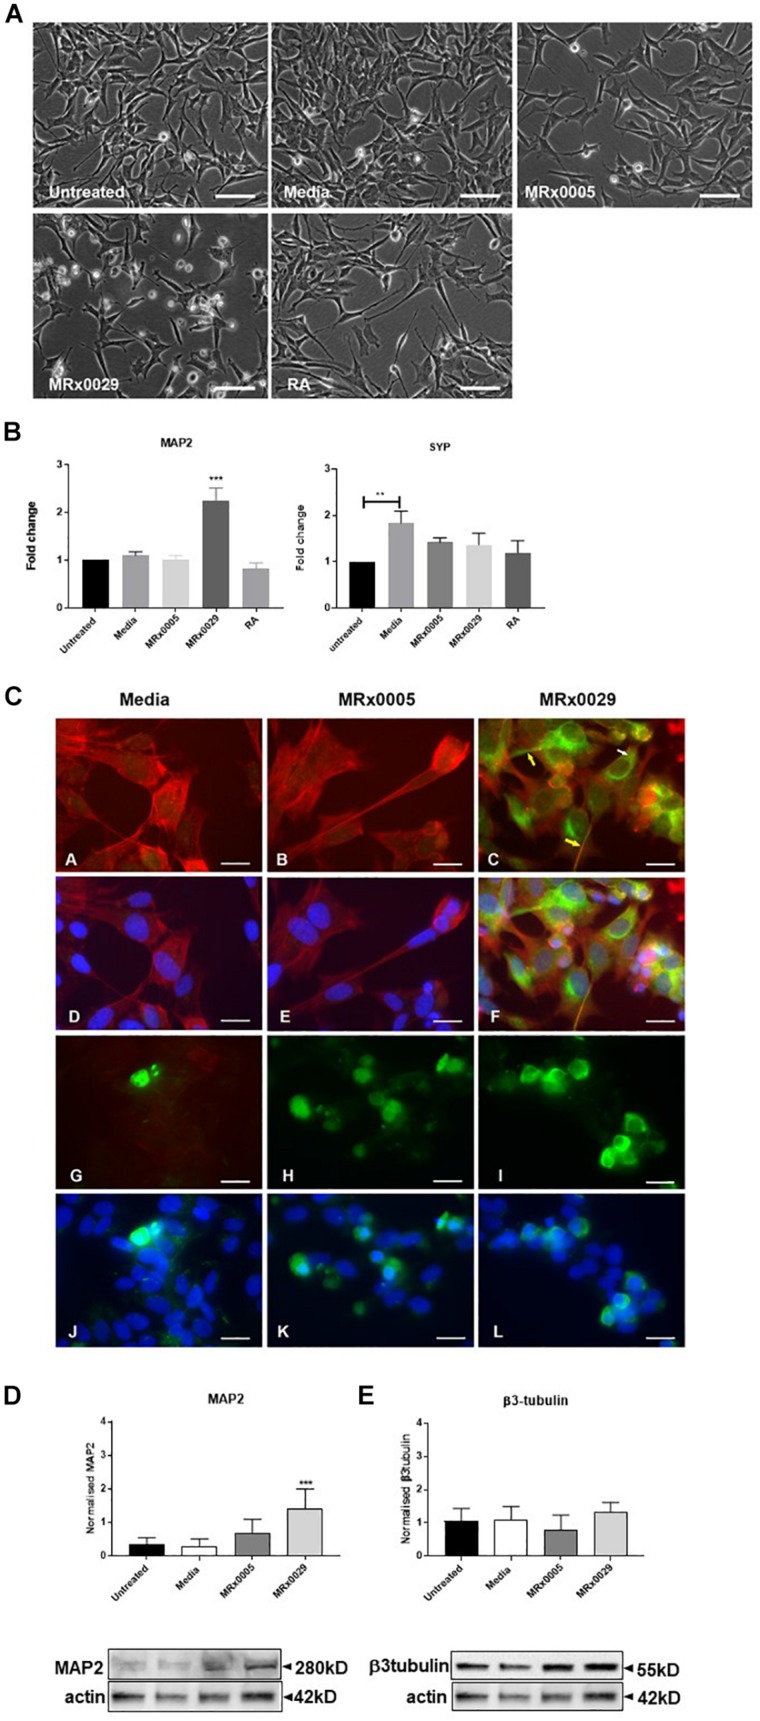
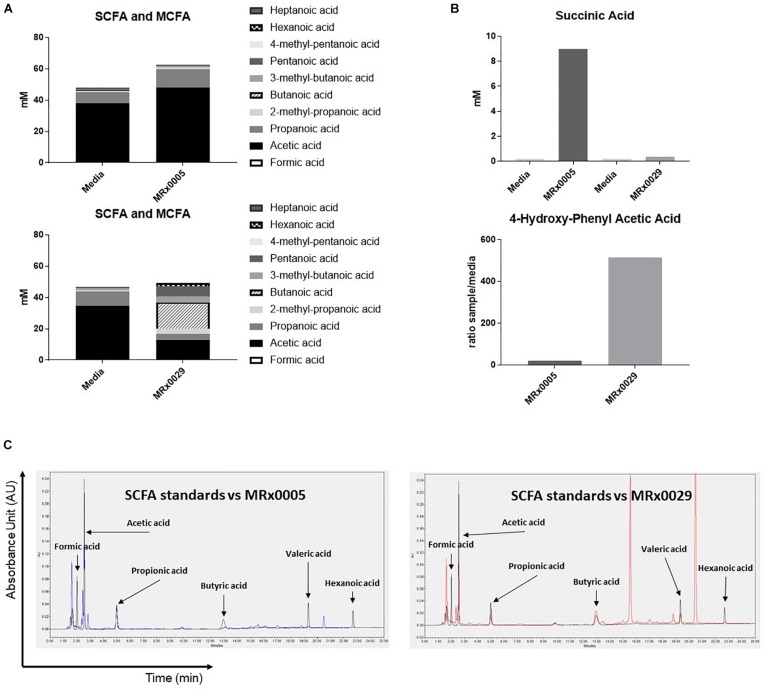
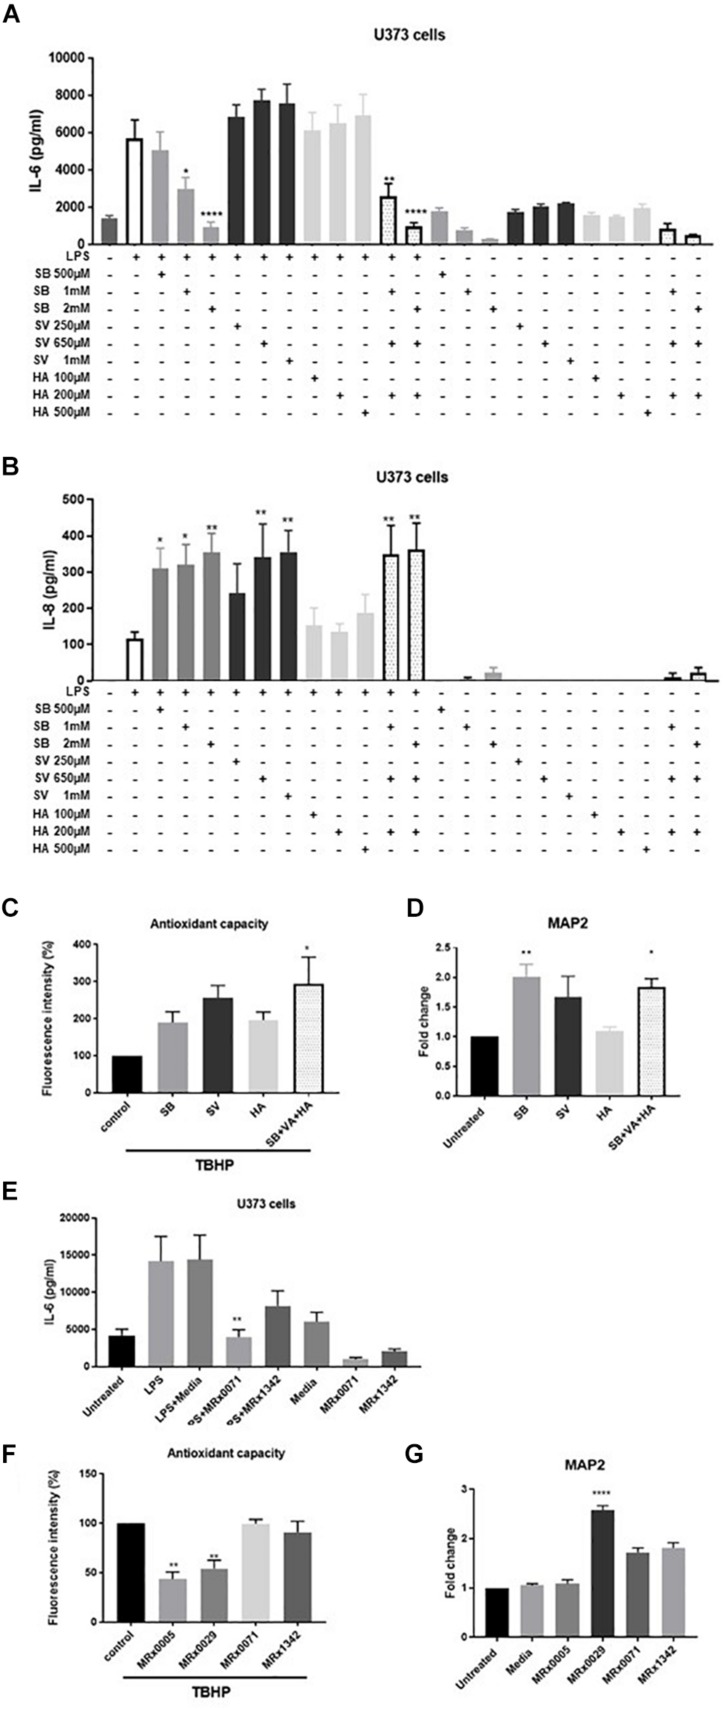
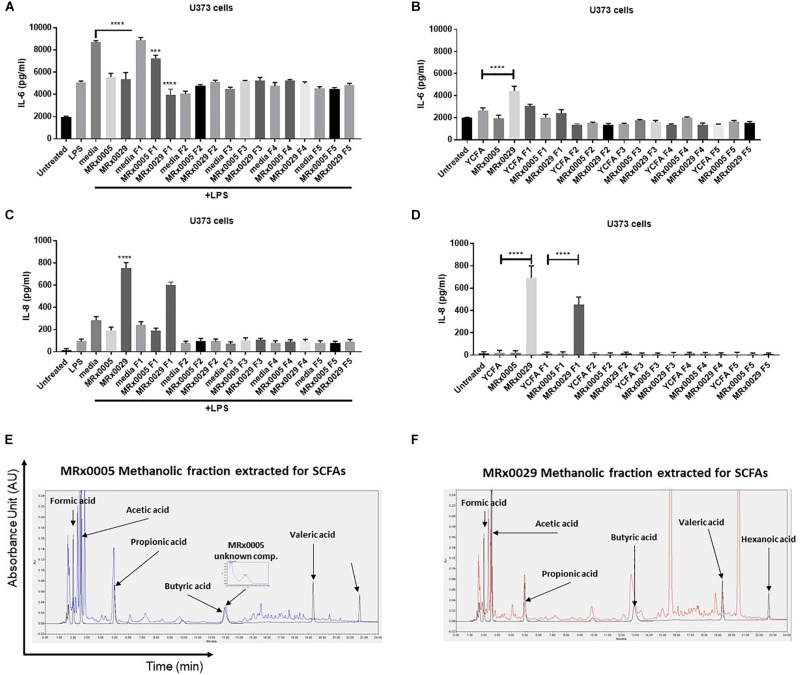
Neurodegenerative diseases are disabling, incurable, and progressive conditions characterized by neuronal loss and decreased cognitive function. Changes in gut microbiome composition have been linked to a number of neurodegenerative diseases, indicating a role for the gut-brain axis. Here, we show how specific gut-derived bacterial strains can modulate neuroinflammatory and neurodegenerative processes in vitro through the production of specific metabolites and discuss the potential therapeutic implications for neurodegenerative disorders. A panel of fifty gut bacterial strains was screened for their ability to reduce pro-inflammatory IL-6 secretion in U373 glioblastoma astrocytoma cells. Parabacteroides distasonis MRx0005 and Megasphaera massiliensis MRx0029 had the strongest capacity to reduce IL-6 secretion in vitro. Oxidative stress plays a crucial role in neuroinflammation and neurodegeneration, and both bacterial strains displayed intrinsic antioxidant capacity. While MRx0005 showed a general antioxidant activity on different brain cell lines, MRx0029 only protected differentiated SH-SY5Y neuroblastoma cells from chemically induced oxidative stress. MRx0029 also induced a mature phenotype in undifferentiated neuroblastoma cells through upregulation of microtubule-associated protein 2. Interestingly, short-chain fatty acid analysis revealed that MRx0005 mainly produced C1-C3 fatty acids, while MRx0029 produced C4-C6 fatty acids, specifically butyric, valeric and hexanoic acid. None of the short-chain fatty acids tested protected neuroblastoma cells from chemically induced oxidative stress. However, butyrate was able to reduce neuroinflammation in vitro, and the combination of butyrate and valerate induced neuronal maturation, albeit not to the same degree as the complex cell-free supernatant of MRx0029. This observation was confirmed by solvent extraction of cell-free supernatants, where only MRx0029 methanolic fractions containing butyrate and valerate showed an anti-inflammatory activity in U373 cells and retained the ability to differentiate neuroblastoma cells. In summary, our results suggest that the pleiotropic nature of live biotherapeutics, as opposed to isolated metabolites, could be a promising novel drug class in drug discovery for neurodegenerative disorders.
Keywords: gut microbiota-derived bacterial strains; gut-brain axis; microbiome; neurodegenerative diseases; neuroinflammation; neuroprotection; oxidative stress; short-chain fatty acids.
Copyright © 2019 Ahmed, Busetti, Fotiadou, Vincy Jose, Reid, Georgieva, Brown, Dunbar, Beurket-Ascencio, Delday, Ettorre and Mulder.
Figures
Similar articles
-
Human gut bacteria as potent class I histone deacetylase inhibitors in vitro through production of butyric acid and valeric acid.PLoS One. 2018 Jul 27;13(7):e0201073. doi: 10.1371/journal.pone.0201073. eCollection 2018. PLoS One. 2018. PMID: 30052654 Free PMC article.
-
Neuroprotective effect of short-chain fatty acids against oxidative stress-induced SH-SY5Y injury via GPR43-dependent pathway.J Neurochem. 2023 Jul;166(2):201-214. doi: 10.1111/jnc.15827. Epub 2023 Apr 26. J Neurochem. 2023. PMID: 37070532
-
Gut-brain Axis: Role of Lipids in the Regulation of Inflammation, Pain and CNS Diseases.Curr Med Chem. 2018;25(32):3930-3952. doi: 10.2174/0929867324666170216113756. Curr Med Chem. 2018. PMID: 28215162 Review.
-
Butyrate Rescues Oxidative Stress-Induced Transport Deficits of Tryptophan: Potential Implication in Affective or Gut-Brain Axis Disorders.Neuropsychobiology. 2021;80(3):253-263. doi: 10.1159/000510886. Epub 2020 Oct 19. Neuropsychobiology. 2021. PMID: 33075780
-
Implications of Diet and The Gut Microbiome in Neuroinflammatory and Neurodegenerative Diseases.Int J Mol Sci. 2019 Jun 25;20(12):3109. doi: 10.3390/ijms20123109. Int J Mol Sci. 2019. PMID: 31242699 Free PMC article. Review.
Cited by
-
New Avenues for Parkinson's Disease Therapeutics: Disease-Modifying Strategies Based on the Gut Microbiota.Biomolecules. 2021 Mar 15;11(3):433. doi: 10.3390/biom11030433. Biomolecules. 2021. PMID: 33804226 Free PMC article. Review.
-
Mechanisms of the Ping-wei-san plus herbal decoction against Parkinson's disease: Multiomics analyses.Front Nutr. 2023 Jan 4;9:945356. doi: 10.3389/fnut.2022.945356. eCollection 2022. Front Nutr. 2023. PMID: 36687704 Free PMC article.
-
Therapeutic Integrity of Microbiome-based Medicines in Neurodegenerative Disorders.Curr Neuropharmacol. 2022;20(11):2014-2018. doi: 10.2174/1570159X20666220214113816. Curr Neuropharmacol. 2022. PMID: 35156584 Free PMC article. No abstract available.
-
Gut microbiota and their influence in brain cancer milieu.J Neuroinflammation. 2025 May 1;22(1):129. doi: 10.1186/s12974-025-03434-2. J Neuroinflammation. 2025. PMID: 40312370 Free PMC article. Review.
-
Involvement of Intestinal Microbiota in Adult Neurogenesis and the Expression of Brain-Derived Neurotrophic Factor.Int J Mol Sci. 2022 Dec 14;23(24):15934. doi: 10.3390/ijms232415934. Int J Mol Sci. 2022. PMID: 36555576 Free PMC article.
References
-
- Abdanipour A., Schluesener H. J., Tiraihi T., Noori-Zadeh A. (2015). Systemic administration of valproic acid stimulates overexpression of microtubule-associated protein 2 in the spinal cord injury model to promote neurite outgrowth. Neurol. Res. 37 223–228. 10.1179/1743132814Y.0000000438 - DOI - PubMed
-
- Asano Y., Hiramoto T., Nishino R., Aiba Y., Kimura T., Yoshihara K., et al. (2012). Critical role of gut microbiota in the production of biologically active, free catecholamines in the gut lumen of mice. Am. J. Physiol. Gastrointest. Liver Physiol. 303 G1288–G1295. 10.1152/ajpgi.00341.2012 - DOI - PubMed
LinkOut - more resources
Full Text Sources
Other Literature Sources
Miscellaneous