. 2019 Sep 18:10:2147.
doi: 10.3389/fmicb.2019.02147. eCollection 2019.

HTLV-1 Extracellular Vesicles Promote Cell-to-Cell Contact

Affiliations

HTLV-1 Extracellular Vesicles Promote Cell-to-Cell Contact

Daniel O Pinto et al. Front Microbiol. .

Abstract

Human T-cell leukemia virus-1 (HTLV-1) is a neglected and incurable retrovirus estimated to infect 5 to 10 million worldwide. Specific indigenous Australian populations report infection rates of more than 40%, suggesting a potential evolution of the virus with global implications. HTLV-1 causes adult T-cell leukemia/lymphoma (ATLL), and a neurological disease named HTLV-1 associated myelopathy/tropical spastic paraparesis (HAM/TSP). Even though HTLV-1 transmission primarily occurs from cell-to-cell, there is still a gap of knowledge regarding the mechanisms of viral spread and disease progression. We have recently shown that Extracellular Vesicles (EVs) ubiquitously produced by cells may be used by HTLV-1 to transport viral proteins and RNA, and elicit adverse effects on recipient uninfected cells. The viral proteins Tax and HBZ are involved in disease progression and impairment of autophagy in infected cells. Here, we show that activation of HTLV-1 via ionizing radiation (IR) causes a significant increase of intracellular Tax, but not EV-associated Tax. Also, lower density EVs from HTLV-1-infected cells, separated by an Iodixanol density gradient, are positive for gp61+++/Tax+++/HBZ+ proteins (HTLV-1 EVs). We found that HTLV-1 EVs are not infectious when tested in multiple cell lines. However, these EVs promote cell-to-cell contact of uninfected cells, a phenotype which was enhanced with IR, potentially promoting viral spread. We treated humanized NOG mice with HTLV-1 EVs prior to infection and observed an increase in viral RNA synthesis in mice compared to control (EVs from uninfected cells). Proviral DNA levels were also quantified in blood, lung, spleen, liver, and brain post-treatment with HTLV-1 EVs, and we observed a consistent increase in viral DNA levels across all tissues, especially the brain. Finally, we show direct implications of EVs in viral spread and disease progression and suggest a two-step model of infection including the release of EVs from donor cells and recruitment of recipient cells as well as an increase in recipient cell-to-cell contact promoting viral spread.

Keywords: DNA; HTLV-1; RNA; cell-to-cell contact; extracellular vesicle; infection; tax; viral spread.


Figures

FIGURE 1
FIGURE 1
Viral Activation with IR Increases Intracellular Tax and EV Release. HUT102 cells (1 × 10⁶ cells/mL) from three distinct cultures were treated with IR (10 Gy) and cultured for 5 days in EV-depleted media. (A) From 1 mL of culture, cell pellets were lysed, and EVs captured and enriched using Nanotrap (NT) particles NT080/NT082. WB analysis was performed on cell lysates (lanes 1–6) and EVs (lanes 7–12) for detection of Tax, p53 (IR control), Cytochrome c (negative control for EV) and Actin protein expression. (B) Densitometry analysis was used for each Tax band and normalized to its corresponding Actin band. Biological triplicates were averaged together (lanes 1–3, 4–6, 7–9, and 10–12) and a two-tailed student t-test used to evaluate statistical significance between control (no treatment) and IR treatment. (C,D) ZetaView analysis of supernatant material derived from 1 × 10⁶ HUT102 cells/mL (±IR; 10 Gy) was analyzed to determine EV size and concentration from three technical replicates. ZetaView analysis of EVs from HUT102 cells was evaluated in multiple independent experiments (n > 3) and the trends were replicated consistently. (E) Cell viability was evaluated for HUT102 cells at 1 × 10⁶ cells/mL for control and IR conditions after 5 days. A two-tailed student t-test was performed to evaluate statistical significance with ∗∗∗p-value ≤ 0.001 indicating the highest statistical significance, followed by ∗∗p-value ≤ 0.01.
FIGURE 2
FIGURE 2
HTLV-1 Activation Increases Intracellular Viral RNA Transcription, but not RNA packaging into EVs. HUT102 cells (1 × 10⁶ cells/mL) were treated (±IR; 10 Gy) and cultured as described previously. (A) RNA was isolated from a 1 mL culture of HUT102 cells for analysis by RT-qPCR of tax, env, hbz, and gapdh. At least three independent experiments, each in technical triplicate, were performed and observed consistent reproducibility. (B) Similarly, 1 mL cultures of HUT102, MT-2, and MT-4 cells were cultured and EVs nanotrapped (NT080/082) and used for RT-qPCR analysis of env RNA. RT-qPCRs were performed in technical triplicate. A two-tailed student t-test was used to evaluate statistical significance with ∗∗∗p-values ≤ 0.001, ∗∗p-values ≤ 0.01, and p-values ≤ 0.05 indicating the level of significance.
FIGURE 3
FIGURE 3
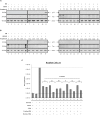
HTLV-1 proteins are differentially packaged after Viral Activation. HUT102 cells were treated with IR (10 Gy) and cultured in Exo-Free media for 5 days. Supernatants were collected from control and IR treated cells for precipitation by ExoMAX and separation into 11 fractions by OptiPrep/ultracentrifugation. Each resulting fraction was concentrated with NT080/082/086 particle mixture overnight. (A) WB analysis was conducted for each fraction from control (lanes 1–11) and IR treated cells (lanes 12–22), and probed for p19, gp61, gp46, HBZ, Actin. Each figure represents two blots with identical exposure combined into one for control and one for IR. (B) Densitometry analysis was performed on Tax protein bands from three independent Iodixanol gradients, averaged, and normalized to Actin. EV RNA was analyzed by RT-qPCR for (C) env RNA, (D) tax RNA, (E) and hbz RNA. Error bars represent one standard deviation above and below the averaged RNA copies/mL of technical triplicates.
FIGURE 4
FIGURE 4
Treatment with HTLV-1 EVs does not generate HTLV-1 viral proteins and RNA in Recipient cells. CEM and Jurkat cells were treated with density fractions (6 to 18) of HUT102 EVs for 5 days. WB analysis was conducted on CEM (A) and Jurkat (B) cells treated with HUT102 control EV fractions (lanes 1–11) and HUT102 IR-treated EV fractions (lanes 12–22) for p19, Tax, and Actin. Selected lanes were taken from the same blot with identical exposure settings presented in the figure. (C) RT-qPCR was conducted on WCE from Jurkat, CEM, and HUT102 cells (controls; lanes 1, 2, and 3, respectively). Jurkat cells (±IR) treated with fractions 6 (lanes 4 and 5), 12 (lanes 6 and 7), and 18 (lanes 8 and 9), and CEM cells (±IR) treated with fractions 6 (lanes 10 and 11), 12 (lanes 12 and 13), and 18 (lanes 14 and 15) for the presence of env RNA. Negative controls levels were denoted by a solid line (-) and positive control levels for infection by a dashed line (—). We used fraction 6 as negative control for presence of virus; fraction 18 as a potential source of virus; and fraction 12 as a control for fraction 18, which contained EVs with Tax/gp61.
FIGURE 5
FIGURE 5
EVs isolated from HTLV-1-Infected Cells are not Infectious. T-cell lines (CEM and Jurkat) were cultured in EV-depleted media and incubated with EVs from HTLV-1-infected cells (HUT102 (A), MT-2 (B), or MT-4 (C); ±IR) for 5 days. RT-qPCR for env RNA was performed for control CEM cells (lane 1), Jurkat cells (lane 2). Additionally, HTLV-1 EVs (HUT102, MT-2, or MT-4; lane 3) was also analyzed to determine relative RNA levels of the starting material. RT-qPCR quantitation of recipient CEM and Jurkat cells were analyzed to assess infectivity (lanes 4 and 5, respectively). Negative controls levels were denoted by a solid line (-) and positive control levels for infection by a dashed line (—).
FIGURE 6
FIGURE 6
EVs from HTLV-1-Infected Cells Promote Cell-to-Cell Contact. (A) Uninfected recipient cells (CEM) in biological triplicate were cultured at 1 × 10⁵ cells/mL in a 100 μL well and treated with equal volumes of CEM EVs (4.43 × 10⁸ EVs; 1:4,400), HTLV-1 EVs (3.05 × 10⁸ EVs; 1:3,300), and HTLV-1/IR EVs (4.02 × 10⁹ EVs; 1:44,000) and allowed to incubate for 5 days prior to fluorescent microscopy analysis. Cellular aggregates were counted when Green Fluorescence signals from EVs was found associated with recipient cell membranes and cells were in direct contact with each other. Attributes recorded were number of aggregates, number of cells per aggregate, and number of total cells per field of view. EVs used in treatments were concentrated by ultracentrifugation at 100,000 × g. Margin of error (±) reported for Cells/Clump with a 95% confidence interval. (B) Cell viability of recipient cells (CEM; 5 × 10⁵ cells/mL, in biological triplicate) treated with EVs (5 × 10⁹ cells/mL) at a 1: 10,000 ratio. A two-tailed student t-test was used to evaluate statistical significance with a p-value ≤ 0.05 indicating the level of significance.
FIGURE 7
FIGURE 7
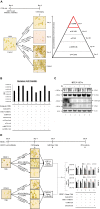
HTLV-1 EVs Promote Cell-to-Cell Contact and Increase Infectivity of HTLV-Infected Cells. Uninfected recipient CEM (A) and Jurkat (B) cells were cultured in biological triplicate in EV-depleted media with EVs from CEM cells (Control EVs), HUT102 cells (HTLV-1 EVs), and irradiated HUT102 cells (HTLV-1/IR EVs) at a ratio of 1 cell to 10,000 EVs for 5 days prior to microscopic analysis. Images are representative of three independent experiments. Following microscopy, irradiated HUT102 cells (HTLV-1 Donor Cells; 10 Gy) and fresh Exo-Free media were added to the culture at a ratio of 1:100 for 4 days. Subsequent RT-qPCR analysis was performed for the presence of tax, env, and hbz. A two-tailed student t-test was used to evaluate statistical significance with ∗∗∗p-values ≤ 0.001, ∗∗p-values ≤ 0.01, and p-values ≤ 0.05 indicating the level of significance.
FIGURE 8
FIGURE 8
Antibodies against Specific Cellular Surface Receptors Inhibit Cell-to-Cell Contact. (A) CEM recipient cells, in biological triplicate, were treated with HTLV-1 EVs (1 cell: 10,000 EVs) and treated with antibodies at concentrations derived from titration (data not shown) for α-CD45 (0.2 μg/mL), α-ICAM-1 (20 μg/mL), α-VCAM-1 (20 μg/mL), α-Tax (7.5 μg/mL of three Tab antibodies; 1:100 dilution), α-gp61/46 (5 μL of 1:10 dilution; according to Palker et al., 1992; 45 μL/1 × 106 cells/mL), and imaged at day 5. (B) Cell viability of CEM cells (5 × 10⁵ cells/mL) treated with HTLV-1/IR EVs (5 × 10⁹ cells/mL) and neutralizing antibodies at day 5 after treatment. (C) Western blot analysis for CD45, ICAM-1, CD63 and Actin was performed on HTLV-1 EVs (from HUT102 cells) enriched by NT080/082 from supernatants of 5 days old CEM cultures at 1 × 10⁶ cells/mL. (D) PBMCs were cultured for 3 days and with IL2 and PHA on day 0 and day 3 prior to treatment with HTLV-1/IR EVs (1 PBMC: 10,000 EVs) and α-CD45 and ICAM-1 for 4 days, and subsequent addition of IR treated donor cells (1 HUT102 cell: 100 PBMCs) and RT-qPCR analysis for env, tax, and hbz at day 8. Only 2 out of 3 PBMC experiments are shown. Black Asterisks () are used to compare lanes 2 and 3 to lane 1, and red asterisks () are used to compare lanes 4 and 5 to lane 3.
FIGURE 9
FIGURE 9
EVs from HTLV-1-infected cells increase viral RNA and DNA in NOG mouse model. (A) NOG mice received human CD34 cells (8 weeks), followed by control EV or HTLV-1 EV injection (HUT102; 6×, 10 μg for 2 weeks), and subsequent treatment with IR activated HTLV-1 donor cells (50 million) for 3 weeks. IR treatment of HTLV-1-infected cells (inhibition of cellular replication) is the source of the viral spread. (B) RT-qPCR of viral RNA from blood of NOG mice (n = 9) that received no treatment (C 1–3; denoted by a circle), Control EV treatment (NOG 1–3; denoted by a square, and HTLV-1 EVs (NOG 4–6; denoted by a triangle). (C) Presence of HTLV-1 DNA (using PCR for env region) from the blood of NOG mice. (D) Analysis of HTLV-1 DNA (env) from NOG mice from Lung, Spleen, Liver, and Brain. A two-tailed student t-test was used to evaluate statistical significance with ∗∗p-values ≤ 0.01 and p-values ≤ 0.05 indicating the level of significance compared to control.
FIGURE 10
FIGURE 10
Proposed model for EV-mediated HTLV-1 viral spread and pathogenesis. HTLV-1 EVs carrying viral cargo are released and prime uninfected recipient cells. The recipient cells become activated and/or migrate toward the HTLV-1-infected donor cell thereby promoting increased cell-to-cell contact. HTLV-1 donor cells may then transmit the virus to adjacent recipient cells and facilitate viral spread. Viral spread may occur via viral biofilm, virological synapse, cellular conduits, or TNT formation.

References

    1. Ahsan N. A., Sampey G. C., Lepene B., Akpamagbo Y., Barclay R. A., Iordanskiy S., et al. (2016). Presence of viral RNA and proteins in exosomes from cellular clones resistant to rift valley fever virus infection. Front. Microbiol. 7:139. 10.3389/fmicb.2016.00139 - DOI - PMC - PubMed
    1. Alais S., Mahieux R., Dutartre H. (2015). Viral source-independent high susceptibility of dendritic cells to human T-Cell Leukemia Virus Type 1 infection compared to that of T Lymphocytes. J. Virol. 89 10580–10590. 10.1128/JVI.01799-1715 - DOI - PMC - PubMed
    1. Anderson M., Kashanchi F., Jacobson S. (2018). Role of exosomes in human retroviral mediated disorders. J. Neuroimmune Pharmacol. 13 279–291. 10.1007/s11481-018-9784-9787 - DOI - PubMed
    1. Anderson M. R., Pleet M. L., Enose-Akahata Y., Erickson J., Monaco M. C., Akpamagbo Y., et al. (2018). Viral antigens detectable in CSF exosomes from patients with retrovirus associated neurologic disease: functional role of exosomes. Clin. Transl. Med. 7:24. 10.1186/s40169-018-0204-207 - DOI - PMC - PubMed
    1. Anderson M. R., Kashanchi F., Jacobson S. (2016). Exosomes in viral disease. Neurotherapeutics 13 535–546. 10.1007/s13311-016-0450-456 - DOI - PMC - PubMed