. 2019 Sep 18:9:903.
doi: 10.3389/fonc.2019.00903. eCollection 2019.

Immune Landscape of Invasive Ductal Carcinoma Tumor Microenvironment Identifies a Prognostic and Immunotherapeutically Relevant Gene Signature

Affiliations

Immune Landscape of Invasive Ductal Carcinoma Tumor Microenvironment Identifies a Prognostic and Immunotherapeutically Relevant Gene Signature

Xuanwen Bao et al. Front Oncol. .

Abstract

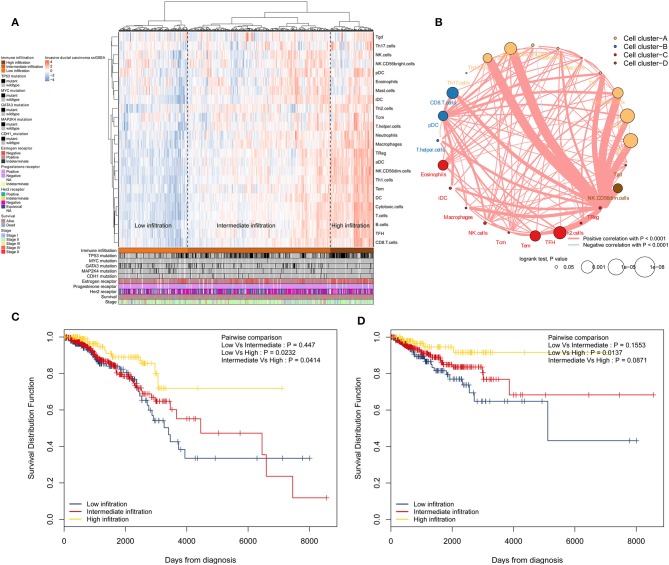
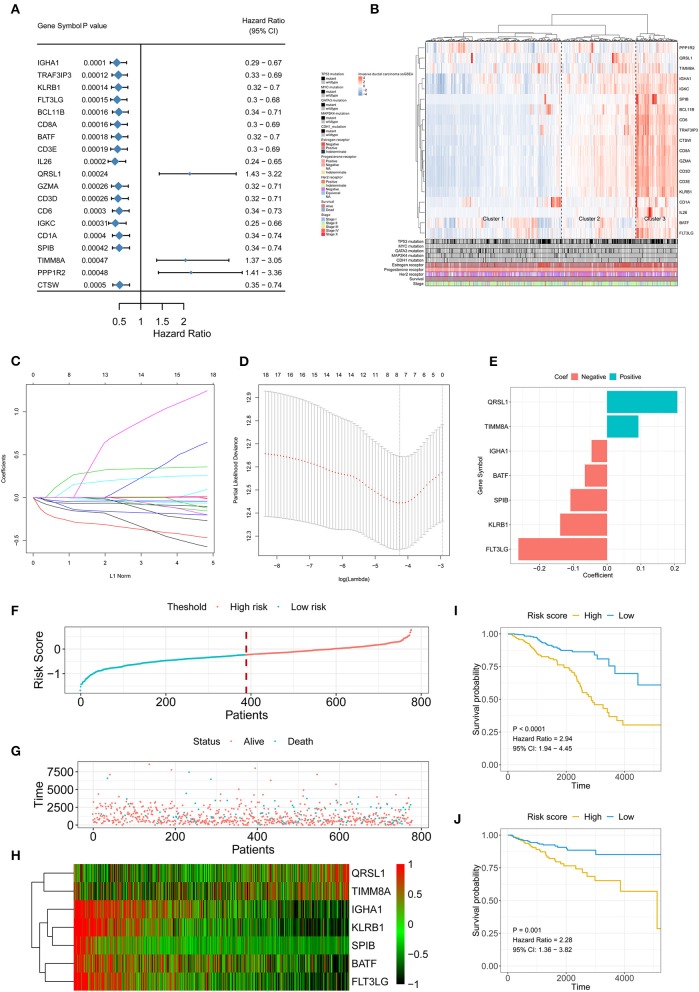
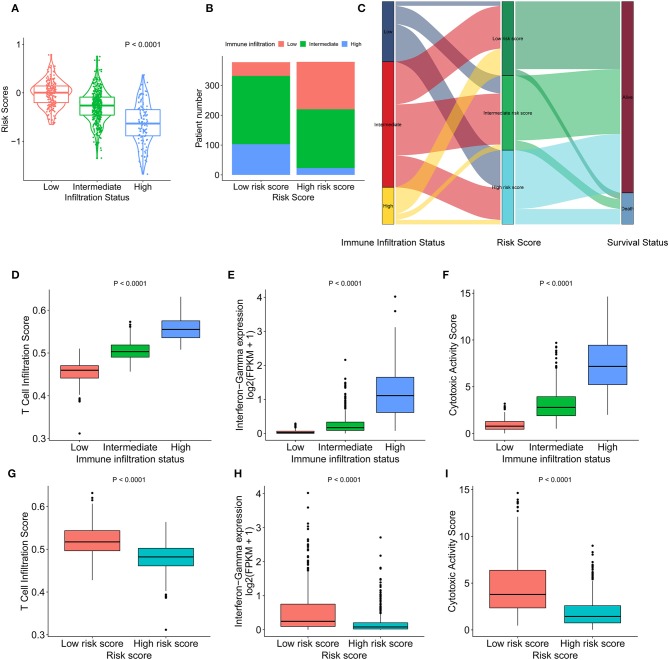
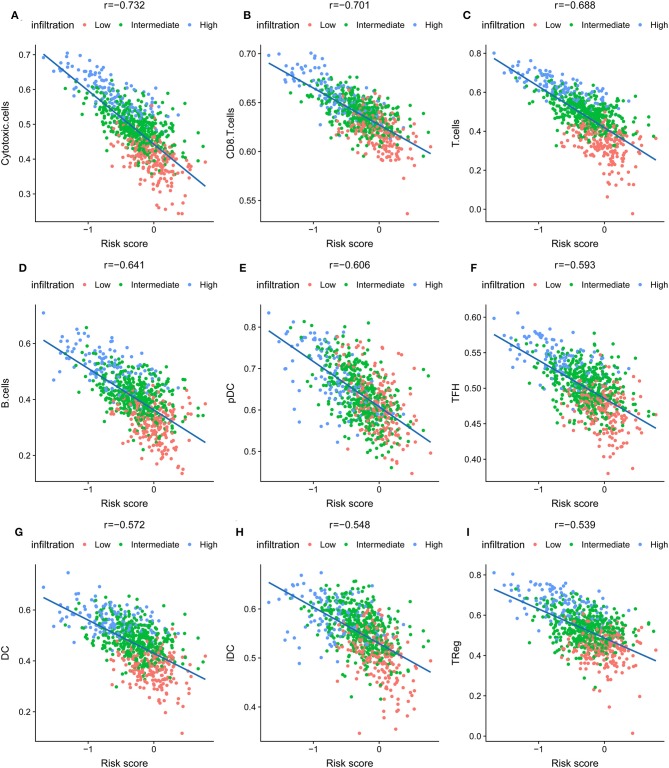
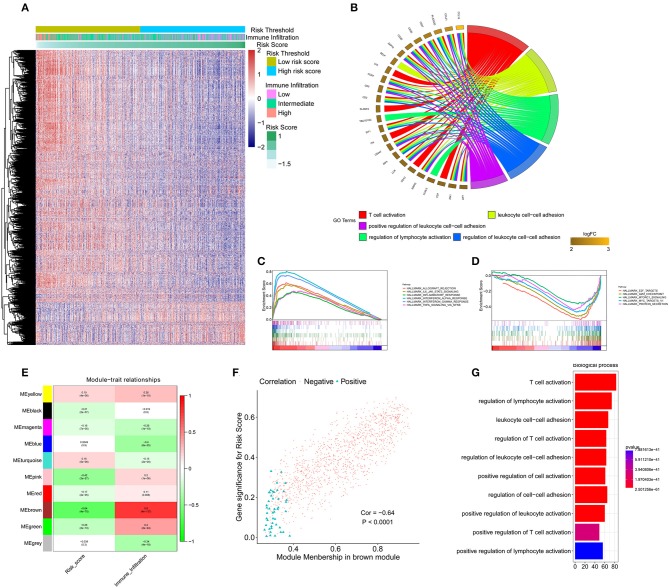
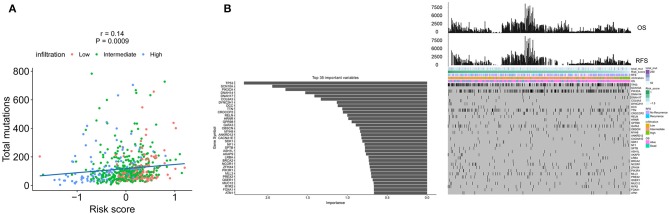
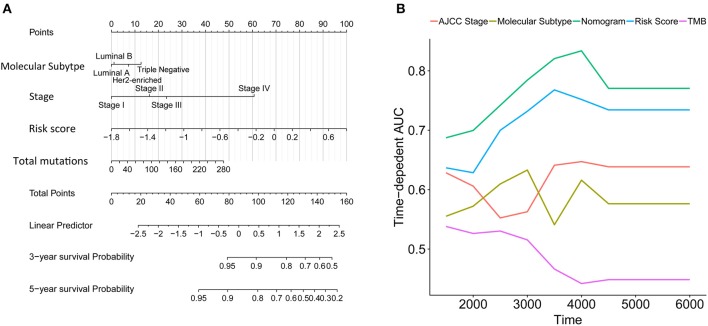
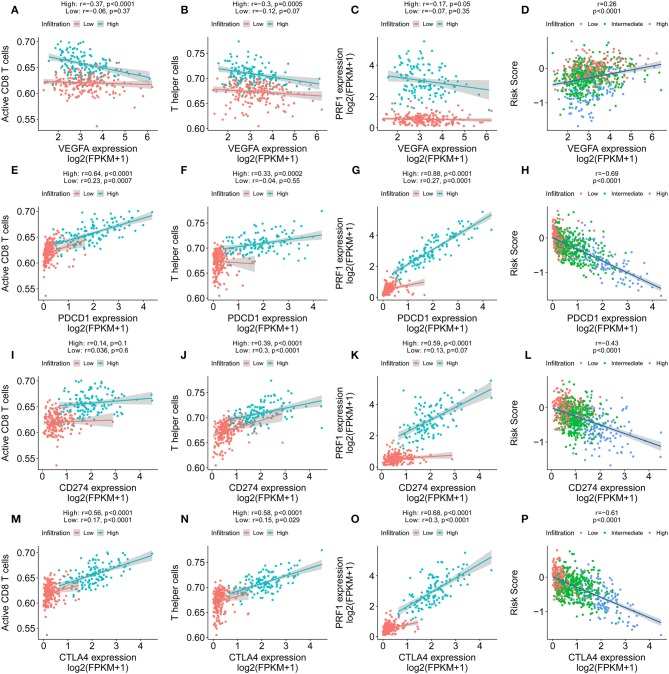
Background: Invasive ductal carcinoma (IDC) is a clinically and molecularly distinct disease. Tumor microenvironment (TME) immune phenotypes play crucial roles in predicting clinical outcomes and therapeutic efficacy. Method: In this study, we depict the immune landscape of IDC by using transcriptome profiling and clinical characteristics retrieved from The Cancer Genome Atlas (TCGA) data portal. Immune cell infiltration was evaluated via single-sample gene set enrichment (ssGSEA) analysis and systematically correlated with genomic characteristics and clinicopathological features of IDC patients. Furthermore, an immune signature was constructed using the least absolute shrinkage and selection operator (LASSO) Cox regression algorithm. A random forest algorithm was applied to identify the most important somatic gene mutations associated with the constructed immune signature. A nomogram that integrated clinicopathological features with the immune signature to predict survival probability was constructed by multivariate Cox regression. Results: The IDC were clustered into low immune infiltration, intermediate immune infiltration, and high immune infiltration by the immune landscape. The high infiltration group had a favorable survival probability compared with that of the low infiltration group. The low-risk score subtype identified by the immune signature was characterized by T cell-mediated immune activation. Additionally, activation of the interferon-α response, interferon-γ response, and TNF-α signaling via the NFκB pathway was observed in the low-risk score subtype, which indicated T cell activation and may be responsible for significantly favorable outcomes in IDC patients. A random forest algorithm identified the most important somatic gene mutations associated with the constructed immune signature. Furthermore, a nomogram that integrated clinicopathological features with the immune signature to predict survival probability was constructed, revealing that the immune signature was an independent prognostic biomarker. Finally, the relationship of VEGFA, PD1, PDL-1, and CTLA-4 expression with the immune infiltration landscape and the immune signature was analyzed to interpret the responses of IDC patients to immunotherapy. Conclusion: Taken together, we performed a comprehensive evaluation of the immune landscape of IDC and constructed an immune signature related to the immune landscape. This analysis of TME immune infiltration landscape has shed light on how IDC respond to immunotherapy and may guide the development of novel drug combination strategies.

Keywords: immune checkpoint inhibitor; immune landscape; immune signature; invasive ductal carcinoma; survival.


Figures

Figure 1
Figure 1
Immune landscape of IDCs and the TME characteristics. (A) Unsupervised clustering of IDC patients from the TCGA cohort using ssGSEA scores from immune cell types. Mutation status of TP53, MYC, GATA3, MAP2K4, and CDH1, status of the estrogen receptor, status of the progesterone receptor, status of Her2, survival, and stage are shown as patient annotations in the lower panel. Hierarchical clustering was performed with Euclidean distance and Ward linkage. Three distinct immune infiltration clusters, here termed high infiltration, median infiltration, and low infiltration, were defined. (B) Interaction of the TME immune cell types. The size of each term represents the survival impact of each TME cell type, calculated by log10 (log-rank test P-value). The connection of TME immune cells represents interactions between both. The thickness of the line indicates the strength of the correlation calculated by Spearman correlation analysis. Positive correlations are represented in red, and negative correlations are represented in blue. The immune cell cluster was clustered by the hclust method. Immune cell cluster-A, yellow; cell cluster-B, blue; cell cluster-C, red; and cell cluster-D, brown. (C) Kaplan-Meier curves for OS of IDC patients showing that the high immune infiltration group had a favorable outcome compared with the other groups. (D) Kaplan-Meier curves for RFS of IDC patients showing that the high immune infiltration group had a favorable outcome compared with other groups. IDC, invasive ductal carcinoma; TME, tumor microenvironment; TCGA, The Cancer Genome Atlas; OS, overall survival; RFS, recurrence-free survival.
Figure 2
Figure 2
Signature-based risk score is a promising marker of survival in IDC patients. (A) The HR and P-value from the univariable Cox HR regression of selected genes in the immune terms (Criteria: P-value < 0.001). (B) The expression of the selected genes shown by heatmap. Mutation status of TP53, MYC, GATA3, MAP2K4, and CDH1, status of the estrogen receptor, status of the progesterone receptor, status of Her2, survival, and stage are shown as patient annotations in the lower panel. Hierarchical clustering was performed with Euclidean distance and Ward linkage. (C,D) LASSO Cox analysis identified seven genes most correlated with overall survival, and 10-round cross validation was performed to prevent overfitting. (E) Coefficient distribution of the gene signature. (F) Risk score distribution. (G) Survival overview. (H) Heatmap showing the expression profiles of the signature in the low- and high-risk groups. (I) Patients in the high-risk group exhibited worse OS than those in the low-risk group. (J) Patients in the high-risk group exhibited worse RFS than those in the low-risk group. IDC, invasive ductal carcinoma; OS, overall survival; RFS, recurrence-free survival.
Figure 3
Figure 3
Heterogeneous immune cell infiltration in the low- and high-risk score groups. (A) The distribution of risk scores in low, mediate, and high immune infiltration patterns. (B) The distribution of immune infiltration patterns in the low- and high-risk score groups. (C) Alluvial diagram of immune infiltration patterns in groups with different risk scores and survival outcomes. (D) TIS in low, mediate, and high immune infiltration patterns. (E) Relative interferon-γ signature in low, mediate, and high immune infiltration patterns. (F) Comparison of relative CYT in low, mediate, and high immune infiltration patterns. (G) Relative TIS in the low- and high-risk score groups. (H) Relative interferon-γ signature in the low- and high-risk score groups. (I) Comparison of relative CYT in the low- and high-risk score groups. TIS, T cell infiltration score; CYT, cytotoxic activity scores.
Figure 4
Figure 4
The nine most significant correlations of risk score with immune cell infiltration ssGSEA score. (A) Cytotoxic cells, (B) CD8+ T cells, (C) T cells, (D) B cells, (E) pDC cells, (F) TFH cells, (G) DC cells, (H) iDC cells, (I) Treg cells.
Figure 5
Figure 5
Functional annotation of the immune signature and WGCNA of the IDC transcriptome. (A) Heatmap showing the transcriptome expression profiles of the low- and high-risk groups. (B) GO analysis based on the significant genes in the comparison between low- and high-risk groups. (C,D) GSEA revealed that most significant hallmarks correlated with the immune signature. (E) Correlation between modules and traits. (F) The correlation between module membership and gene significance in the brown module. (G) GO analysis based on the hub genes in the brown module. GO, gene ontology; GSEA, gene set enrichment analysis.
Figure 6
Figure 6
The association of the immune signature with cancer somatic mutations. (A) The correlation between the immune signature and IDC somatic mutations. (B) Distribution of somatic mutations correlated with the immune signature. The upper bar plot indicates OS and RFS per patient, whereas the left bar plot shows the importance of the somatic mutations correlated with the immune signature. IDC, invasive ductal carcinoma; OS, overall survival; RFS, recurrence-free survival.
Figure 7
Figure 7
Construction of a nomogram for survival prediction. (A) Nomogram combining the immune signature with clinicopathological features. (B) The AUC(t) of the multivariable models indicated that the nomogram had the highest predictive power for overall survival.
Figure 8
Figure 8
Immune signature predicts immunotherapeutic benefits. (A–C) The correlation of VEGFA expression with T cell infiltration, Th1 cells, and PRF1 expression in high and low immune infiltration conditions. (D) The correlation of VEGFA expression with the immune signature. (E–G) The correlation of PD-1 expression with T cell infiltration, Th1 cells, and PRF1 expression in high and low immune infiltration conditions. (H) The correlation of PD-1 expression with the immune signature. (I–K) The correlation of PDL-1 expression with T cell infiltration, Th1 cells, and PRF1 expression in high and low immune infiltration conditions. (L) The correlation of PDL-1 expression with the immune signature. (M–O) The correlation of CTLA-4 expression with T cell infiltration, Th1 cells, and PRF1 expression in high and low immune infiltration conditions. (P) The correlation of CTLA-4 expression with the immune signature.

References

    1. Eble JN, Tavassoli FA, Devilee P. Pathology and Genetics of Tumours of the Breast and Female Genital Organs. Iarc; (2003).
    1. Arpino G, Bardou VJ, Clark GM, Elledge RM. Infiltrating lobular carcinoma of the breast: tumor characteristics and clinical outcome. Breast Cancer Res. (2004) 6:R149. 10.1186/bcr767 - DOI - PMC - PubMed
    1. Ciriello G, Gatza ML, Beck AH, Wilkerson MD, Rhie SK, Pastore A, et al. . Comprehensive molecular portraits of invasive lobular breast cancer. Cell. (2015) 163:506–19. 10.1016/j.cell.2015.09.033 - DOI - PMC - PubMed
    1. Smid M, Rodríguez-González FG, Sieuwerts AM, Salgado R, Prager-Van der Smissen WJ, van Der Vlugt-Daane M, et al. . Breast cancer genome and transcriptome integration implicates specific mutational signatures with immune cell infiltration. Nat Commun. (2016) 7:12910. 10.1038/ncomms12910 - DOI - PMC - PubMed
    1. Pages F, Galon J, Dieu-Nosjean M, Tartour E, Sautes-Fridman C, Fridman W. Immune infiltration in human tumors: a prognostic factor that should not be ignored. Oncogene. (2010) 29:1093 10.1038/onc.2009.416 - DOI - PubMed