. 2019 Feb;1(2):236-250.
doi: 10.1038/s42255-018-0016-5. Epub 2019 Jan 21.

A network of trans-cortical capillaries as mainstay for blood circulation in long bones

Affiliations

A network of trans-cortical capillaries as mainstay for blood circulation in long bones

Anika Grüneboom et al. Nat Metab. 2019 Feb.

Abstract

Closed circulatory systems (CCS) underlie the function of vertebrate organs, but in long bones their structure is unclear, although they constitute the exit route for bone marrow (BM) leukocytes. To understand neutrophil emigration from BM, we studied the vascular system of murine long bones. Here we show that hundreds of capillaries originate in BM, cross murine cortical bone perpendicularly along the shaft and connect to the periosteal circulation. Structures similar to these trans-cortical-vessels (TCVs) also exist in human limb bones. TCVs express arterial or venous markers and transport neutrophils. Furthermore, over 80% arterial and 59% venous blood passes through TCVs. Genetic and drug-mediated modulation of osteoclast count and activity leads to substantial changes in TCV numbers. In a murine model of chronic arthritic bone inflammation, new TCVs develop within weeks. Our data indicate that TCVs are a central component of the CCS in long bones and may represent an important route for immune cell export from the BM.


Conflict of interest statement

Competing Interests The authors declare no competing interests.

Figures
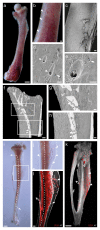
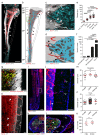
Fig. 1
Fig. 1. Identification of blood vessels in the shaft of murine long bones
(a) An exposed murine C57BL/6J femur shows multiple reddish dots on its surface. Scale bar = 1000 μm. (b) Magnified view of (a) allows the identification of blood filled pores on the bone surface (filled arrowheads). Scale bar = 100μm. (c) Electron microscopy (ELMI) of confirms the high number of pores on the femoral bone surface. Scale bar = 100 μm. (d, e) Higher magnified ELMI scans display of about 10 μm big pores (filled arrowheads) accompanied by grooves on the bone surface (dashed lines). Osteocyte canaliculi with a diameter about 1μm (filled arrows) are found in roundish cavities. Scale bars = 20 μm (d), 10 μm (e). (f) 3-D reconstruction of an X-Ray microscopy imaged tibia allows the visualization of differently sized canals passing the compact bone (filled arrowheads, open arrowhead). Scale bar = 500 μm. (g, h) Higher magnifications of white boxed areas in (f) highlight the bone canals (filled arrowheads, open arrowhead) which can be optically distinguished from the osteocyte lacunae in the compact bone. Scale bars = 100 μm. (i) SimpleCLEAR treatment of an entire tibia allows the visualization of blood filled canals inside the compact bone and a central canal in the bone marrow (dashed line). Scale bar = 1000 μm. (j) Higher magnification of the white boxed area in (i) shows a complex network of blood filled canals in the compact bone (filled arrowheads, bone surface indicated via dotted line). Scale bar = 100 μm. (k) Light sheet fluorescence microscopy visualizes a dense vascular network and a separated posterior vessel (filled arrowheads, open arrow, CD31, red) on the tibia bone surface (autofluorescence, AF, grey). Scale bar = 1000 μm. (l) Optical clipping of (k) displays the dense bone marrow (BM) vascularization (CD31, red) and multiple blood vessels (filled arrowheads) passing the compact bone connecting the BM with the periosteum(open arrowheads). Scale bar = 100 μm. All experiments were performed minimum three times independently with similar results.
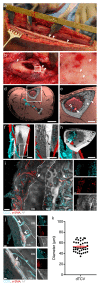
Fig. 2
Fig. 2. Characterization and size verification of different vessel types by multiple imaging techniques
(a) Arterial (CD31+/Sca-1+, red) and venous (CD31+/Sca-1-, blue) labeling of the tibia vascularization (autofluorescence, grey) identifies the central sinus (CS, white star, open arrowheads), nutrient arteries (NAs, white arrows) and TCVs (filled arrowheads). Scale bar = 1000 μm. (b) Schematic Fig. of (a) showing NAs (red, filled arrows) infiltrating the bone marrow (BM) through the compact bone (CB) at the metaphysis and the posterior diaphysis (DP), merging the sinusoidal system (blue) at the endosteum. The sinusoids converge at the CS (black star) with its two exit sites (open arrowheads). Arterial or venous TCVs (filled arrowheads) cross the CB connecting endosteal arteries or sinusoids with the periosteum. (c, d) TPLSM and schematic Fig. of green boxed area in (b) showing arterial TCVs (red, filled arrowheads) and their connections (filled arrows) to the sinusoidal network (blue, open arrowheads) in the BM. Scale bar = 50 μm. (e) Diameters of blood vessel types in the tibia. Each dot represents one vessel (data are mean ± SEM of 8 tibiae, Kruskal-Wallis H-Test and Dunn’s multiple comparisons test, all ****p < 0.0001). (f) Quantification of tibial vessel types (data are mean ± SEM of 8 tibiae, Kruskal-Wallis H-Test and Dunn’s multiple comparisons test, all ****p < 0.0001). (g) Intra-vital TPLSM of a LysM-EGFP tibia. The BM sinusoids (Rhodamine Dextran, red, filled arrowheads) are surrounded by GFP+ cells (green). The TCVs (open arrowheads) are located in the compact bone (SHG, grey). Scale bar = 50 μm. (h) LSFM imaging (autofluorescence, AF, grey) identifies tibial sinusoids (filled arrowheads) and TCVs (open arrowheads) via endothelial staining (CD31, red). Scale bar = 50 μm. (i) Histological femoral section including endothelial (CD31, red) and nuclear staining (DAPI, blue). Scale bar = 500 μm. (j) Magnified view of white boxed area in (i) shows sinusoids (filled arrowheads) in the marrow and TCVs (open arrowheads) in the compact bone. Scale bar = 50 μm. (k) Cross section of a LysM-EGFP tibia showing GFP+ cells (green) in the BM, endothelial structures (CD31, red) and nuclei (DAPI, blue). Scale bar = 500 μm. (l) Magnified view of white boxed area in (k) identifies sinusoids (filled arrowheads) surrounded by GFP+ cells (green) in the BM and TCVs (open arrowheads) in the CB (All experiments of a, c, g-l were performed minimum three times independently with similar results). Scale bar = 50 μm. (m) Sinusoid diameters were determined based on their CD31 signal or transport of blood tracers using intra-vital TPLSM, LSFM or histological sections (data are mean ± SEM 24 TPLSM, 9 LSFM, 15 histological tibia scans, Kruskal-Wallis H-Test and Dunn’s multiple comparisons test). (n) The same approach was used to quantify the diameters of TCVs (data are mean ± SEM 16 TPLSM, 84 LSFM, 15 histological tibia scans, Kruskal-Wallis H-Test and Dunn’s multiple comparisons test). (o) No gender specific differences in TCV numbers were observed (data are mean ± SEM of 8 tibiae of 8 individual animals, two-sided Mann-Whitney U-Test).
Fig. 3
Fig. 3. Characterization of TCVs and blood flow in murine tibiae
(a) LSFM-scans (CD31, red, TCV tracks indicated by dashed green lines) and schematic Fig. identify directly passing (dTCVs), bifurcated (bTCVs), complex network TCVs (cTCVs) or intra-cortical loops (ICLs). Scale bars = 100 μm. (b) Schematic Fig. of the vessel orientation (red) along the tibial bone shaft (grey). (c) Quantification and relative position of different TCV-types in murine tibia. Other TCVs consist of bTCVs, dTCVs and ICLs (data are mean ± SEM of 3 tibiae). (d) Changing orientation and distribution of dTCVs along the bone shaft (data are mean ± SEM of 6 tibiae). (e) Quantification and distributional analysis of arterial (CD31+/Sca-1+) and venous (CD31+/Sca-1-) TCVs (data are mean ± SEM of 3 tibiae, Kruskal-Wallis H-Test and Dunn’s multiple comparisons test, **p = 0.0045). (f) dTCV orientations (CD31, red, TCV tracks indicated by dashed green lines) in the compact bone (CB). Scale bar = 100 μm. Schematic Fig. of dTCVs (red) showing differences in straightness relative to CB thickness (grey). (g) Straightness analysis of dTCVs in murine tibia (data are mean ± SEM of 6 tibiae). (h) dTCV-straightness correlates highly with cortical bone thickness (data are mean ± SEM of 6 tibiae, Spearman’s rank correlation, R2 = 0.97, dashed lines indicating the 95% confidence interval). (i) Total accumulated cross–sectional area (CSA) of different vessel types in murine tibia (data are mean ± SEM of n = 6 tibiae/TCV analysis, 6 tibiae/NA analysis, 4 tibiae/sinus analysis, Kruskal-Wallis H-Test and Dunn’s multiple comparisons test, ****p < 0.0001). (j) Relative CSA is dominated by TCVs in both, the arterial and venous system (data are mean ± SEM of 8 tibiae). (k) In vivo blood flow (Rhodamine Dextran, red) analysis via intra-vital TPLSM of vessels in the cortical bone (SHG, grey) based on the slope of the unstained erythrocyte (β, blue) and the distance of erythrocyte movement (Δxcell, white) over a defined time (Δt, green). (l) Erythrocyte velocities in TCVs and NAs measured by intra-vital TPLSM of murine tibiae. Each dot represents the mean of 25-140 erythrocytes measured per blood vessel (data are mean ± SEM of 4 (NAs) and 5 (TCVs) animals independently measured per blood vessel type, Kruskal-Wallis H-Test and Dunn’s multiple comparisons test, *p = 0.0159). (m) Absolute volumetric blood flow through different vessel types calculated from (i) and (l). Sinus blood flow could not be directly measured but was calculated from the measured values for NAs and TCVs (data are mean ± SEM based on data (i) and (l), Kruskal-Wallis H-Test and Dunn’s multiple comparisons test, ***p = 0.0003, *p = 0.0484). (n) Relative volumetric blood flow though different vessel types in murine tibia calculated from (e): TCVs make up 71.2% (41.6% arterial, 29.5% venous) of total volumetric blood flow through the CB in murine tibia. (o) Intra-vital TPLSM of LsyM-EGFP tibial (SHG, grey) vasculature (Rhodamine Dextran, red) shows the transport of EGFP+ leukocytes (green) through TCVS, NAs and the exiting sinus. The differing slopes of the transported leukocytes (filled arrowheads) indicate different transport speeds in the different vessel types. Scale bars = 10 μm. (p) Leukocytes (LysM-EGFP, green) can cross the compact bone (SHG, grey) by active crawling against the blood flow direction through TCVs (Rhodamine Dextran, red). Scale bars = 20μm. (All data of a, f, k, o, and p were repeated minimum 4 times in individual experiments with similar results).
Fig. 4
Fig. 4. Transcortical canals are remodeled by osteoclasts
(a) Osteoclast (CX3CR1-cre;tdTomato; red) locate along the endosteum (open arrowheads) and inside TCVs (filled arrowheads). Scale bars = 100 μm. (b) Schematic Fig. of arterial (red) and venous (turquoise) vessel organization in the bone marrow (BM) and the compact bone (CB). The indicated black box visualizes the scan area of (c). (c) Histological CLSM scans confirm osteoclast (CX3CR1-cre;tdTomato, red) location in TCVs (CD31, grey).Scale bar = 5 μm. (d) Higher magnification of indicated white box (c) emphasizes multiple nuclei (DAPI, blue, filled arrowheads) in the tdTomato+ osteoclast (red). Scale bars = 5 μm. (e) ELMI imaging of a burst tibia shows a TCV (white box) in the compact bone, which is magnified in (f). Scale bar = 50 μm. (f) The burst canal contains a blood vessel (filled arrowhead) and multiple canaliculi (open arrowheads). Scale bar = 5 μm. (g, h) TCV adjacent osteoclast (CX3CR1-cre;tdTomato, red) forms a resorption lacuna (filled arrowhead) indicated by actin fiber rearrangement (green, filled arrowhead) and lack of SHG signal of CB (grey). Scale bars = 5 μm. (i) hTNFtg and C57BL/6 WT Littermate tibiae show differences in cortical bone thickness (autofluorescence, grey) and TCV organization (CD31, red). Scale bars = 50 μm. (All experiments of a, c-i were repeated minimum three times individually with similar results). (j) hTNFtg mice exhibit significantly less TCVs than C57BL/6 groups. Non-significant reductions of TCV numbers between zoledronate treated groups and their control groups are detected (data are mean ± SEM of 6-8 tibiae/group, Kruskal-Wallis H-Test and Dunn’s multiple comparisons test). (k) μCT analysis of cortical bone volume (CBV) demonstrates significantly reduced CBV in hTNFtg mice compared to C57BL/6 WT Littermate mice. Zoledronate treatment non-significantly increases CBV in both strains compared to their control groups (data are mean ± SEM of 5-8 tibiae/group, Kruskal-Wallis H-Test and Dunn’s multiple comparisons test). (l) TCVs/mm3 CBV are calculated based on (j) and (k). Zoledronate treated hTNFtg mice show significantly reduced TCVs/mm3 compared to the untreated control group (109.9 ± 1.3 TCVs/mm3 to 77.44 ± 1.2 TCVs/mm3, ***p = 0.0005), while zoledronate treated C57BL/6 WT Littermate mice show a non-significant reduction of TCVs/mm3 (104.7 ± 1.2 TCVs/mm3 to 84.2 ± 0.9 TCVs/mm3, p = 0.1414). Untreated hTNFtg mice exhibit slightly more TCVs/mm3 than C57BL/6 mice (data are mean ± SEM of 5-8 tibiae/group, Kruskal-Wallis H-Test and Dunn’s multiple comparisons test).
Fig. 5
Fig. 5. Chronic but not acute arthritis affects TCV-formation
(a, b) Tibia sections of Treg depleted DBA/1 DEREG mice show healthy bone morphology of control groups (PBS/PBS, PBS/CFA d14), while arthritic tibiae (G6PI/CFA d62) show massive bone erosions at the distal metaphysis indicated via white dashed lines. Newly formed bone (white arrows) is clearly separated from the original bone surface as indicated via white dashed lines. Scale bars = 200 μm. Higher magnifications of indicated white boxes emphasize ICAM-1 and VCAM-1 (green) expression in TCVs. Control groups only show weak ICAM-1 and VCAM-1 signals, while TCVs in arthritic tibiae show high expression of both markers. Scale bars = 20 μm. (Analysis have been performed minimum three times individually with similar results). (c,d) Colocalization analysis (purple) of VCAM-1 and ICAM-1 (green) expression in TCVs (CD31, turquoise) reveal high Pearson’s correlation coefficients in G6PI/CFA treated groups at d62. ICAM-1 and VCAM-1 colocalization increases significantly in RA induced mice compared to PBS/PBS control groups (data are mean ± SEM of three individual measurements per group, Kruskal Wallis H-Test and Dunn’s multiple comparisons Test, VCAM-1 *p=0.0341, ICAM-1 *p = 0.0225). Scale bars = 20 μm. (e) TCV-numbers are not affected at d14 in Treg-depleted DBA1/DEREG mice but increase over time after application of PBS/CFA or G6PI/CFA. Exclusively the G6PI/CFA induced chronic arthritis induces a highly significant increase of TCV-numbers compared to d14-levels (data are mean ± SEM of d14 n = 8 PBS/PBS, 18 PBS/CFA, 15 G6PI/CFA tibiae, d62 n = 2 PBS/PBS, 12 PBS/CFA, 16 G6PI/CFA tibiae, Kruskal-Wallis H-Test and Dunn’s multiple comparisons test, ***p = 0.0002). (f) TCV-numbers do not differ at d62 after induction of acute arthritis compared to the control groups (data are mean ± SEM of n = 5 tibiae/group/timepoint, Kruskal-Wallis H-Test and Dunn’s multiple comparisons test,). (g) Twelve weeks after induction of chronic gut inflammation via no effects on TCV numbers could be observed in treated Gpr15gfp/+ Foxp3ires-mrfp mice compared to untreated control (data are mean ± SEM of 8 tibiae/group, two-sided Mann-Whitney U-Test). (h) Lethal irradiation and BM transfer induces a highly significant reduction (**p = 0.0043) of TCVs in C57BL/6JRj mice compared to untreated control group (data are mean ± SEM of 6 tibiae/group, two-sided Mann-Whitney U-Test).
Fig. 6
Fig. 6. Evidence for transcortical blood flow in human long bones
(a) Intraoperative situs of a fibula harvesting procedure of a 9 year old male patient. The periosteum was split and detached from the cortical bone. Typical spotty bleedings along the cortical shaft appear immediately after removal of a compress (arrowheads). (b) Intraoperative situs of a 17 year old male patient after femur fracture and malunion before axis correction with spot-like transcortical bleedings (arrowheads). (c) Magnification of the white box (b) emphasizing localized bleedings on the bone surface (arrowheads). (d) 3D reconstruction of 7T TOF MR angiography images from the right shank of a 47-year old healthy male. Tibia and fibula (gray) surrounded by muscle tissue (flesh-colored) and two vessel types (red and blue) running in parallel are visible. Scale bar = 50 mm. (e) Higher magnification of the tibia (white box in (d)) showing pores in the compact bone (filled arrowheads) and two distinct vessel types in the bone marrow (open arrowhead, blue; filled arrow, red). (f) Longitudinal optical section through the tibia emphasizes the intra-cortical blood supply. The NA (arrow) passes the bone shaft with the CS in close proximity (arrowhead). (g) Higher magnification of the white boxed area in (f) shows a canal in the compact bone (arrowhead) forming an ICL. (h) Optical cross section of the tibia illustrating close proximity of the NA (filled arrow) and the CS (open arrowhead). Canals in the CB are mainly running parallel to the bone shaft and occasionally connect to the medullary cavity and the bone surface (filled black arrowheads). Scale bars = 20 mm (e-h). (i) LSFM of a human femoral neck cross section shows a big artery (CD31+/Sca-1+, white arrow) entering the CB (white dotted line, autofluorescence, gray) from the periosteum (P) and an artery (filled arrowhead) running through trabeculi in the bone marrow (BM). Scale bar = 500 μm. (j, k) Human femoral neck (autofluorescence, gray) contains direct trans-cortical vessels (dTCVs, CD31, turquoise, α-SMA, red, filled arrowheads) with average diameters of 52.9 ± 9.6 μm (data are mean ± SEM of 41 vessels). Scale bars = 100 μm.

References

    1. Faury G. Function-structure relationship of elastic arteries in evolution: from microfibrils to elastin and elastic fibres. Pathol Biol (Paris) 2001;49:310–325. - PubMed
    1. Bettex DA, Pretre R, Chassot PG. Is our heart a well-designed pump? The heart along animal evolution. Eur Heart J. 2014;35:2322–2332. doi: 10.1093/eurheartj/ehu222. - DOI - PubMed
    1. Pittman RN. Oxygen transport in the microcirculation and its regulation. Microcirculation. 2013;20:117–137. doi: 10.1111/micc.12017. - DOI - PMC - PubMed
    1. Aitsebaomo J, Portbury AL, Schisler JC, Patterson C. Brothers and sisters: molecular insights into arterial-venous heterogeneity. Circ Res. 2008;103:929–939. doi: 10.1161/CIRCRESAHA.108.184937. - DOI - PMC - PubMed
    1. Sivaraj KK, Adams RH. Blood vessel formation and function in bone. Development. 2016;143:2706–2715. doi: 10.1242/dev.136861. - DOI - PubMed

Publication types