. 2020 Jan;50(1):73-85.
doi: 10.1002/eji.201948241. Epub 2019 Nov 14.

High-throughput compound screen reveals mTOR inhibitors as potential therapeutics to reduce (auto)antibody production by human plasma cells

Affiliations

High-throughput compound screen reveals mTOR inhibitors as potential therapeutics to reduce (auto)antibody production by human plasma cells

Paul Tuijnenburg et al. Eur J Immunol. 2020 Jan.

Abstract

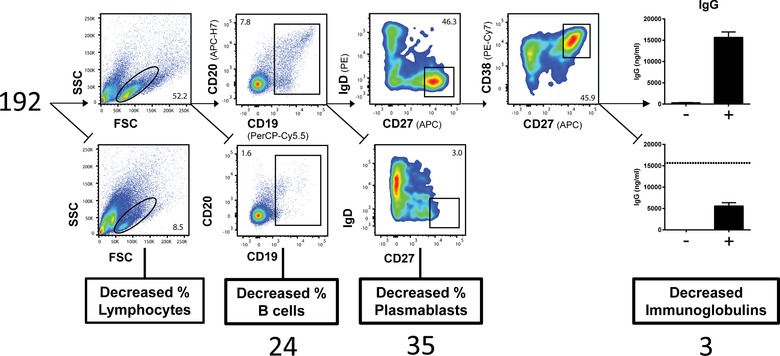
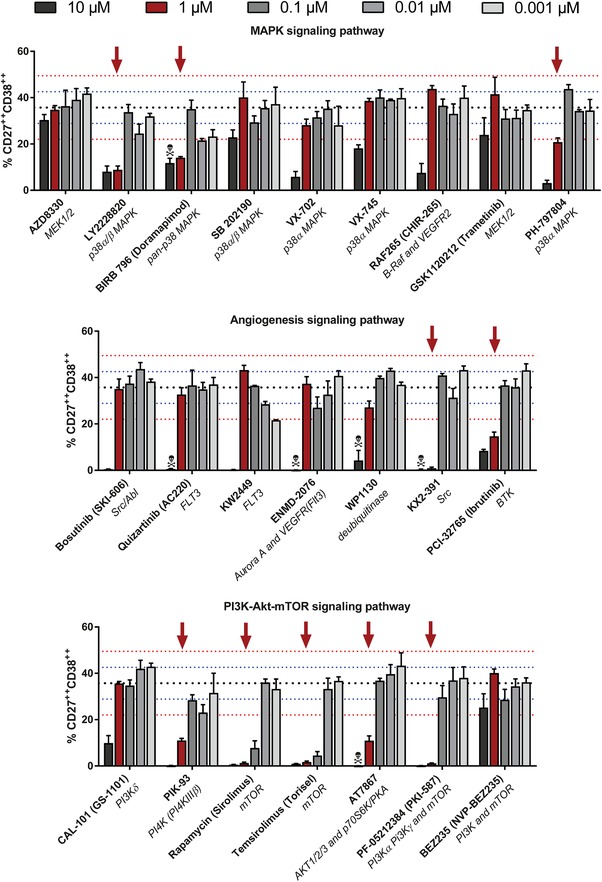
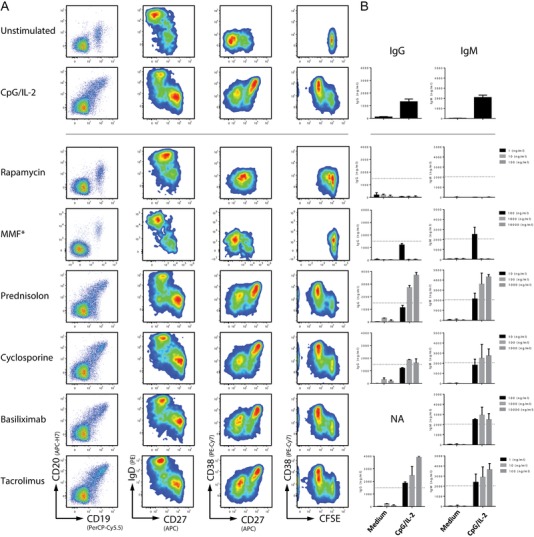
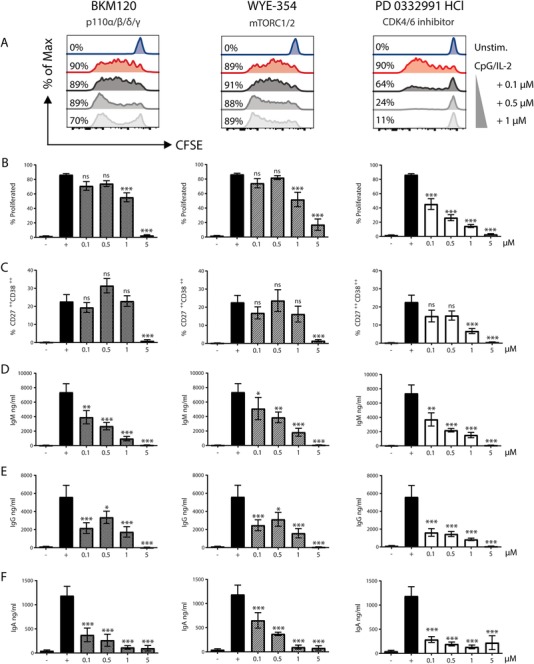
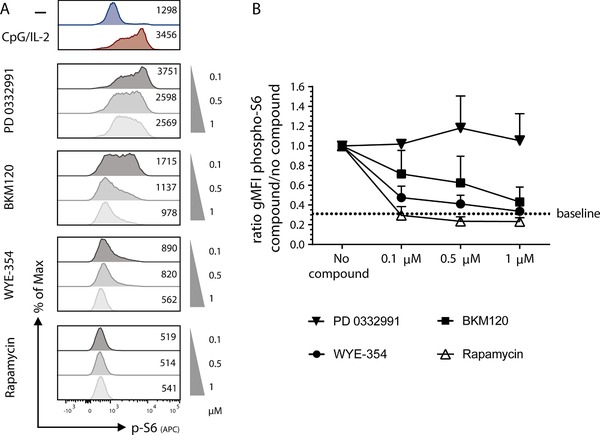
Antibody production by the B cell compartment is a crucial part of the adaptive immune response. Dysregulated antibody production in the form of autoantibodies can cause autoimmune disease. To date, B-cell depletion with anti-CD20 antibodies is commonly applied in autoimmunity, but pre-existing plasma cells are not eliminated in this way. Alternative ways of more selective inhibition of antibody production would add to the treatment of these autoimmune diseases. To explore novel therapeutic targets in signaling pathways essential for plasmablast formation and/or immunoglobulin production, we performed a compound screen of almost 200 protein kinase inhibitors in a robust B-cell differentiation culture system. This study yielded 35 small cell-permeable compounds with a reproducible inhibitory effect on B-cell activation and plasmablast formation, among which was the clinically applied mammalian target of rapamycin (mTOR) inhibitor rapamycin. Two additional compounds targeting the phosphoinositide 3-kinase-AKT-mTOR pathway (BKM120 and WYE-354) did not affect proliferation and plasmablast formation, but specifically reduced the immunoglobulin production. With this compound screen we successfully applied a method to investigate therapeutic targets for B-cell differentiation and identified compounds in the phosphoinositide 3-kinase-AKT-mTOR pathway that could specifically inhibit immunoglobulin production only. These drugs may well be explored to be of value in current B-cell-depleting treatment regimens in autoimmune disorders.

Keywords: B cells; B-cell activation and differentiation; PI3K-AKT-mTOR; autoimmune disease; plasma cells.


Conflict of interest statement

The authors declare no commercial or financial conflict of interest.

Figures

Figure 1
Figure 1
B‐cell differentiation‐based decision tree for compound screening. The gating strategy for the compound screen after 6 days of PBMC culture with CpG/IL‐2 stimulation: from left to right, each respective compound was classified based on percentage of lymphocytes gated by forward scatter (FSC)/side scatter (SSC); percentage of CD19+ CD20+ B cells; percentage of CD27++ CD38++ plasmablasts; and IgG, IgM, and IgA production (only a reduction in all immunoglobulins was classified as ‘Decreased Immunoglobulins’). Cut‐off values can be found in the Materials and Methods, pooled data (n = 3) from three independent experiments.
Figure 2
Figure 2
Validation of plasmablast‐inhibiting compounds. Plasmablast‐inhibiting compounds of the initial screening were validated in multiple concentrations around the initial dose of 1 µM. Again, PBMCs were stimulated with CpG/IL‐2 for 6 days. Plasmablasts were gated as CD19+CD20dim/+CD27++CD38++. Shown are the MAPK, angiogenesis, and PI3K‐AKT‐mTOR signaling pathways. Pooled data (n = 3) from three independent experiments. Black dotted line: mean percentage of CD27++ CD38++ B cells after 6 days of CpG/IL‐2 stimulation without compound (n = 72). Blue dotted line: ±1 SD. Red dotted line: ±2 SD. Red arrow: percentage of CD27++CD38++ B cells below −2 SD of CpG/IL‐2 stimulated cells without compound at the concentration used in the initial screen (1 µM). Toxicity symbol: percentage of lymphocytes below −2 SD of CpG/IL‐2 stimulated cells without compound.
Figure 3
Figure 3
B cell effects of rapamycin compared to commonly applied immunosuppressive drugs. (A) Flow cytometry plots for B‐cell proliferation by CFSE dilution and differentiation into plasmablast (IgD/CD27++/CD38++) after 6 days of culture with CpG/IL‐2. Therapeutic range concentrations were used for every immunosuppressive drug, including a tenfold higher and lower concentration. Shown are representative plots of the middle, therapeutic range, concentration of multiple experiments (n = 3). Asterisk: representative plots for mycophenolate mofetil (MMF) are from a separate experiment, since the three initially used concentrations were all lower than the therapeutic dose range. Now the correct concentration for MMF is shown, 1.000 ng/mL. (B) ELISA of IgG and IgM in the supernatant after 6 days of B cell culture at three concentrations for every immunosuppressive drug. Multiple experiments pooled and plotted as mean + SEM (n = 3 per concentration), dotted line equals mean of stimulated controls without any immunosuppressive drug added (n = 15).
Figure 4
Figure 4
BKM120 and WYE‐354 reduce immunoglobulin production of all isotypes, without reducing plasmablast formation. Proliferation, plasmablast differentiation and immunoglobulin production for BKM120 (left), WYE‐354 (middle), and PD 0332991 (right) after 6 days of CpG/IL‐2 stimulation. (A) Representative histogram plots of CFSE for concentration 0.1–1 µM, percentages represent proportion B cells with at least one cell division. Summary graphs of multiple flow cytometry experiments for (B) percentage proliferated B cells and (C) percentage CD27++ CD38++ plasmablasts. Immunoglobulin production measured by ELISA in 6‐day culture supernatant for (D) IgM, (E) IgG, and (F) IgA. Symbols: − unstimulated, + stimulated with CpG/IL‐2. Multiple experiments pooled and shown as mean ± SEM (for concentrations 0.1–1 µM n = 6 to 10, concentration 5 µM n = 4). p values were determined by one‐way ANOVA, ns not significant, *p ≤ 0.05, **p ≤ 0.01, ***p ≤ 0.001.
Figure 5
Figure 5
Partial inhibition of pospho‐S6 upon activation by adding BKM120 and WYE‐354. PBMCs were stimulated for 4 h with CpG/IL‐2 and different concentrations of compound were added, 0.1–1 µM. Phosphorylated‐S6 (gMFI) was measured as a read‐out for mTORC1 activation, gated on CD19+ B cells. (A) Representative histogram plots of p‐S6 after stimulation with increasing amounts of compounds with rapamycin as a control, numbers represent gMFI. (B) Pooled summary graph of multiple experiments (mean + SEM, n = 3), the ratio p‐S6 expression after CpG/IL‐2 with the addition of a compound at a certain concentration divided by the p‐S6 expression without compound. Dotted line labeled as ‘baseline’ indicates the mean ratio of the unstimulated samples without compound.

References

    1. Durandy, A. , Kracker, S. and Fischer, A. , Primary antibody deficiencies. Nat. Rev. Immunol. 2013. 13: 519–533. - PubMed
    1. Suurmond, J. and Diamond, B. , Autoantibodies in systemic autoimmune diseases: specificity and pathogenicity. J. Clin. Invest. 2015. 125: 2194–2202. - PMC - PubMed
    1. aan de Kerk, D. J. , Jansen, M. H. , ten Berge, I. J. , van Leeuwen, E. M. and Kuijpers, T. W. , Identification of B cell defects using age‐defined reference ranges for in vivo and in vitro B cell differentiation. J. Immunol. 2013. 190: 5012–5019. - PubMed
    1. Nijwening, J. H. and Beijersbergen, R. L. , Using large‐scale RNAi screens to identify novel drug targets for cancer. IDrugs 2010. 13: 772–777. - PubMed
    1. Bernards, R. , Brummelkamp, T. R. and Beijersbergen, R. L. , shRNA libraries and their use in cancer genetics. Nat. Methods 2006. 3: 701–706. - PubMed

Publication types

MeSH terms