. 2020 Jun 1;146(11):3184-3195.
doi: 10.1002/ijc.32743. Epub 2019 Nov 6.

GD2-directed CAR-T cells in combination with HGF-targeted neutralizing antibody (AMG102) prevent primary tumor growth and metastasis in Ewing sarcoma

Affiliations

GD2-directed CAR-T cells in combination with HGF-targeted neutralizing antibody (AMG102) prevent primary tumor growth and metastasis in Ewing sarcoma

Manish Charan et al. Int J Cancer. .

Abstract

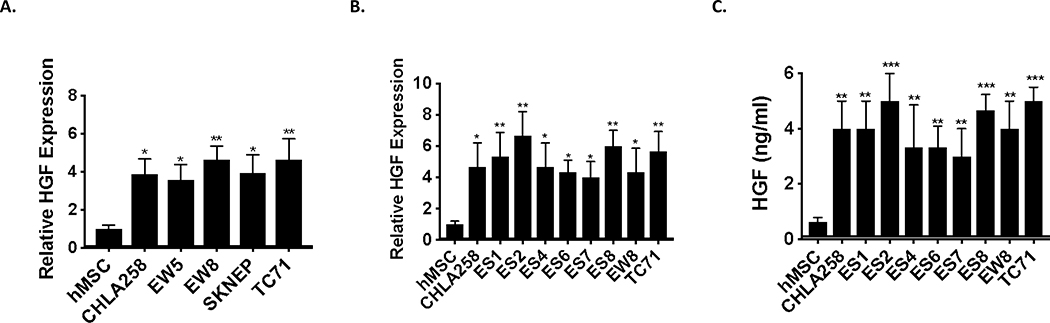
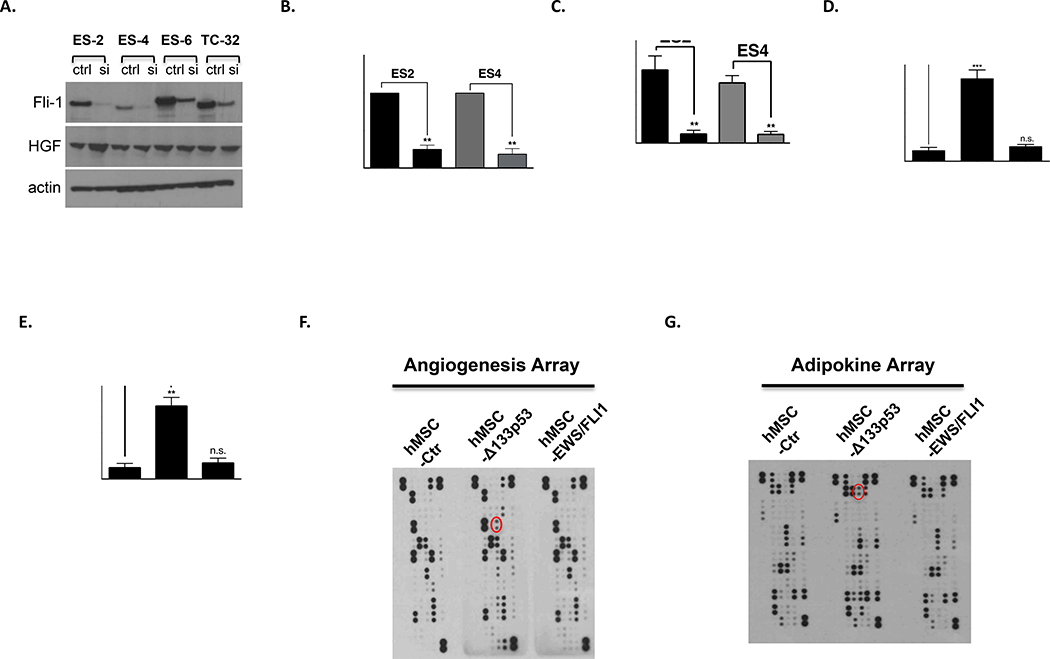
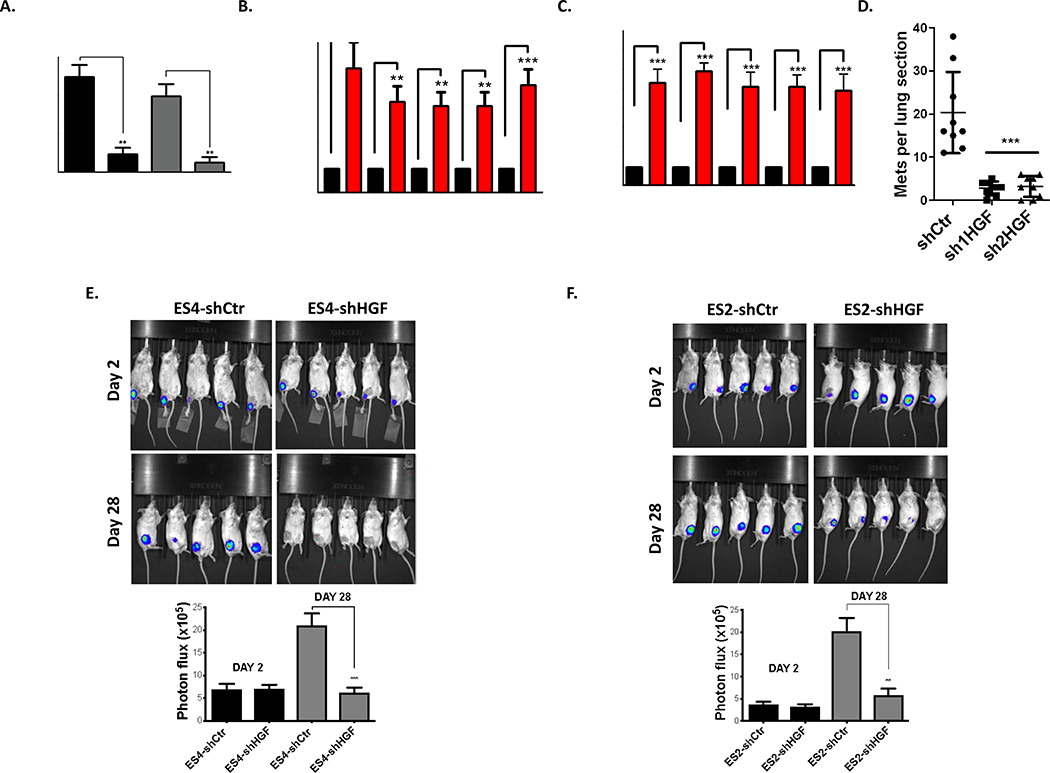
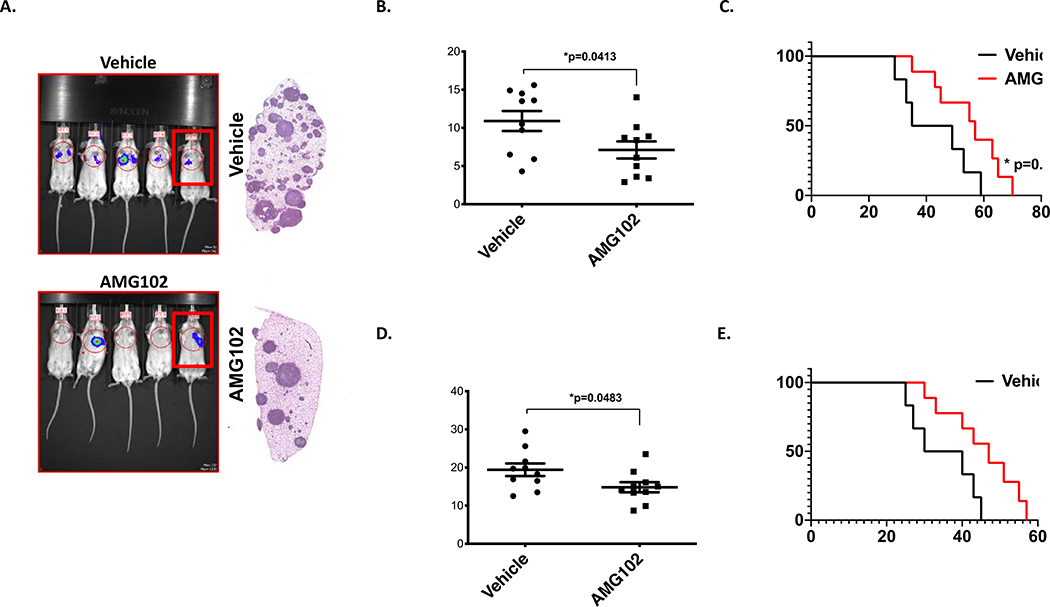
Ewing sarcoma (EWS) is the second most common and aggressive type of metastatic bone tumor in adolescents and young adults. There is unmet medical need to develop and test novel pharmacological targets and novel therapies to treat EWS. Here, we found that EWS expresses high levels of a p53 isoform, delta133p53. We further determined that aberrant expression of delta133p53 induced HGF secretion resulting in tumor growth and metastasis. Thereafter, we evaluated targeting EWS tumors with HGF receptor neutralizing antibody (AMG102) in preclinical studies. Surprisingly, we found that targeting EWS tumors with HGF receptor neutralizing antibody (AMG102) in combination with GD2-specific, CAR-reengineered T-cell therapy synergistically inhibited primary tumor growth and establishment of metastatic disease in preclinical models. Furthermore, our data suggested that AMG102 treatment alone might increase leukocyte infiltration including efficient CAR-T access into tumor mass and thereby improves its antitumor activity. Together, our findings warrant the development of novel CAR-T-cell therapies that incorporate HGF receptor neutralizing antibody to improve therapeutic potency, not only in EWS but also in tumors with aberrant activation of the HGF/c-MET pathway.

Keywords: AMG102; CAR-T cell therapy; Ewing sarcoma; HGF; delta133p53; metastasis; preclinical studies.


Conflict of interest statement

Conflict of interest statement: The authors declare no conflicts of interest.

Figures

Figure 1.
Figure 1.. Ewing sarcoma tumors and cells aberrantly express and secret high level of HGF.
A-B. RT-qPCR was used to assay HGF mRNA levels in the indicated pediatric xenograft EWS tumors (A) and cell lines (B) and compared to human Mesenchymal Stem Cells, hMSC (putative cell of origin). Total RNA was reverse-transcribed and subjected to real-time PCR with probes specific for HGF. Results were normalized to GAPDH. C. ELISA assay for HGF protein secretion in EWS cells. Indicated EWS cell lines were cultured in media containing 1% FBS for 48 hr, and used for human HGF ELISA assays as described in materials and methods. Unpaired Student’s t-tests (vs hMSC), * p <0.05, ** p <0.01, *** p <0.001.
Figure 2.
Figure 2.. Δ133p53 expression drives HGF expression and secretion.
A. HGF expression does not correlate with EWS/FLI1 expression in EWS cell lines. Indicated cell lines were transfected either scrambled control (ctrl) or siRNA targeting Fli-1 (Dharmacon). After 72h transfection, knockdown efficiency of Fli-1 and the expression of HGF were analyzed by western blot. B. HGF expression from indicated cell lines was analyzed by RT-qPCR. Results were first normalized to GAPDH and subsequently data were normalized to the control. Data shown are mean ± SD of triplicate measurements from one representative experiment. C. Indicated EWS cell lines were cultured in media containing 1% FBS for 48 hr, and serum were used for human HGF ELISA assay according to the manufacturer’s protocol (R&D Systems). D. Immortalized hMSCs were transduced separately with empty vector, Δ133p53 or EWS/FLI expressing lentiviruses and recombinant protein expression was verified by western blot analysis (Supplementary Figure 1F). After results were normalized to GAPDH, HGF expression from indicated cell lines is analyzed as in Fig. 1A-B. E. HGF ELISA assay from indicated hMSCs were performed similar in Fig. 1C. F-G. Cell extracts from hMSC transduced with lentiviral expression vectors were analyzed using indicated profiler antibody arrays according to the manufacturer’s instructions (R&D Systems). Red circle marks HGF. (B-E) Data sets were analyzed with unpaired student’s t-test and significance between two groups is shown **p < 0.01, *** p <0.001, n.s. (not significant).
Figure 3.
Figure 3.. High-level of HGF secretion drives primary tumor growth in the bone environment and metastasis to the lung.
A. Invasion assays were carried out using Matrigel precoated inserts (Corning) as described in . Representative fields of stained cells were counted. Assays were performed in triplicate for each group. Results are expressed as relative number of cells migrating compared to total number of cells loaded onto the inserts. B. HGF expression is enriched in EWS cell lines developed for high metastatic potential compared to their parental cells. RT-qPCR was used to assay HGF mRNA levels in primary versus matched metastatic cell lines. Experimental data were first normalized to the parental cells group and presented as fold change. C. HGF ELISA assays from indicated EWS cells were performed similar in Fig. 1C. Experimental data were first normalized to the parental cells group and presented as fold change. D. HGF inhibition revealed significantly lower metastatic burden. NSG mice were inoculated via tail vein with highly metastatic MAN020E cells (MAN020E-shCtr, MAN020E-sh1HGF and MAN020E-sh2HGF). The numbers of lung sections with metastatic nodules were compared with the 1-way ANOVA with Tukey’s post hoc test. *** p <0.001 relative to MAN020E-shCtr. E-F. Significant reduction of the tumor growth following HGF inhibition. 1×10⁵ Luciferase expressing EWS cells were injected into the tibia of NSG mice (n=10 for each group). A representative cage from each group is shown. Bioluminescence imaging studies were conducted using the Xenogen IVIS Spectrum at days 2 and 28. The below graph shows the quantitation of bioluminescence between two groups at indicated days. The bioluminescence intensity was quantified using Living Image Software. Signal intensity was quantified as the sum of detected photons per second within the region of interest. (A-C, E-F) Data sets were analyzed with Living Image Software (Caliper Life Sciences) unpaired student’s t-test and significance between two groups is shown * p <0.05, ** p <0.01, *** p <0.001.
Figure 4.
Figure 4.. Pharmacologic targeting c-Met/HGF signaling moderately reduces metastatic lung colonization and primary tumor growth.
A. Mice inoculated with 1×10⁶ MAN020E -luc cells were treated with AMG102 or Vehicle (n=10, for each group). Bioluminescent imaging completed at 28 days post-inoculation. Some mice in the AMG102 treatment group, showing no visible luminescence, exhibited response at early timepoints, but all subsequently developed metastasis. A representative cage from each group is shown. Right: gross appearance of representative lung blocks taken from the mice identified with box in the image at the time of euthanasia (endpoint criteria as described in . B. Quantification of the lung-field bioluminescence from day 28 (n=10 mice per group), Data sets were analyzed with unpaired student’s t-test and significance between two groups is * p=0.0413). C. Kaplan- Meier survival analysis of the mice. As noted, treatment continued until day 42, and then was stopped. Mice that received single AMG102 therapy experienced moderately better outcomes than those who received no treatment (n=10 mice per group, Mantel-Cox log-rank test, comparison to vehicle). * p=0.0494. D. Quantification of bioluminescence from the tibia at day 28 was performed similar as Figures 3E-F. Data sets were analyzed with unpaired student’s t-test and significance between two groups is * p=0.0483. Ten mice per group were used. E. Kaplan- Meier survival analysis of the mice. As noted, treatments were started after tumor volumes reached 0.5cm3 (around two weeks) continued for four weeks. Mice that received single AMG102 therapy experienced moderately better outcomes than those who received no treatment (n=10 mice per group, Mantel-Cox log-rank test, comparison to vehicle).
Figure 5.
Figure 5.. The in vitro activity of GD2 directed CAR-T cells to EWS cells.
A. Expression of GD2 specific mouse scFv on transduced T-cells was evaluated by flow cytometry as described in material and methods. Histograms were gated with the percentage of positive cells. Untransduced (UTD) T cells served as negative controls. B-D. Results of cytokine release assay. The level of different cytokines, including IL-2, TNF-α, and IFN-γ, were assayed as described in materials and methods. The cytokine secretions between two groups (UTD vs CAR-T) were compared with ordinary Two-way Anova analysis, ***, P < 0.001. ****, P < 0.0001. E. The quantitation of the number of IFN-γ reactive spots. (UTD vs CAR-T) were compared with ordinary Two-way Anova analysis, ****, P < 0.0001. F. Chromium release assays of cytotoxicity of CAR-T or UTD T cells at ratios from 40:1 to 0.6:1 with either ES2 or ES4 targets. Plots indicate means ± SEM of triplicate wells. G. Long-term proliferation of CAR or UTD T cells in response to repetitive stimulation with either antigen (GD2-transduced A204 cells, 2nd and 3rd stimulation) or anti-CD3/CD28 beads (1st stimulation).
Figure 6.
Figure 6.. Combined therapy with AMG102 and CAR-T treatment prevents both metastatic lung colonization and growth of primary orthotopic tumors.
A. Bioluminescent imaging completed at 42 days post-inoculation. A representative cage from each group is shown. B. Quantification of the lung-field bioluminescence from day 50. C. Survival analysis of the mice shown. Mice that received combination therapy experienced significantly better outcomes than those who received no treatment or treatment with only one inhibitor (n=10 mice per group, Mantel-Cox log-rank test, comparison to UTD). D-E. Quantification of bioluminescence from the tibia at day 28 was performed as in Figures 3E-F. Data sets were analyzed with unpaired student’s t-test and significance between the groups is shown. Ten mice per group were used. Below, representative MicroCT scans taken from the mice identified with box in the image. AMG102+UTD mouse showing osteolytic lesion (arrow) in contrast to AMG102+CAR-T treated one. F. Survival analysis of the mice shown. As noted, treatments were started after tumor volumes reached 0.5cm3 (around two weeks) continued for four weeks as described above. In contrast to UTD treated group, mice that received AMG102+UTD therapy experienced moderately better outcomes. However, combined therapy with AMG102 and CAR-T treatment significant results survival increase at ****P level vs UTD and ***P vs AMG102+UTD. (n=10 mice per group, Mantel-Cox log-rank test, comparison to UTD).

Similar articles

Cited by

References

    1. Grohar PJ, Helman LJ. Prospects and challenges for the development of new therapies for Ewing sarcoma. Pharmacol Ther 2013;137: 216–224. - PMC - PubMed
    1. Esiashvili N, Goodman M, Marcus RB, Jr. Changes in incidence and survival of Ewing sarcoma patients over the past 3 decades: Surveillance Epidemiology and End Results data. J Pediatr Hematol Oncol 2008;30: 425–430. - PubMed
    1. Lokker NA, Mark MR, Luis EA, Bennett GL, Robbins KA, Baker JB, Godowski PJ. Structure-function analysis of hepatocyte growth factor: identification of variants that lack mitogenic activity yet retain high affinity receptor binding. EMBO J 1992;11: 2503–2510. - PMC - PubMed
    1. Jeffers M, Schmidt L, Nakaigawa N, Webb CP, Weirich G, Kishida T, Zbar B, Vande Woude GF. Activating mutations for the met tyrosine kinase receptor in human cancer. Proc Natl Acad Sci U S A 1997;94: 11445–11450. - PMC - PubMed
    1. Trusolino L, Comoglio PM. Scatter-factor and semaphorin receptors: cell signalling for invasive growth. Nat Rev Cancer 2002;2: 289–300. - PubMed

Publication types

MeSH terms