

Induced pluripotent stem cells reprogrammed from primary dendritic cells provide an abundant source of immunostimulatory dendritic cells for use in immunotherapy
- PMID: 31621975
- PMCID: PMC7003857
- DOI: 10.1002/stem.3095
Induced pluripotent stem cells reprogrammed from primary dendritic cells provide an abundant source of immunostimulatory dendritic cells for use in immunotherapy
Abstract
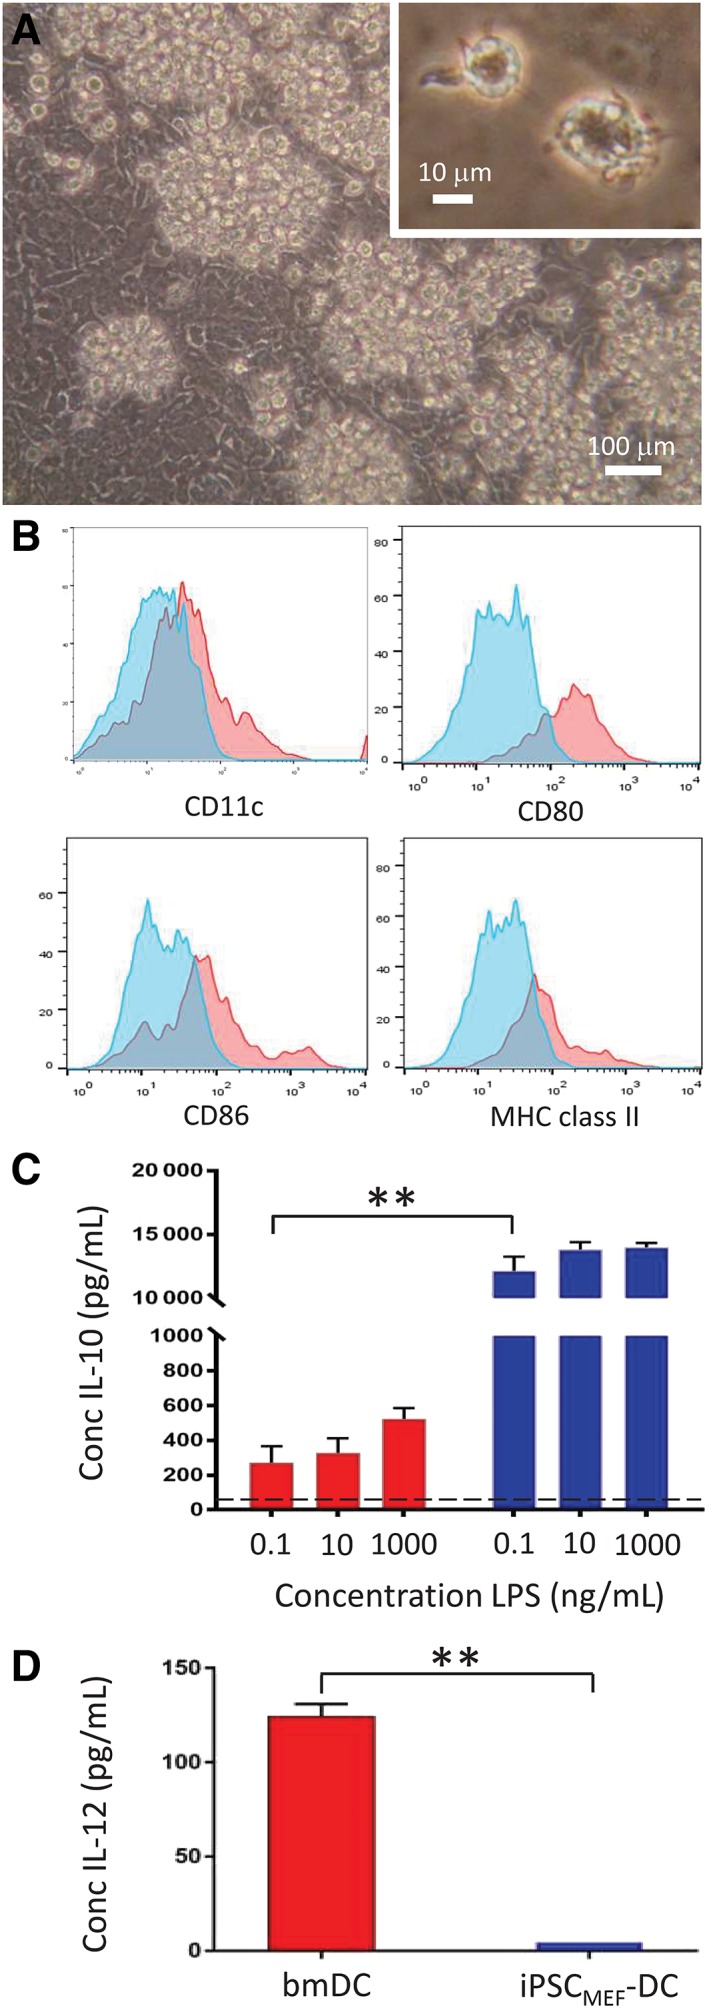
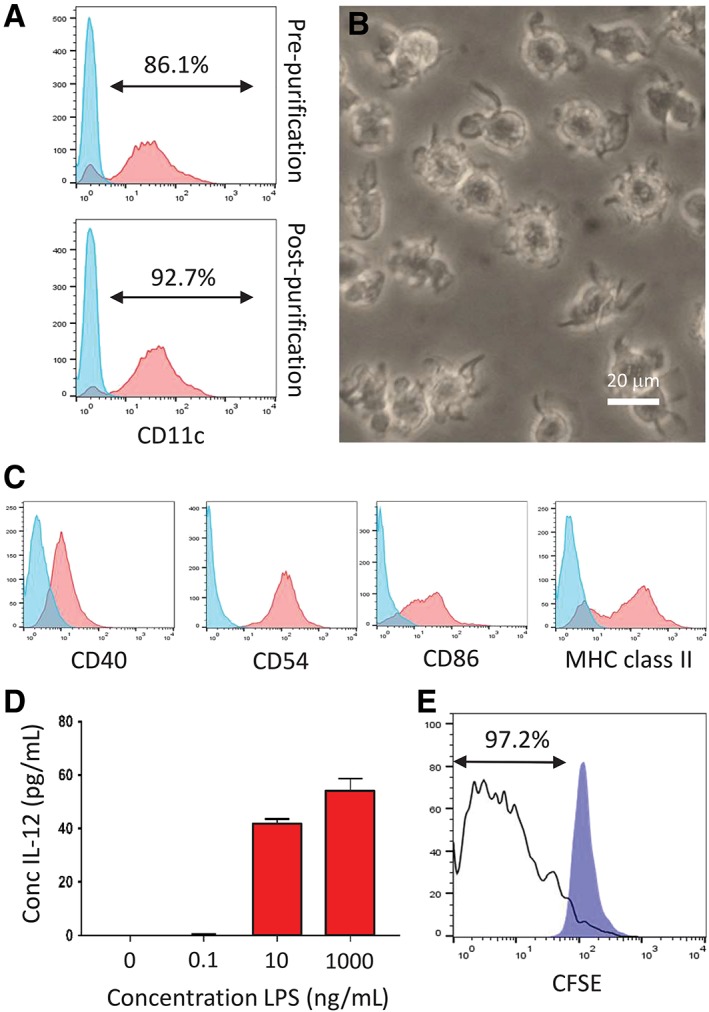
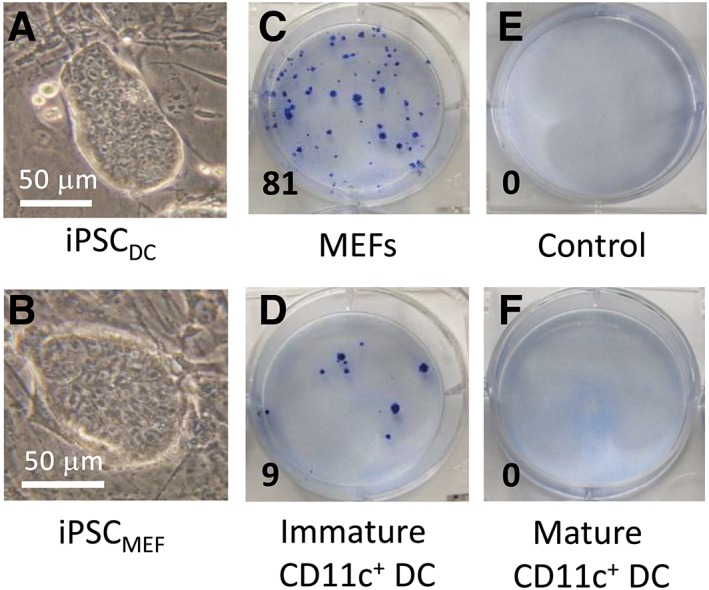
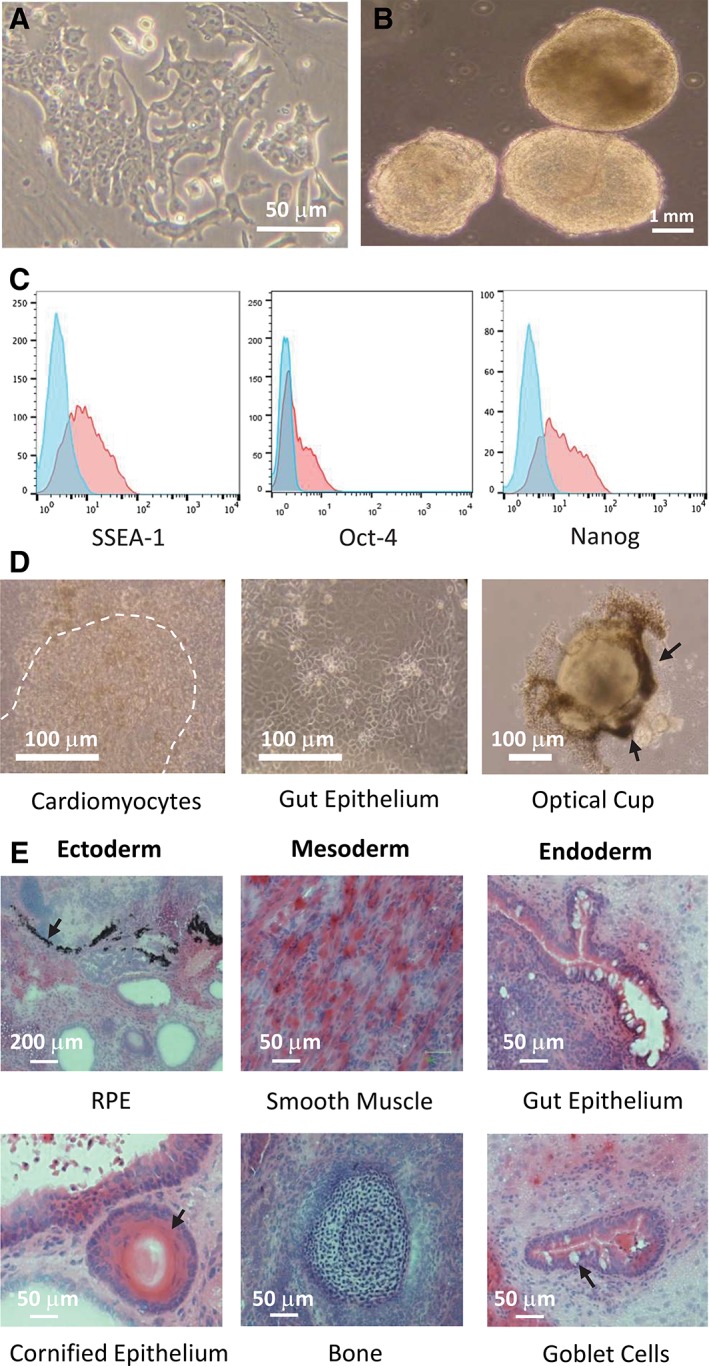
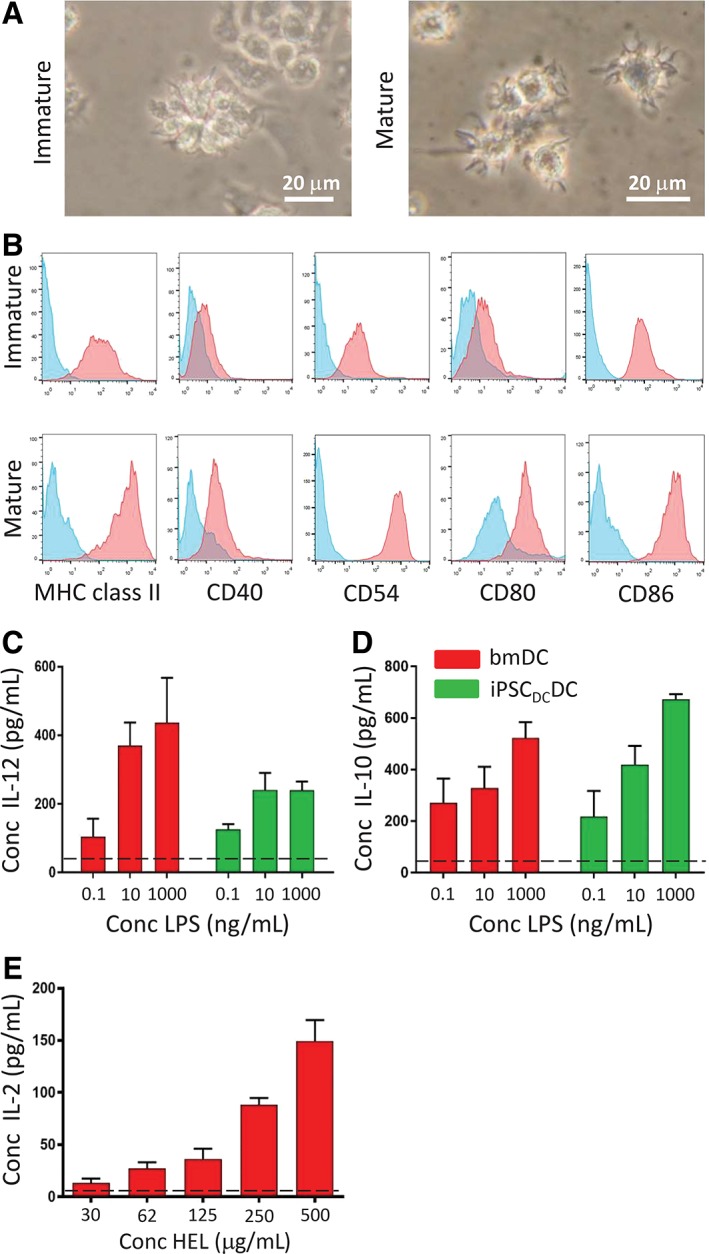
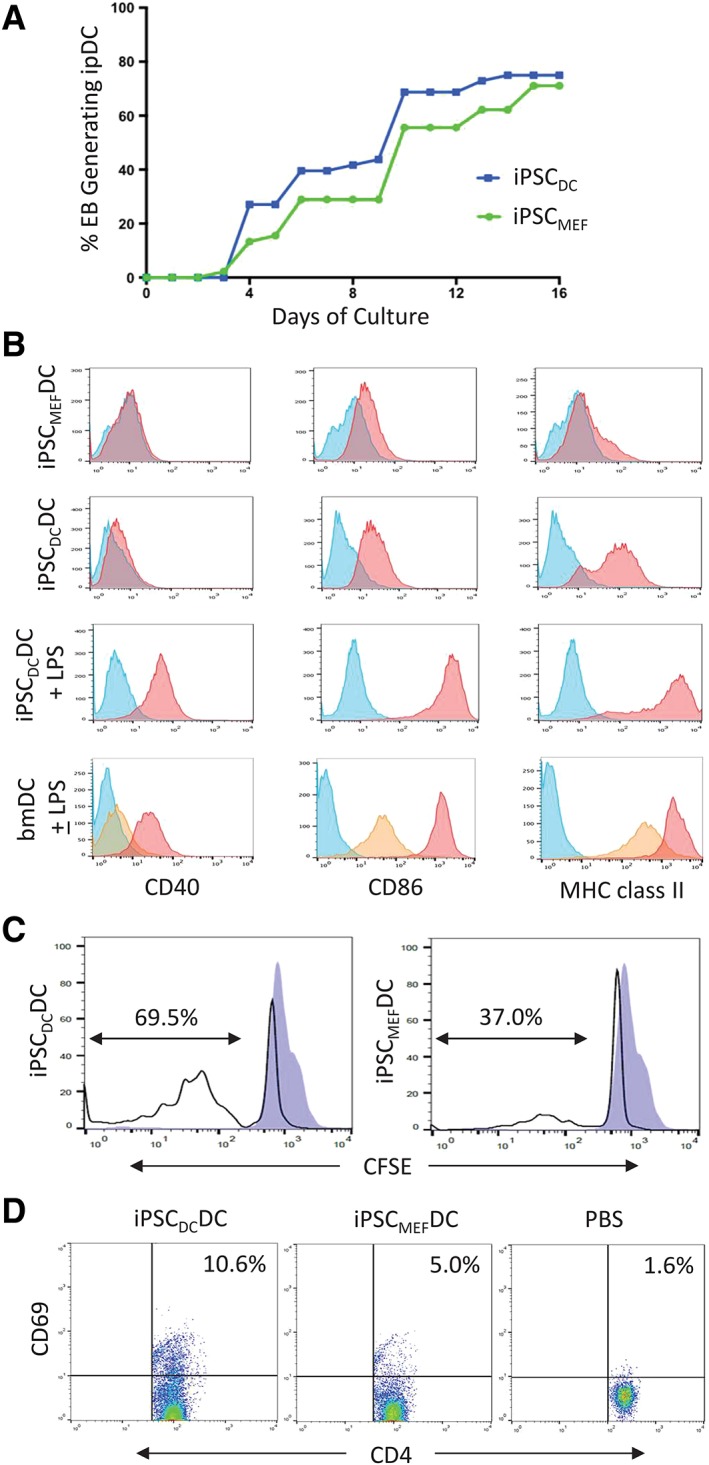
Cell types differentiated from induced pluripotent stem cells (iPSCs) are frequently arrested in their development program, more closely resembling a fetal rather than an adult phenotype, potentially limiting their utility for downstream clinical applications. The fetal phenotype of iPSC-derived dendritic cells (ipDCs) is evidenced by their low expression of MHC class II and costimulatory molecules, impaired secretion of IL-12, and poor responsiveness to conventional maturation stimuli, undermining their use for applications such as immune-oncology. Given that iPSCs display an epigenetic memory of the cell type from which they were originally derived, we investigated the feasibility of reprogramming adult DCs to pluripotency to determine the impact on the phenotype and function of ipDCs differentiated from them. Using murine bone marrow-derived DCs (bmDCs) as proof of principle, we show here that immature DCs are tractable candidates for reprogramming using non-integrating Sendai virus for the delivery of Oct4, Sox2, Klf4, and c-Myc transcription factors. Reprogramming efficiency of DCs was lower than mouse embryonic fibroblasts (MEFs) and highly dependent on their maturation status. Although control iPSCs derived from conventional MEFs yielded DCs that displayed a predictable fetal phenotype and impaired immunostimulatory capacity in vitro and in vivo, DCs differentiated from DC-derived iPSCs exhibited a surface phenotype, immunostimulatory capacity, and responsiveness to maturation stimuli indistinguishable from the source DCs, a phenotype that was retained for 15 passages of the parent iPSCs. Our results suggest that the epigenetic memory of iPSCs may be productively exploited for the generation of potently immunogenic DCs for immunotherapeutic applications.
Keywords: dendritic cell; epigenetic memory; immunostimulation; immunotherapy; induced pluripotent stem cell; maturation.
©2019 The Authors. Stem Cells published by Wiley Periodicals, Inc. on behalf of AlphaMed Press 2019.
Conflict of interest statement
P.J.F., T.D., and C.H. jointly own intellectual property relevant to the research reported here. The other authors indicated no financial relationships.
Figures
Similar articles
-
Reactivation of Endogenous Genes and Epigenetic Remodeling Are Barriers for Generating Transgene-Free Induced Pluripotent Stem Cells in Pig.PLoS One. 2016 Jun 23;11(6):e0158046. doi: 10.1371/journal.pone.0158046. eCollection 2016. PLoS One. 2016. PMID: 27336671 Free PMC article.
-
A real-time pluripotency reporter for the long-term and real-time monitoring of pluripotency changes in induced pluripotent stem cells.Aging (Albany NY). 2022 May 15;14(10):4445-4458. doi: 10.18632/aging.204083. Epub 2022 May 15. Aging (Albany NY). 2022. PMID: 35575836 Free PMC article.
-
The levels of reprogramming factors influence the induction and maintenance of pluripotency: the case of CD1 mouse strain cells.Int J Dev Biol. 2021;65(4-5-6):365-376. doi: 10.1387/ijdb.200233lc. Int J Dev Biol. 2021. PMID: 32930373
-
Mechanism of Induction: Induced Pluripotent Stem Cells (iPSCs).J Stem Cells. 2015;10(1):43-62. J Stem Cells. 2015. PMID: 26665937 Review.
-
Patient-derived induced pluripotent stem cells for models of cancer and cancer stem cell research.J Formos Med Assoc. 2018 Dec;117(12):1046-1057. doi: 10.1016/j.jfma.2018.06.013. Epub 2018 Aug 29. J Formos Med Assoc. 2018. PMID: 30172452 Review.
Cited by
-
TF-Marker: a comprehensive manually curated database for transcription factors and related markers in specific cell and tissue types in human.Nucleic Acids Res. 2022 Jan 7;50(D1):D402-D412. doi: 10.1093/nar/gkab1114. Nucleic Acids Res. 2022. PMID: 34986601 Free PMC article.
-
A Concise Review on Induced Pluripotent Stem Cell-Derived Cardiomyocytes for Personalized Regenerative Medicine.Stem Cell Rev Rep. 2021 Jun;17(3):748-776. doi: 10.1007/s12015-020-10061-2. Epub 2020 Oct 23. Stem Cell Rev Rep. 2021. PMID: 33098306 Review.
-
Cell Fate Reprogramming in the Era of Cancer Immunotherapy.Front Immunol. 2021 Jul 21;12:714822. doi: 10.3389/fimmu.2021.714822. eCollection 2021. Front Immunol. 2021. PMID: 34367185 Free PMC article. Review.
-
Ex vivo pulsed dendritic cell vaccination against cancer.Acta Pharmacol Sin. 2020 Jul;41(7):959-969. doi: 10.1038/s41401-020-0415-5. Epub 2020 May 4. Acta Pharmacol Sin. 2020. PMID: 32366940 Free PMC article. Review.
-
Unlocking the Potential of Induced Pluripotent Stem Cells in Revolutionizing Cancer Therapy.Curr Stem Cell Res Ther. 2025;20(4):360-376. doi: 10.2174/011574888X294791240408055222. Curr Stem Cell Res Ther. 2025. PMID: 38629370 Review.
References
-
- Anguille S, Smits EL, Lion E, et al. Clinical use of dendritic cells for cancer therapy. Lancet Oncol. 2014;15:e257‐e267. - PubMed
-
- Sontag S, Förster M, Qin J, et al. Modelling IRF8 deficient human hematopoiesis and dendritic cell development with engineered iPS cells. Stem Cells. 2017;35:898‐908. - PubMed
-
- Silk KM, Silk JD, Ichiryu N, et al. Cross‐presentation of tumour antigens by human induced pluripotent stem cell‐derived CD141+XCR1+ dendritic cells. Gene Ther. 2012;19:1035‐1040. - PubMed
Publication types
MeSH terms
Grants and funding
LinkOut - more resources
Full Text Sources
Molecular Biology Databases
Research Materials
