. 2019 Mar;38(3):686-696.
doi: 10.1109/TMI.2018.2870343.

Breast Cancer Diagnosis in Digital Breast Tomosynthesis: Effects of Training Sample Size on Multi-Stage Transfer Learning Using Deep Neural Nets

Breast Cancer Diagnosis in Digital Breast Tomosynthesis: Effects of Training Sample Size on Multi-Stage Transfer Learning Using Deep Neural Nets

Ravi K Samala et al. IEEE Trans Med Imaging. 2019 Mar.

Abstract

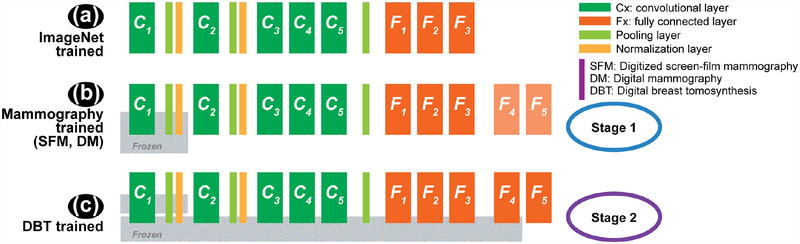
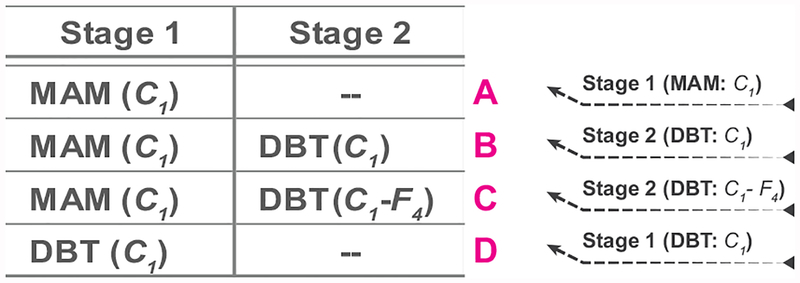
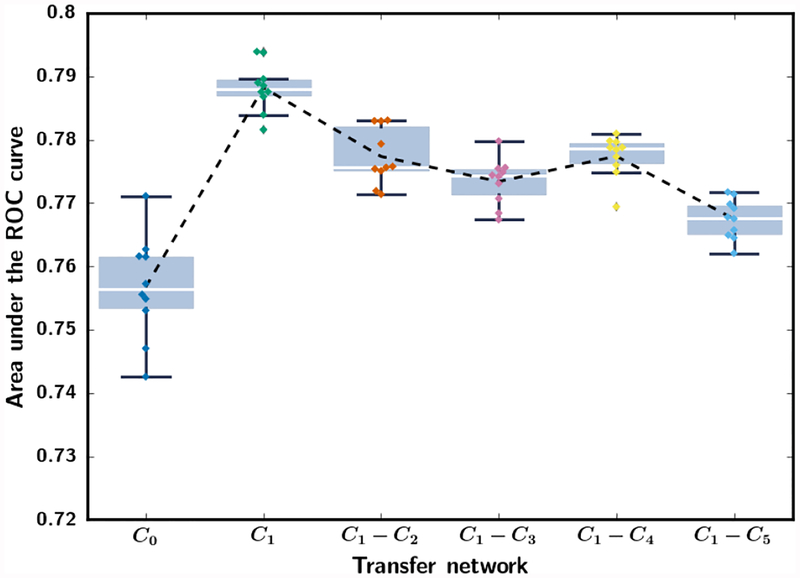
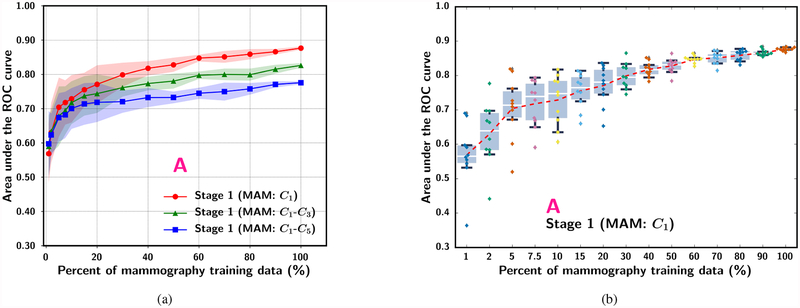
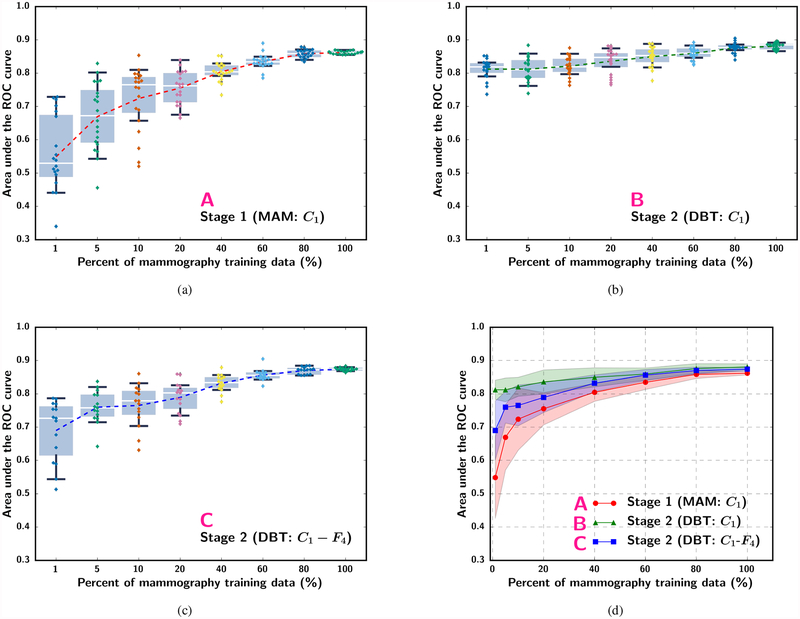
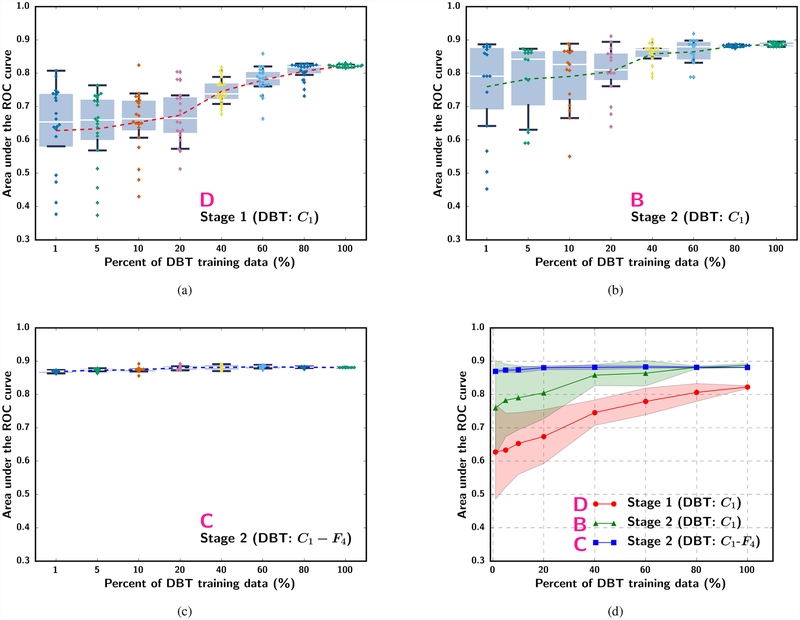
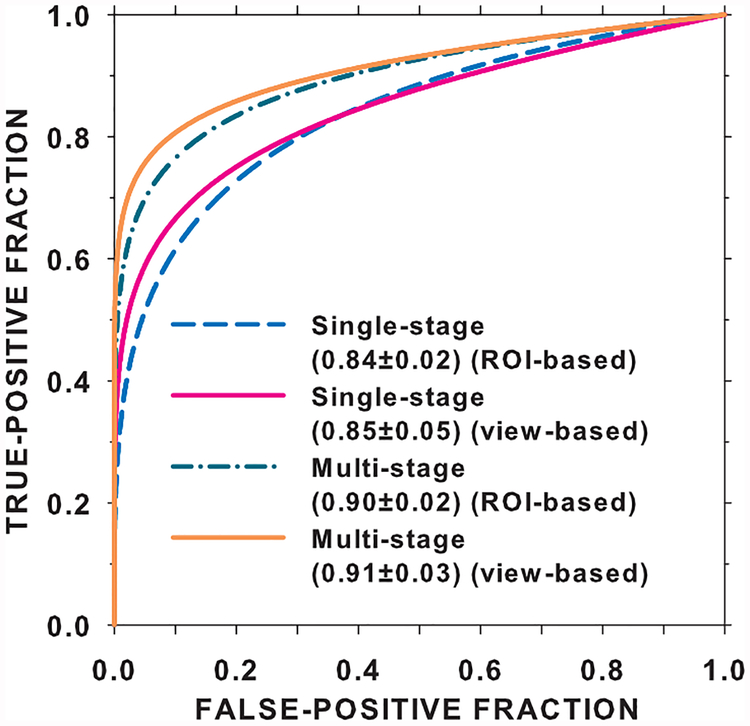
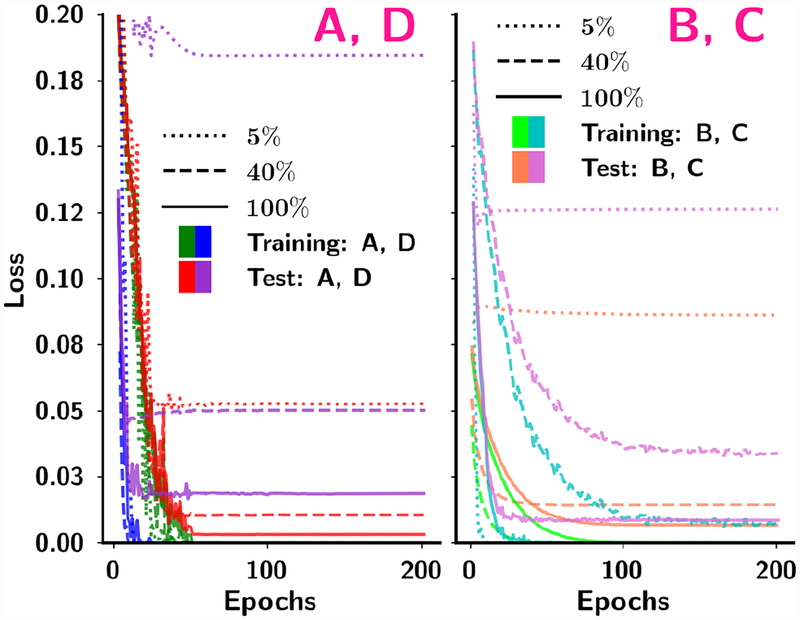
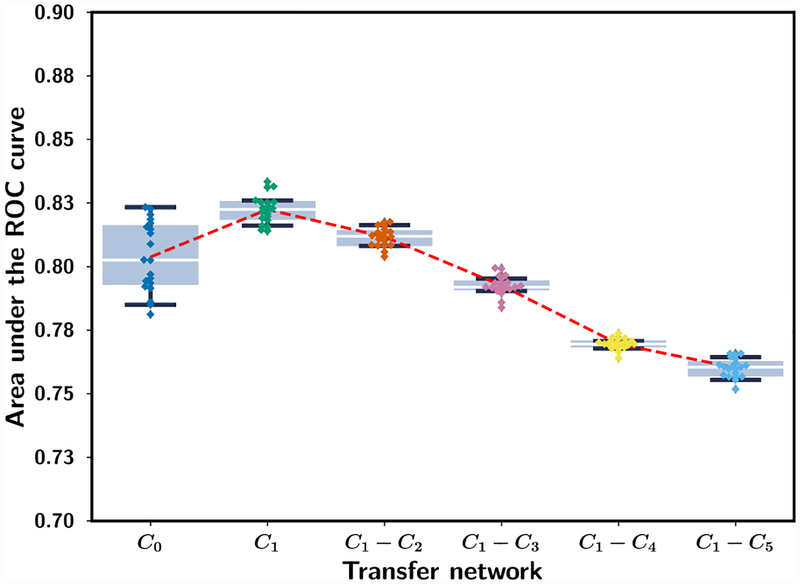
In this paper, we developed a deep convolutional neural network (CNN) for the classification of malignant and benign masses in digital breast tomosynthesis (DBT) using a multi-stage transfer learning approach that utilized data from similar auxiliary domains for intermediate-stage fine-tuning. Breast imaging data from DBT, digitized screen-film mammography, and digital mammography totaling 4039 unique regions of interest (1797 malignant and 2242 benign) were collected. Using cross validation, we selected the best transfer network from six transfer networks by varying the level up to which the convolutional layers were frozen. In a single-stage transfer learning approach, knowledge from CNN trained on the ImageNet data was fine-tuned directly with the DBT data. In a multi-stage transfer learning approach, knowledge learned from ImageNet was first fine-tuned with the mammography data and then fine-tuned with the DBT data. Two transfer networks were compared for the second-stage transfer learning by freezing most of the CNN structures versus freezing only the first convolutional layer. We studied the dependence of the classification performance on training sample size for various transfer learning and fine-tuning schemes by varying the training data from 1% to 100% of the available sets. The area under the receiver operating characteristic curve (AUC) was used as a performance measure. The view-based AUC on the test set for single-stage transfer learning was 0.85 ± 0.05 and improved significantly (p <; 0.05$ ) to 0.91 ± 0.03 for multi-stage learning. This paper demonstrated that, when the training sample size from the target domain is limited, an additional stage of transfer learning using data from a similar auxiliary domain is advantageous.


Figures

Fig. 1.
Fig. 1.
Overview of the CNN structures used in the multi-stage transfer learning. (a) ImageNet trained CNN with five convolutional layers and four fully connected layers. (b) Stage 1 transfer learning using mammography data. Two fully connected layers (F4 and F5) are added to the ImageNet structure in (a). (c) Stage 2 transfer learning using DBT data. Note that (b) and (c) show three strategies of fine-tuning by freezing the CNN at different layers. The choice of fine-tuning layers is explained in sections II-C and II-D.
Fig. 2.
Fig. 2.
Four transfer learning and fine-tuning strategies using the mammography and the DBT data sets to be compared in this study. ‘A’ to ‘D’ denote the plots in the graphs from the Results section. ‘A’ and ‘D’ are referred to as single-stage transfer learning by mammograms and DBT, respectively. ‘B’ and ‘C’ are referred to as multi-stage transfer learning DBT. C1 indicates that the C1 layer of the pre-trained CNN was frozen during transfer learning. C1-F4 indicates that the C1 to F4 layers of the pre-trained CNN were frozen during transfer learning.
Fig. 3.
Fig. 3.
Box-and-whisker plots of inference results from stage 1 mammogram-trained CNN. The AUC values for classifying the mammography test ROIs (Table I) from the six transfer networks are shown for ten random batchings of the training samples. The training set and the test set consists of 12,360 and 7,272 ROIs, respectively. The 25th percentile, median, and 75th percentile are represented by the bottom, middle and top of the boxes, respectively. The interquartile range (IQR) is the difference between the 75th and 25th percentile. AUC values outside the 1.5*IQR above the 25th percentile and below the 75th percentile are outliers. The whiskers indicate the maximum and minimum AUC values excluding the outliers. The dotted line shows the mean AUC of the repeated experiments.
Fig. 4.
Fig. 4.
The ROI-based AUC performance for classifying the 9,120 DBT training ROIs (serve as a validation set at this stage) (Table I) for three transfer networks at stage 1. Each simulated training set size was repeated with ten random samplings from the entire training set and random batching of the training samples. (a) Dependence of mean and standard deviation of AUC on mammography training set size. (b) Box-and-whisker plots of inference results from the stage 1 mammogram-trained C1-frozen transfer learning CNN. The entire set of 19,632 mammography ROIs was used for randomly drawing the training subsets. Note that the plot in (b) uses categorical x-axis to show details of the low percentage region.
Fig. 5.
Fig. 5.
Box-and-whisker plots of ROI-based AUC performance on the DBT test set while varying the simulated mammography training sample size available for stage 1 C1-frozen transfer learning. (a) Stage 1 mammogram-trained C1-frozen CNN without stage 2 (scheme A in Fig. 2). (b) Stage 2 C1-frozen transfer learning at a fixed (100%) DBT training set size (scheme B). (c) Stage 2 C1-to-F4-frozen transfer learning at a fixed (100%) DBT training set size (scheme C). The dotted line in (a) to (c) plots the mean AUC at each simulated training set size. Note that the plots in (a) to (c) use categorical x-axis to show details of the low percentage region. (d) shows the mean and standard deviation of AUC in (a) to (c) together with the x-axis plotted in a linear scale.
Fig. 6.
Fig. 6.
Box-and-whisker plots of the ROI-based AUC performance on the DBT test set while varying the simulated DBT sample size available for training. (a) single-stage transfer learning by DBT trained C1-frozen CNN without pre-training with mammography data (scheme D), (b) Stage 2 C1-frozen transfer learning using DBT training set after Stage 1 transfer learning with a fixed mammography data set (100%) (scheme B), and (c) Stage 2 C1-to-F4-frozen transfer learning using DBT training set after Stage 1 transfer learning with a fixed mammography data set (100%) (scheme C). The dotted line in (a) and (b) plots the mean AUC at each simulated training set size. Note that the plots in (a) to (c) use categorical x-axis to show details of the low percentage region. (d) shows the mean and standard deviation of AUC in (a) and (b) together with the x-axis plotted in a linear scale.
Fig. 7.
Fig. 7.
Comparison of the ROI-based and view-based ROC curves for the DBT test set using the single-stage transfer network (D in Fig. 2) versus the multi-stage transfer network (B in Fig. 2). The entire mammography set and the entire DBT training set were used for training.
Fig. 8.
Fig. 8.
Dependence of the mean squared error on the number of epochs for four transfer networks in four schemes (A, B, C and D) from one of the random sampling experiments. Within each scheme the training and test curves are shown for 5%, 40% and 100% of the training sample sizes. For B and C, 100% mammography data were used in the stage 1 pre-training. The DBT test set was used for testing of all four schemes and conditions.
Fig. 9.
Fig. 9.
Box-and-whisker plots of inference results from stage 1 DBT trained CNN. The mean AUC values for classifying the DBT test ROIs (Table I) from the six transfer networks are shown for 20 random batchings of the training samples. The training set and the test set consists of 9,120 and 3,560 ROIs, respectively.

References

    1. Litjens G, Kooi T, Bejnordi BE, Setio AAA, Ciompi F,Ghafoorian M, van der Laak JA, van Ginneken B, and Snchez CI, “A survey on deep learning in medical image analysis,” Medical Image Analysis, vol. 42, pp. 60–88, 2017. - PubMed
    1. Yosinski J, Clune J, Bengio Y, and Lipson H, “How transferable are features in deep neural networks?” in Advances in neural information processing systems, 2014, pp. 3320–3328.
    1. Sahiner B, Chan H-P, Petrick N, Wagner RF, and Hadjiiski L, “Feature selection and classifier performance in computer-aided diagnosis: The effect of finite sample size,” Medical Physics, vol. 27, pp. 1509–1522, 2000. - PMC - PubMed
    1. National Center for Health Statistics, “Health, United States, 2015: With special feature on racial and ethnic health disparities.” Hyattsville, MD., Report no. 2016–1232, 2016. - PubMed
    1. US FOOD & DRUG ADMINISTRATION, “MQSA National Statistics,” accessed 03-August-2017 [Online]. Available: www.fda.gov/Radiation-EmittingProducts/MammographyQualityStandardsActand...

Publication types