. 2019 Dec 4;104(5):856-868.e5.
doi: 10.1016/j.neuron.2019.08.037. Epub 2019 Oct 14.

Patient-Tailored, Connectivity-Based Forecasts of Spreading Brain Atrophy

Affiliations

Patient-Tailored, Connectivity-Based Forecasts of Spreading Brain Atrophy

Jesse A Brown et al. Neuron. .

Abstract

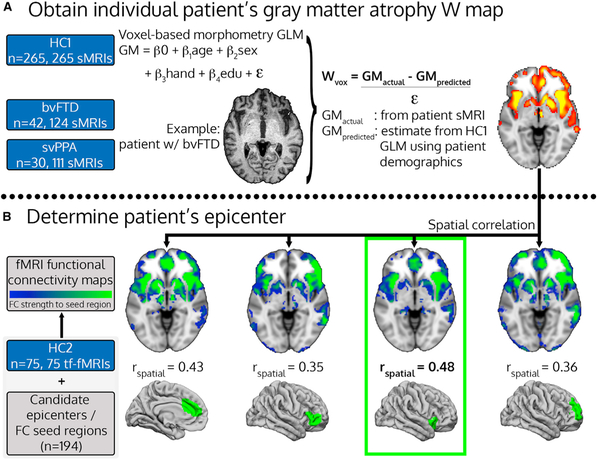
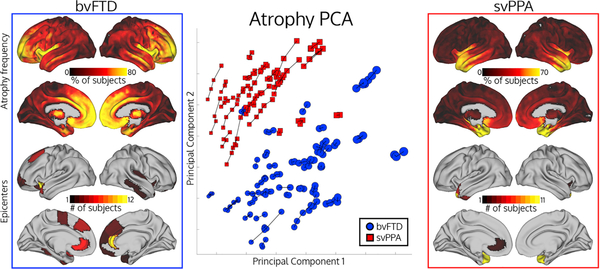
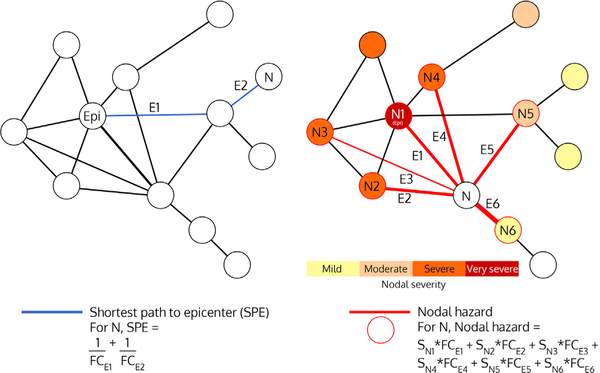
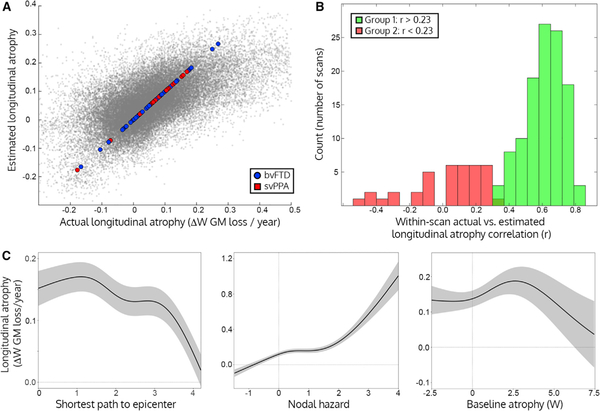
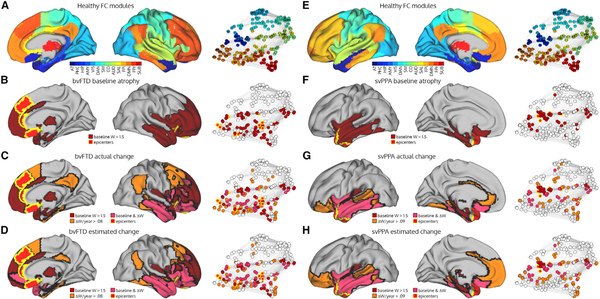
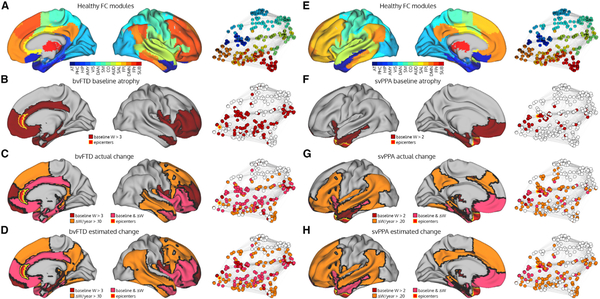
Neurodegenerative diseases appear to progress by spreading via brain connections. Here we evaluated this transneuronal degeneration hypothesis by attempting to predict future atrophy in a longitudinal cohort of patients with behavioral variant frontotemporal dementia (bvFTD) and semantic variant primary progressive aphasia (svPPA). We determined patient-specific "epicenters" at baseline, located each patient's epicenters in the healthy functional connectome, and derived two region-wise graph theoretical metrics to predict future atrophy: (1) shortest path length to the epicenter and (2) nodal hazard, the cumulative atrophy of a region's first-degree neighbors. Using these predictors and baseline atrophy, we could accurately predict longitudinal atrophy in most patients. The regions most vulnerable to subsequent atrophy were functionally connected to the epicenter and had intermediate levels of baseline atrophy. These findings provide novel, longitudinal evidence that neurodegeneration progresses along connectional pathways and, further developed, could lead to network-based clinical tools for prognostication and disease monitoring.

Keywords: brain networks; frontotemporal dementia; functional connectivity; graph theory; neurodegeneration; voxel-based morphometry.


Conflict of interest statement

DECLARATION OF INTERESTS

The authors declare no competing interests.

Figures

Figure 1.
Figure 1.. Patient-Tailored Epicenter Identification
(A and B) Workflow for determining individual patient gray matter atrophy W maps (A) and patient-tailored epicenters, based on the spatial correlation between patient atrophy maps and healthy intrinsic functional connectivity maps (B). The procedure is illustrated for a single time point from a single representative patient with bvFTD, a 63-year-old right-handed man with 22 years of education, whose epicenter was identified as the right frontoinsular cortex. HC: healthy controls; bvFTD: behavioral variant frontotemporal dementia; svPPA: semantic variant primary progressive aphasia; sMRI: structural MRI; tf-fMRI: task-free functional MRI; GLM: general linear model; GM: gray matter; FC: functional connectivity.
Figure 2.
Figure 2.. Patient Brain Atrophy, Epicenters, and Clustering
Top left/top right: atrophy frequency for patients with svPPA or bvFTD, showing the percentage of patients with voxel atrophy value W-score > 1.5. Bottom left and bottom right: number of patients with a given epicenter. Middle: principal component analysis showing the first two atrophy components for atrophy maps for all time points from all subjects. Longitudinal scans from the same subject are connected by lines. Dot radius represents scan mean atrophy W-score.
Figure 3.
Figure 3.. Schematic Depictions of Shortest Path to Epicenter (SPE) and Nodal Hazard (NH)
In SPE, E1 + E2 represents the path length between node N and node Epi. In nodal hazard, E1–E6 represent the functional connectivity strengths between node N and nodes N1–N6. Note that each node’s contribution to the nodal hazard weighted by its atrophy severity and adjusted for its Euclidean distance to the node of interest. Epi: epicenter; N: node; E: edge; FC: functional connectivity strength; S: severity.
Figure 4.
Figure 4.. Network Model for Predicting Longitudinal Atrophy
(A) Actual longitudinal atrophy for each node plotted against the estimated atrophy for that node from the full generalized additive model. Each subject’s mean longitudinal atrophy (as fit by the subject random intercept term) is shown as a larger dot with colors corresponding to their atrophy cluster membership (from Figure 2). (B) Longitudinal prediction correlation per scan, based on the mixed effects model. Histogram indicating the frequency of Pearson correlations between the measured and estimated longitudinal atrophy across the 242 regions is shown. The green and red portions represent two groups detected by a Gaussian mixture model, representing scans with accurate (Group 1/green) or inaccurate predictions (Group 2/red). (C) Effect plots for the three main predictors of interest, where shaded bands correspond to ± 2 × SE of the fit (95% confidence interval). Left: regions with a shorter path length to the patient’s epicenter had higher subsequent longitudinal atrophy, accounting for all other factors in the generalized additive model. Middle: regions with higher nodal hazard had higher subsequent longitudinal atrophy. Right: regions with intermediate levels of baseline atrophy had higher subsequent longitudinal atrophy than regions with low or high baseline atrophy.
Figure 5.
Figure 5.. Baseline, Longitudinal, and Predicted Longitudinal Atrophy Patterns in bvFTD and svPPA
(A and E) The modules in the healthy functional connectome and the corresponding network graph. (B and F) The bvFTD/svPPA group baseline atrophy map shown on the more severe hemisphere (right for bvFTD, left for svPPA), coloring nodes with a mean W-score > 1.5. Regions where > = 5 subjects had an epicenter are labeled as epicenters. Atrophied nodes and epicenters are also shown on the network graph. (C and G) The annualized mean actual longitudinal atrophy map, coloring nodes with a mean W-score > 0.08 in bvFTD or W-score > 0.09 in svPPA (equivalent to the top 25% of regions). (D and H) The annualized mean predicted longitudinal atrophy map, coloring nodes with a mean predicted W-score > 0.08 in bvFTD or predicted W-score > 0.09 in svPPA (equivalent to the top 25% of regions). AT: anterior temporal; PHC: parahippocampal; HIP: hippocampal; AMY: amygdala; VIS: visual; DAN: dorsal attention network; SM: sensory-motor; CO: cingulo-opercular; AUD: auditory; SAL: salience; FPl: left fronto-parietal; DMN: default mode network; FPr: right fronto-parietal; SUB: subcortical.
Figure 6.
Figure 6.. Regions with Greatest Baseline, Longitudinal, and Predicted Longitudinal Atrophy in bvFTD and svPPA Case Studies
(A and E) The modules in the healthy functional connectome, shown on the brain and on the network graph. (B and F) The patients’ baseline atrophy map shown on the more severe right hemisphere for bvFTD and the left hemisphere for svPPA. The epicenters are in the right pregenual anterior cingulate for the bvFTD patient and left ventral temporal pole for the svPPA are shown in yellow. Maps were thresholded at the 25th percentile of atrophy baseline/change W-scores at the group level, based on these patients’ respective demographic and clinical variables, and are not intended to represent statistical thresholds. (C and G) The patients’ actual annualized longitudinal atrophy map, coloring nodes with a mean W-score > 0.10 for the bvFTD patient or W-score > 0.2 for the svPPA patient (manually selected). (D and H) The patients’ predicted longitudinal atrophy map, coloring nodes with a predicted W-score > 0.10 for the bvFTD patient or predicted W-score > 0.2 for the svPPA patient.

References

    1. Ashburner J, and Friston KJ (2005). Unified segmentation. Neuroimage 26, 839–851. - PubMed
    1. Ashburner J, and Ridgway GR (2013). Symmetric diffeomorphic modeling of longitudinal structural MRI. Front. Neurosci 6, 197. - PMC - PubMed
    1. Barr DJ, Levy R, Scheepers C, and Tily HJ (2013). Random effects structure for confirmatory hypothesis testing: Keep it maximal. J. Mem. Lang 68, 255–278. - PMC - PubMed
    1. Bateman RJ, Xiong C, Benzinger TLS, Fagan AM, Goate A, Fox NC, Marcus DS, Cairns NJ, Xie X, Blazey TM, et al.; Dominantly Inherited Alzheimer Network (2012). Clinical and biomarker changes in dominantly inherited Alzheimer’s disease. N. Engl. J. Med 367, 795–804. - PMC - PubMed
    1. Beirowski B, Adalbert R, Wagner D, Grumme DS, Addicks K, Ribchester RR, and Coleman MP (2005). The progressive nature of Wallerian degeneration in wild-type and slow Wallerian degeneration (WldS) nerves. BMC Neurosci. 6, 6. - PMC - PubMed

Publication types