. 2019 Oct 17;10(1):4706.
doi: 10.1038/s41467-019-12464-3.

Single-cell transcriptomics of human T cells reveals tissue and activation signatures in health and disease

Affiliations

Single-cell transcriptomics of human T cells reveals tissue and activation signatures in health and disease

Peter A Szabo et al. Nat Commun. .

Abstract

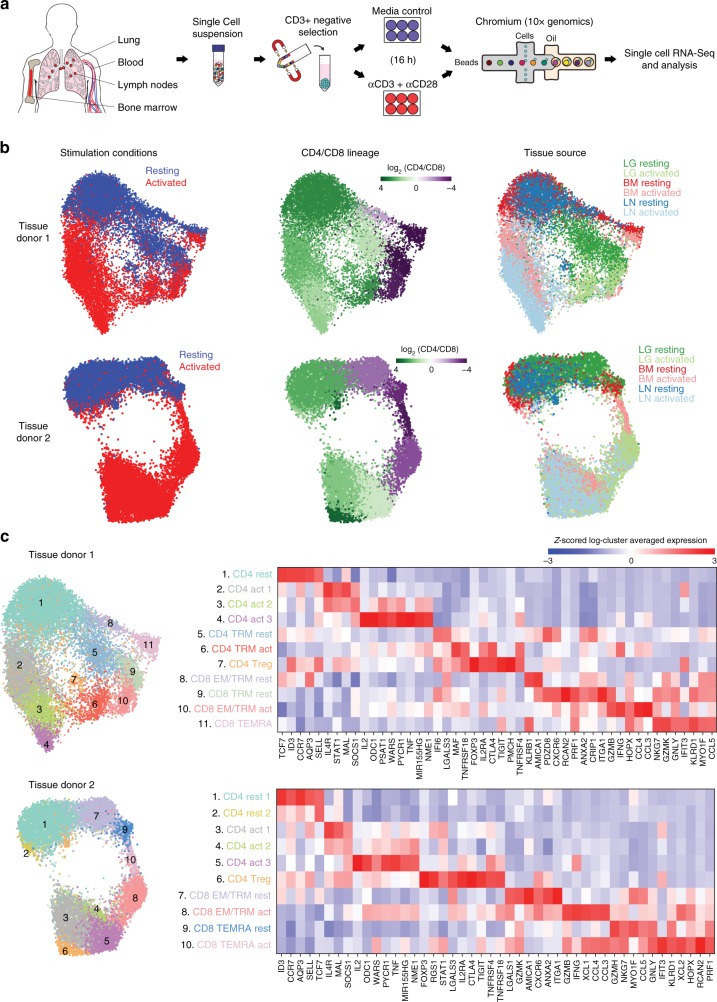
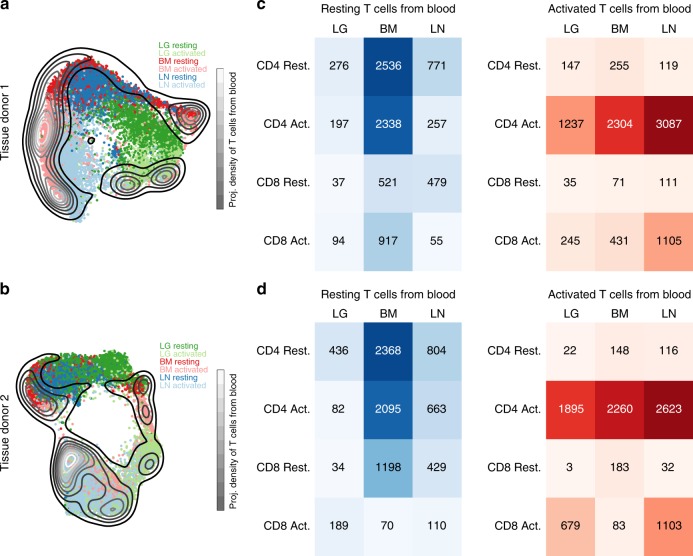
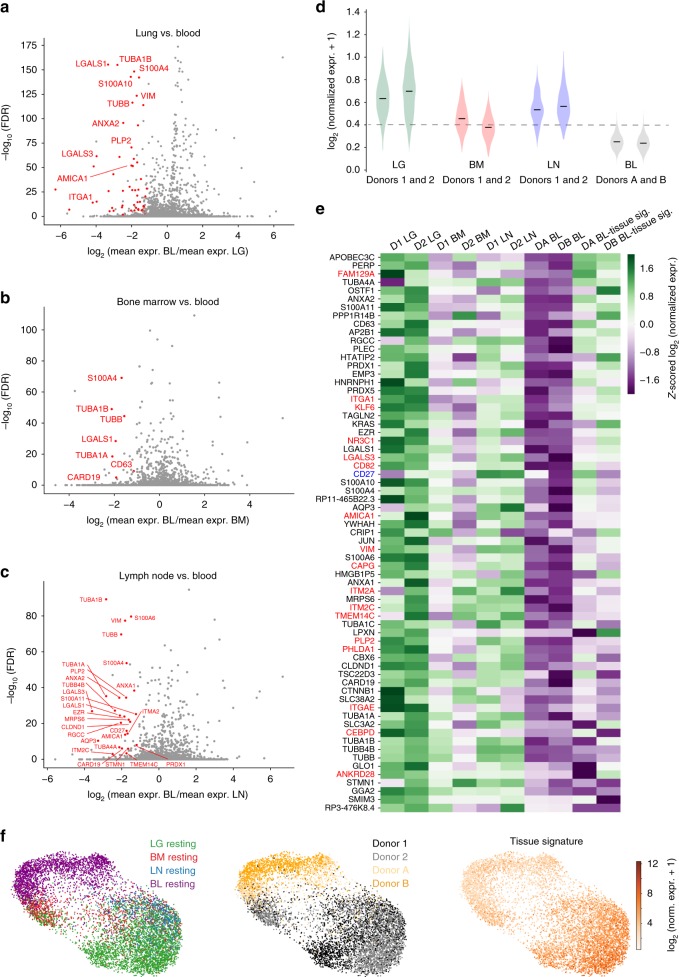
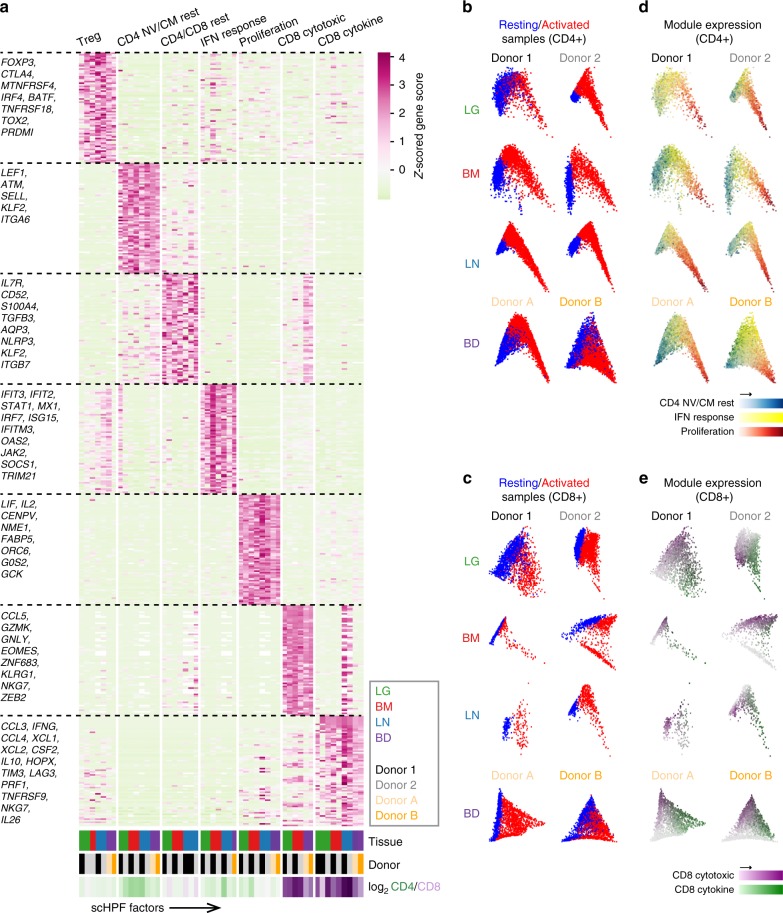
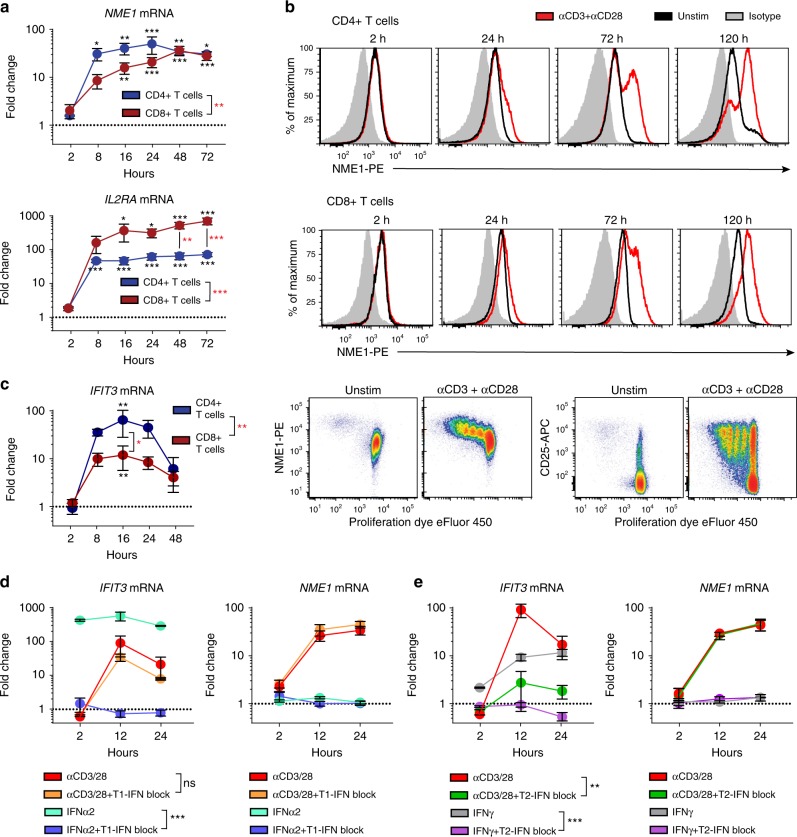
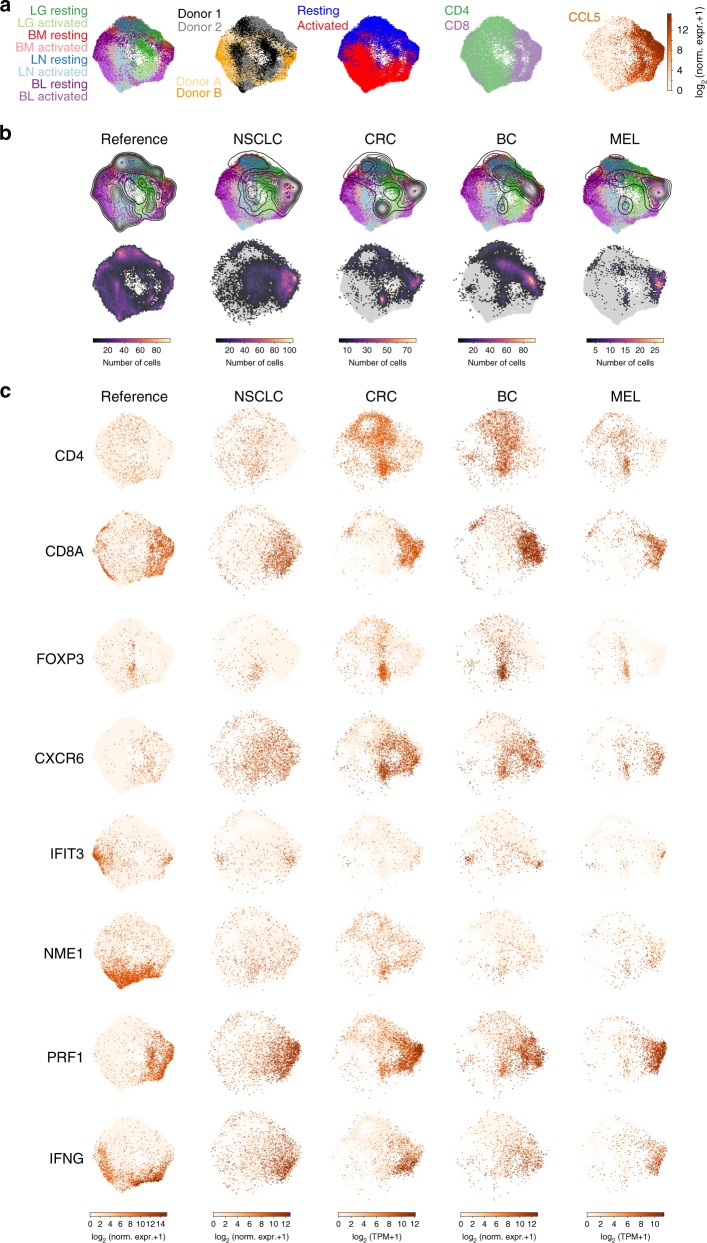
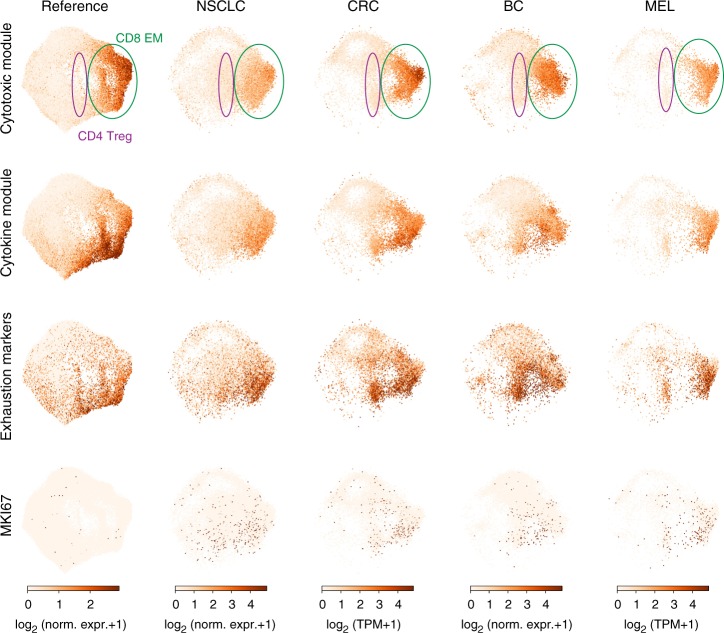
Human T cells coordinate adaptive immunity in diverse anatomic compartments through production of cytokines and effector molecules, but it is unclear how tissue site influences T cell persistence and function. Here, we use single cell RNA-sequencing (scRNA-seq) to define the heterogeneity of human T cells isolated from lungs, lymph nodes, bone marrow and blood, and their functional responses following stimulation. Through analysis of >50,000 resting and activated T cells, we reveal tissue T cell signatures in mucosal and lymphoid sites, and lineage-specific activation states across all sites including distinct effector states for CD8+ T cells and an interferon-response state for CD4+ T cells. Comparing scRNA-seq profiles of tumor-associated T cells to our dataset reveals predominant activated CD8+ compared to CD4+ T cell states within multiple tumor types. Our results therefore establish a high dimensional reference map of human T cell activation in health for analyzing T cells in disease.


Conflict of interest statement

The authors declare no competing interests.

Figures

Fig. 1
Fig. 1
Single-cell RNA-seq analysis of resting and activated T cells from multiple tissue sites. a Experimental workflow for single-cell analysis of T cells from human tissues and blood including magnetic negative selection of CD3+ cells, in vitro culture and activation, and Chromium 3′-scRNA-seq. b UMAP embeddings of merged scRNA-seq profiles from resting and activated T cells from lung (LG), bone marrow (BM), and lung-draining lymph node (LN) in each of two organ donors colored by resting/activated condition, CD4/CD8 expression ratio (all cells in a given cluster assigned the same average value), and tissue source. c Identification of T cell subpopulations. UMAP embeddings colored by expression cluster along with heatmaps showing z-scored average expression of curated T cell subset marker genes that had a fold change >2 and p < 0.05 by the binomial test for at least one cluster. Genes are ordered by the cluster in which they have the highest enrichment. Subsets designated based on resting (“rest”) or activated (“act”) condition and expression of known markers denoting effector memory (TEM), tissue resident memory (TRM), terminally differentiated effector cells (TEMRA), and regulatory T cells (Treg). Source data for c detailing averaged expression values for T cell subset marker genes are provided in the Source Data file
Fig. 2
Fig. 2
Comparison of blood and tissue T cells. a UMAP embedding of T cells from tissue donor 1 colored by tissue and overlaid with a contour plot corresponding to the UMAP projection of the combined resting and activated T cells from two blood donors onto the tissue embedding. b Same as (a) for organ donor 2. c Heatmaps showing the number of blood T cells that project most closely to each tissue/stimulation status combination in the tissue donor 1 UMAP embedding. d Same as (c) for tissue donor 2
Fig. 3
Fig. 3
Identification of a tissue gene signature for resting memory T cells. a Volcano plot showing the average log-fold-change and average Benjamini-Hochberg-corrected p-values (FDR) for pairwise differential expression between CCL5+ T cells from each resting LG sample and each resting blood sample. Genes with negative log-fold-change are more highly expressed among CCL5+ cells in LG, with several differentially expressed genes (multiple test-corrected Wilcoxon p< 0.05, fold change >2) highlighted in red. b Same as (a) for comparison of resting CCL5+ T cells in BM and blood. c Same as (a) for comparison of resting CCL5+ T cells in LN in blood. d Violin plot showing the distributions of the average expression of all genes with two-fold higher expression (on average) in any tissue compared to blood and average FDR < 0.05 (described above) in any tissue for the resting CCL5+ T cells in each tissue and blood sample. The dashed line marks one standard deviation below the mean for average expression of this signature for all tissues (note a small number of blood cells fall above this line). e Heatmap shows z-scored average expression for all genes in the tissue signature from (d) among the resting CCL5+ T cells from each tissue and blood sample plus that of the rare blood subpopulation from (d), which expresses high levels of a subset of tissue signature genes. Previously identified TRM-associated genes from bulk RNA-seq studies are highlighted in red (enriched in CD69+ vs. CD69 tissue memory T cells), and CD27 highlighted in blue was previously found to be upregulated on human TRM compared to TEM cells. f UMAP embedding of resting CCL5+ T cells (TEM cells) from all four donors generated using the tissue-associated T cell signature colored by tissue site (left), donor (center), and average expression of the signature (right). Source data listing genes and expression values for (ae) are provided in the Source Data file
Fig. 4
Fig. 4
Defining conserved transcriptional states in resting and activated T cells by single-cell Hierarchical Poisson Factorization (scHPF). a Heatmap shows gene scores for the top genes (rows) in each expression module identified by clustering scHPF factors (columns) that were computed in separate analyses of cells from each tissue and donor (Supplementary Fig. 8a). Selected genes are indicated to the left, and complete lists of top genes are available in Supplementary Data 5. Color bars at the bottom of the heatmap indicate each factors’ tissue of origin, donor of origin, and CD4/CD8 bias. (NV/CM = naive or TCM). b Diffusion maps of CD4+ T cells in each tissue and donor, with cells colored by sample origin as resting (blue) or activated (red). c Same as (b) but for CD8+ T cells. d Diffusion maps of CD4+ T cells from (b), with cells colored by their average expression of the top genes from scHPF expression modules. Colors for different modules (CD4 NV/CM Resting, IFN Response, Proliferation) were blended using the RGB color model. e Diffusion maps of CD8+ T cells from (c), with cells colored by their average expression of the top genes from scHPF expression modules (CD8 Cytotoxic and CD8 Cytokine). Source data listing gene scores in (a) are provided in the Source Data file
Fig. 5
Fig. 5
Induction of NME1 and IFIT3 expression during T cell activation. a Expression of NME1 and IL2RA mRNA by blood CD4+ or CD8+ T cells after stimulation with anti-CD3/anti-CD28 antibodies by qPCR. Data shown as mean fold-change (±SEM) relative to unstimulated CD4+ or CD8+ T cell controls (dotted line) from 4 individuals (independent experiments). Statistical analysis between stimulated and unstimulated cells (black asterisk) or CD4+ and CD8+ T cells (red asterisk) made by two-way ANOVA with Sidak test for multiple comparisons. b Intracellular NME1 protein expression by blood T cells after stimulation for indicated timepoints (red) compared to unstimulated (black) and isotype control (gray). Bottom row: CD25 and NME1 expression by proliferating CD3+ T cells after 5 days of stimulation. Data are representative of 4 individuals. c Expression of IFIT3 mRNA in blood T cells by qPCR after TCR-stimulation, shown as mean fold-change (±SEM) relative to unstimulated controls (dotted line) for four individuals. Two-way ANOVA with Sidak test for multiple comparisons was used for statistical comparisons (black asterisk, stimulated versus unstimulated) or (red asterisk, CD4+ versus CD8+ T cells). d IFIT3 or NME1 mRNA expression in CD4+ T cells after culture with anti-CD3/anti-CD28 or IFNα2 (1000 units/mL) ± type I IFN neutralizing antibody cocktail or e IFNγ (10 ng/mL) ± anti-IFNγ/anti-IFNγR1 antibodies (1 µg/mL each), shown as mean fold-change (±SEM) relative to unstimulated controls (dotted line) for three individuals. Statistical comparisons made by two-way ANOVA. For all panels: “ns” denotes not significant; *p ≤ 0.05; **p ≤ 0.01; ***p ≤ 0.001. Source data for gene expression values are provided in the Source Data file
Fig. 6
Fig. 6
Comparison of tumor-associated T cells to the reference map of healthy human T cell activation. a Merged UMAP embedding for the entire healthy T cell scRNAseq dataset in this study including resting and activated tissue T cells (two donors) and blood T cells (two individuals) colored by sample source, donor, resting/activated condition, CD4/CD8 status (CD4-enriched, green; CD8-enriched, purple), and CCL5 expression indicating TEM cells. b First row: merged UMAP embedding for the entire dataset overlaid with contour plots indicating kernel density estimates for the projection of T cells derived from organ/blood donors (column 1), non-small cell lung cancer (NSCLC) tissue (column 2), colorectal cancer (CRC) tissue (column 3), breast cancer (BC) tissue (column 4), and melanoma (MEL) tissue (column 5). Note that these probability densities can be compared within each projection, but cannot be quantitatively compared across projections. Second row: same as first row but overlaid with a two-dimensional hexbin histogram for each projection. Histograms have been normalized to account for differences in cell numbers across datasets and therefore can be compared quantitatively across projections. c Individual cells in the UMAP embedding (column 1) for the entire healthy T cell dataset and UMAP projections (columns 2–5) for NSCLC, CRC, BC, and MEL tissue T cells colored by expression of CD4, CD8A, FOXP3 (Treg marker), CXCR6 (TRM marker), IFIT3 (IFN response marker), NME1 (activation marker), PRF1 (cytotoxic marker), and IFNG. Expression values are normalized for quantitative comparison within each dataset (i.e., column), but not across datasets
Fig. 7
Fig. 7
Expression of functional modules and exhaustion markers on control and tumor associated-T cells. Individual cells in the UMAP embedding (far left column) shown for the entire healthy T cell reference dataset and UMAP projections (remaining four columns) for NSCLC, CRC, BC, and MEL tissue T cells. UMAP projections are colored by the average expression of the top 70 genes in the Cytotoxic module, the top 70 genes in the Cytokine module, the average expression of a set of exhaustion markers (PDCD1, CTLA4, LAYN, LAG3, TIM-3, CD244, and CD160), and expression of the proliferation marker MKI67. Note that these expression values are normalized so that they can be quantitatively compared within each dataset (within each column), but not across datasets

References

    1. Sallusto F, Lenig D, Forster R, Lipp M, Lanzavecchia A. Two subsets of memory T lymphocytes with distinct homing potentials and effector functions. Nature. 1999;401:708–712. doi: 10.1038/44385. - DOI - PubMed
    1. Teijaro JR, et al. Cutting edge: tissue-retentive lung memory CD4 T cells mediate optimal protection to respiratory virus infection. J. Immunol. 2011;187:5510–5514. doi: 10.4049/jimmunol.1102243. - DOI - PMC - PubMed
    1. Mackay LK, et al. The developmental pathway for CD103(+)CD8+ tissue-resident memory T cells of skin. Nat. Immunol. 2013;14:1294–1301. doi: 10.1038/ni.2744. - DOI - PubMed
    1. Schenkel JM, Masopust D. Tissue-resident memory T cells. Immunity. 2014;41:886–897. doi: 10.1016/j.immuni.2014.12.007. - DOI - PMC - PubMed
    1. Schenkel JM, et al. T cell memory. Resident memory CD8 T cells trigger protective innate and adaptive immune responses. Science. 2014;346:98–101. doi: 10.1126/science.1254536. - DOI - PMC - PubMed

Publication types

MeSH terms

LinkOut - more resources