. 2019 Oct 17;10(1):4710.
doi: 10.1038/s41467-019-12609-4.

Cell competition corrects noisy Wnt morphogen gradients to achieve robust patterning in the zebrafish embryo

Affiliations

Cell competition corrects noisy Wnt morphogen gradients to achieve robust patterning in the zebrafish embryo

Yuki Akieda et al. Nat Commun. .

Abstract

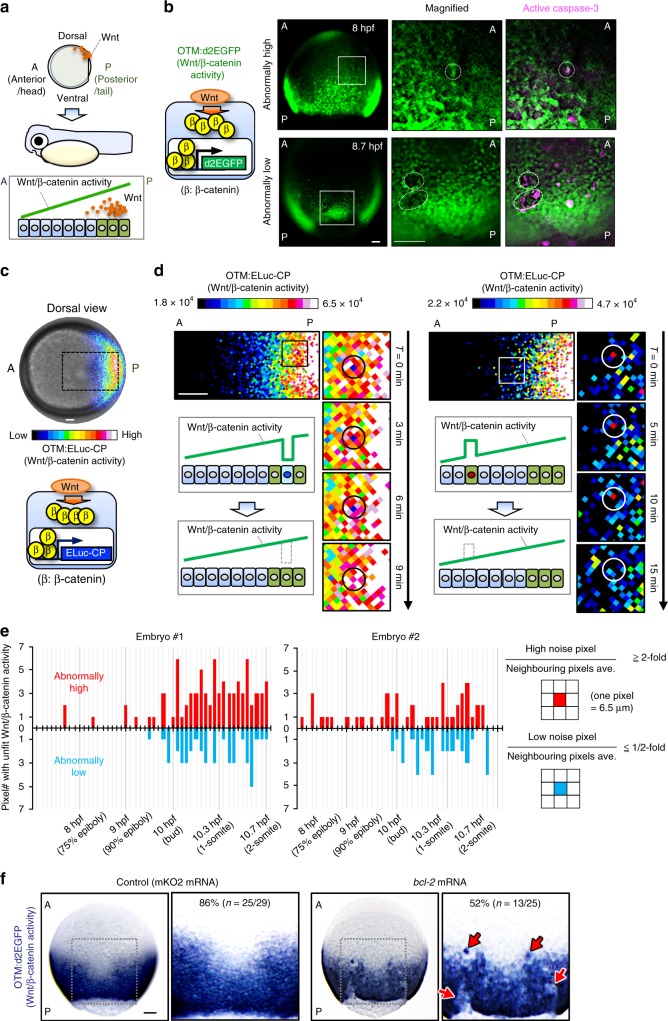
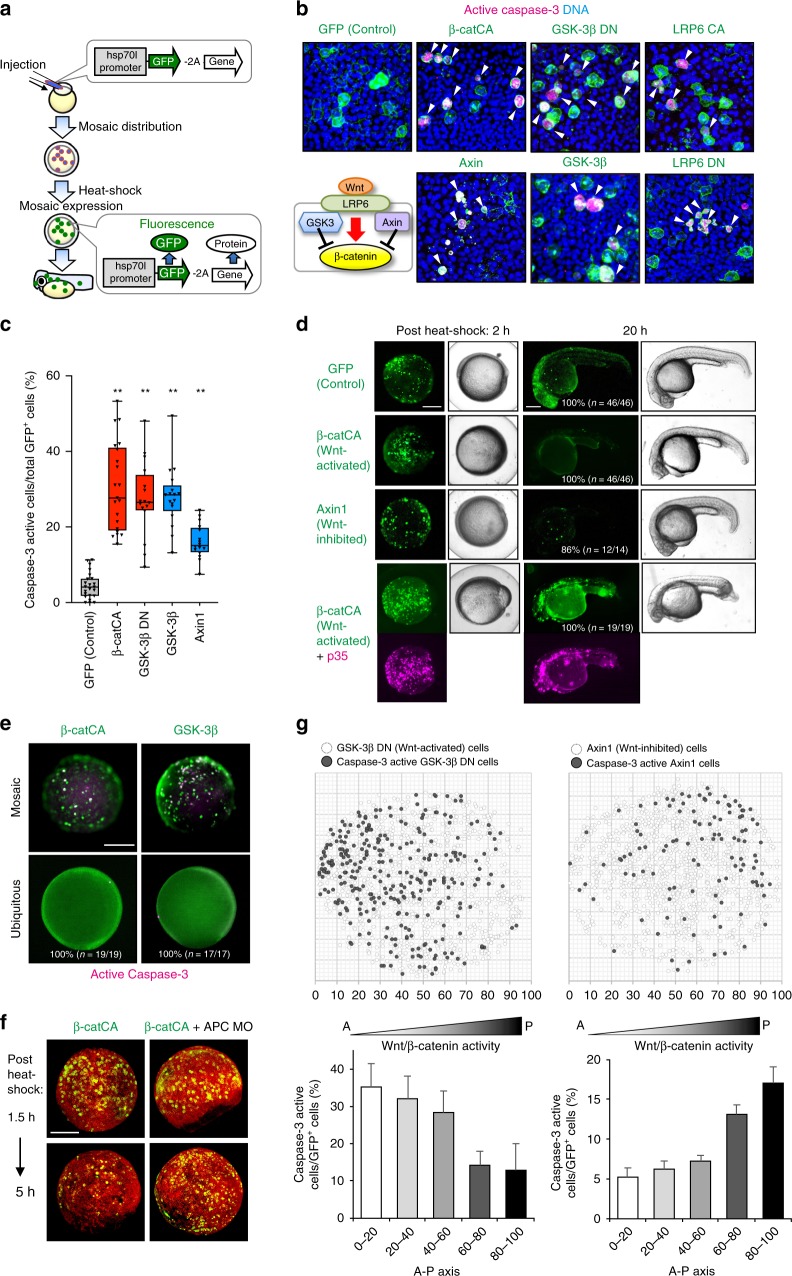
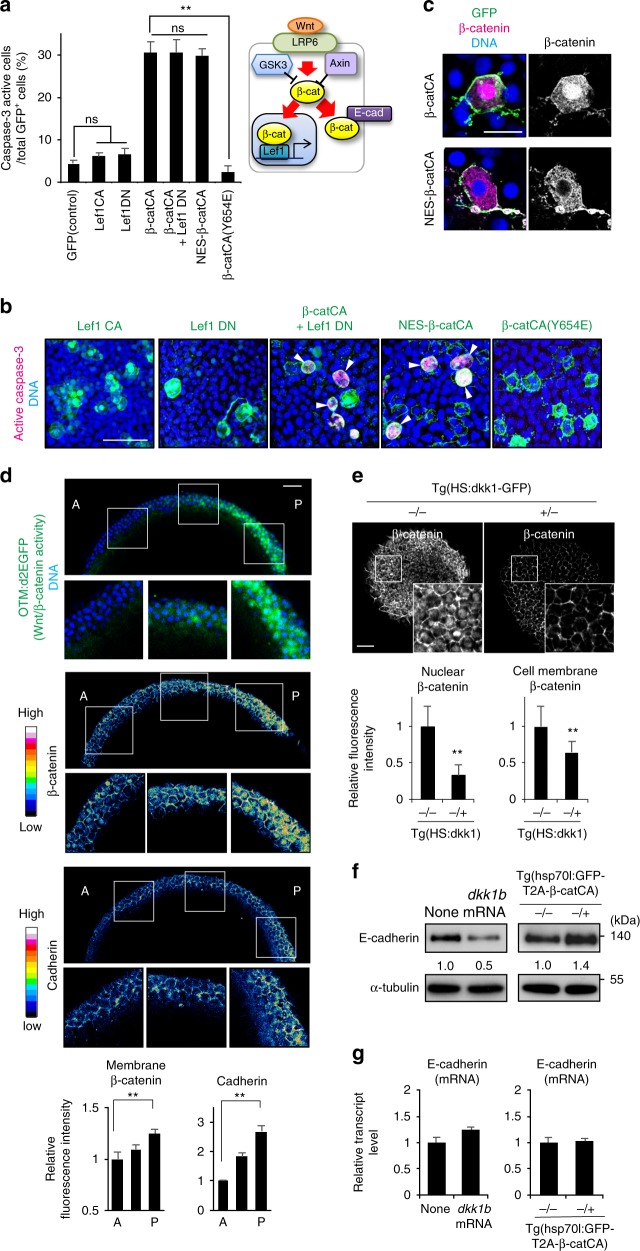
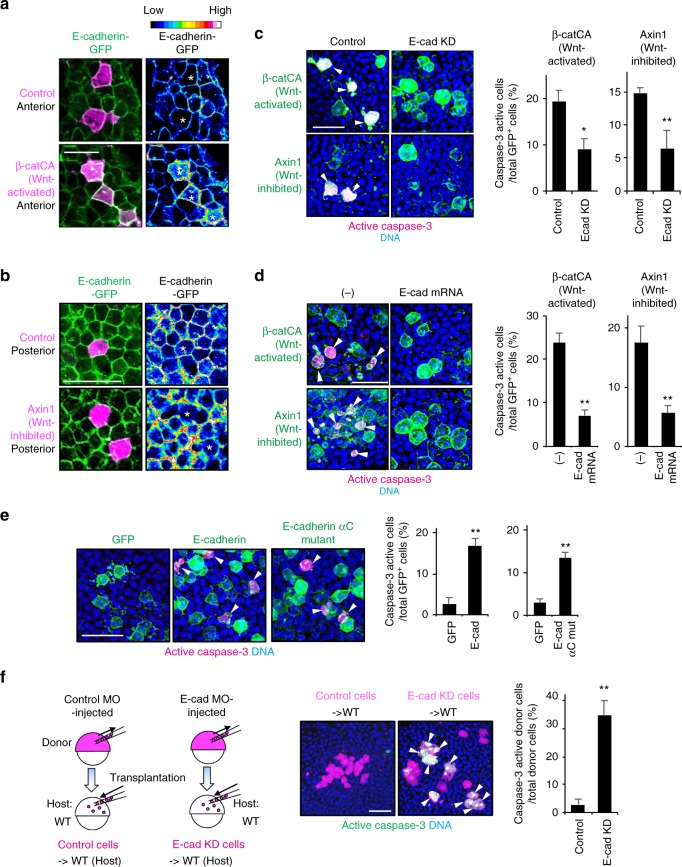
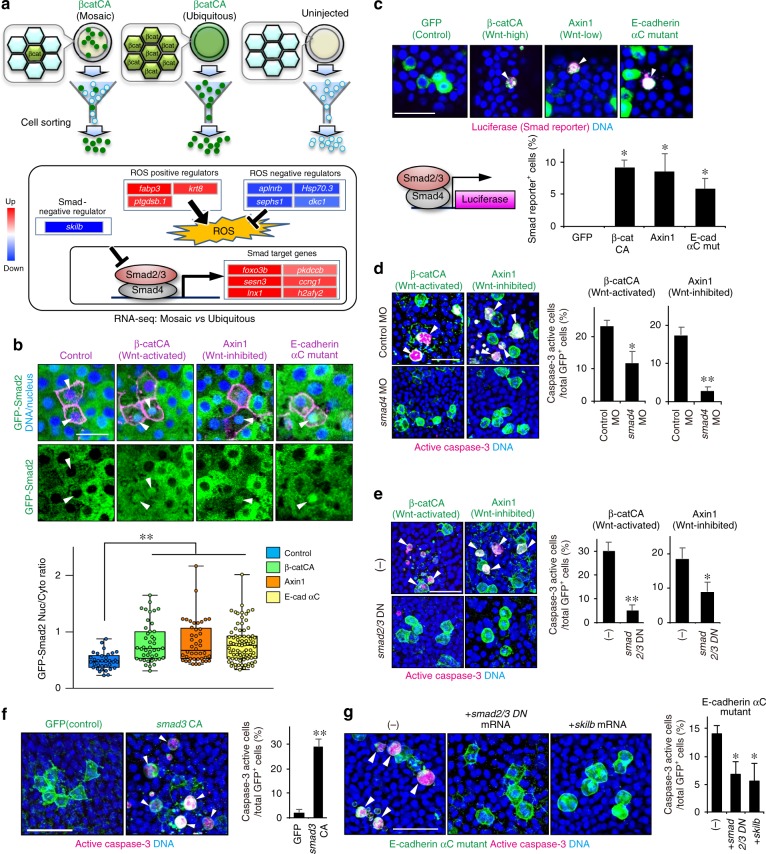
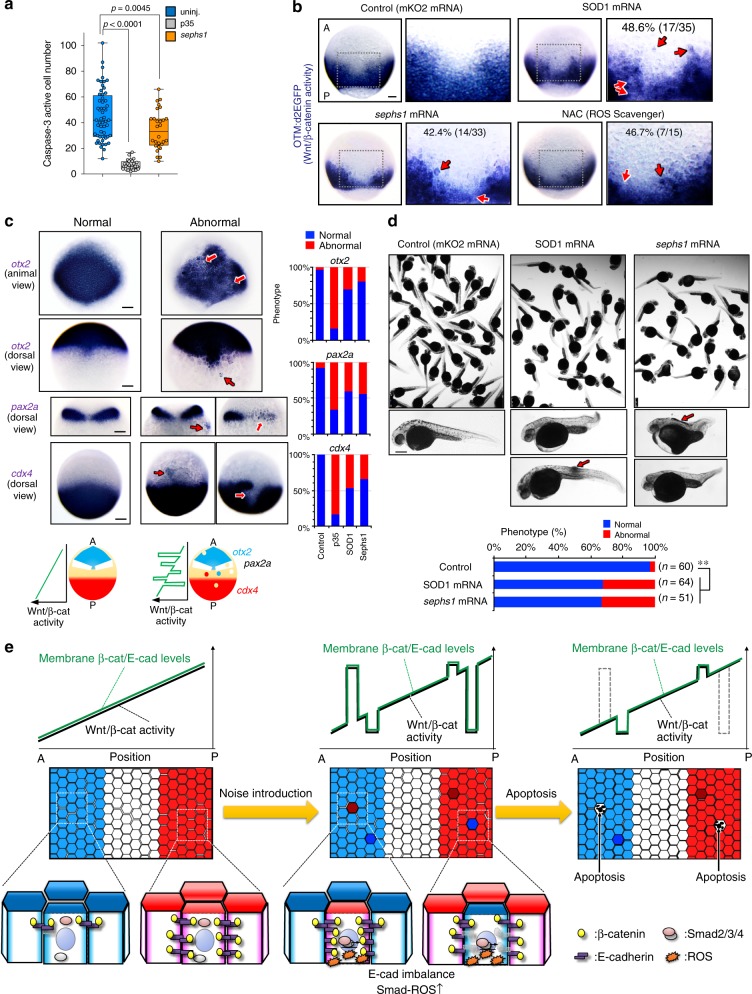
Morphogen signalling forms an activity gradient and instructs cell identities in a signalling strength-dependent manner to pattern developing tissues. However, developing tissues also undergo dynamic morphogenesis, which may produce cells with unfit morphogen signalling and consequent noisy morphogen gradients. Here we show that a cell competition-related system corrects such noisy morphogen gradients. Zebrafish imaging analyses of the Wnt/β-catenin signalling gradient, which acts as a morphogen to establish embryonic anterior-posterior patterning, identify that unfit cells with abnormal Wnt/β-catenin activity spontaneously appear and produce noise in the gradient. Communication between unfit and neighbouring fit cells via cadherin proteins stimulates apoptosis of the unfit cells by activating Smad signalling and reactive oxygen species production. This unfit cell elimination is required for proper Wnt/β-catenin gradient formation and consequent anterior-posterior patterning. Because this gradient controls patterning not only in the embryo but also in adult tissues, this system may support tissue robustness and disease prevention.


Conflict of interest statement

The authors declare no competing interests.

Figures

Fig. 1
Fig. 1
Apoptotic elimination of unfit cells smoothens the Wnt/β-catenin gradient. a Schematic illustration of Wnt/β-catenin activity gradient formation. A: anterior, P: posterior. b Caspase-3 activation in unfit cells with abnormal Wnt/β-catenin activity. Whole-mount immunostaining of d2EGFP (green) and active caspase-3 (magenta) in Tg(OTM:d2EGFP) zebrafish embryos (Dorsal view). Dotted line indicates abnormal Wnt/β-catenin-reporter activity. Scale bars, 200 μm. c OTM:ELuc-CP drives destabilized ELuc-CP expression in response to Wnt/β-catenin signalling activation in reporter embryo (dorsal view). Scale bar, 200 μm. (See also Supplementary Movie 1). d Time lapse images showing unfit cells with abnormal Wnt/β-catenin activity appear then disappear in OTM:ELuc-CP embryos. Scale bars, 100 μm. Pixel area length is 6.5 μm, ≤ zebrafish deep cell diameter (~10 μm). e Physiological Wnt/β-catenin-noise during zebrafish AP axis formation. Graphs show the number of pixels with unfit Wnt/β-catenin activity in the luminescence images of living OTM:ELuc-CP transgenic zebrafish embryos during AP axis formation. Schematic illustrations: pixel retaining >two-fold or <two-fold intensity compared to neighbouring pixels for ≥frames (>6 min) was defined as High or Low noise, respectively. Pixels retained for ≥two frames were counted as the physiological Wnt/β-catenin noise. Pixels spontaneously showing abnormally high or low activity within one frame were regarded as other noise (e.g., cosmic rays and detector noises) and excluded. f Apoptosis inhibition enhances unfit abnormally high or low Wnt/β-catenin activity cell appearance. Whole-mount in situ hybridization of d2EGFP in Tg(OTM:d2EGFP) embryos (dorsal view). p< 0.01 (Fisher’s exact test). Scale bar, 200 μm. See also Supplementary Figs. 1 and 2
Fig. 2
Fig. 2
Substantial difference in Wnt/β-catenin activity between unfit and neighbouring cells triggers unfit cell apoptosis. a Schematic illustration of experimental introduction of fluorescent Wnt/β-catenin-abnormal cells in zebrafish early embryo through heat shock induction. b, c Artificially introduced Wnt/β-catenin-abnormal cells undergo apoptosis. Confocal microscopy images showing whole-mount immunostaining of active caspase-3 (magenta) in mosaic embryos expressing membrane GFP ± Wnt activators or inhibitors. Scale bar, 50 μm. Arrowheads indicate caspase-3-active cells. c Box plots of GFP+ caspase-3-active cell frequencies show 75th, 50th (median), and 25th percentiles (right). Whiskers indicate minimum and maximum. Each dot represents one embryo (n = 23, 21, 16, 17 and 16 embryos, two or more independent experiments). **p< 0.01 (one-way ANOVA). d Embryos artificially introduced with cells expressing membrane GFP alone (GFP) or with β-catCA or Axin1 with or without caspase inhibitor p35. Fluorescence and bright-field images after heat-shock. p35 expression (magenta). Scale bar, 200 μm. (See also Supplementary Movies 3 and 4). e Surrounding normal cells are required for apoptosis induction of β-catCA- or GSK-3β-overexpressing cells. [Tg(hsp70l:GFP-T2A-β-catCA)] or [Tg(hsp70l:GFP-T2A-GSK-3β)] transgenic lines were exposed to heat shock. Percentages of embryos showing similar phenotype and number of embryos are shown. Scale bar, 200 μm. f Alleviation of Wnt/β-catenin activity difference between β-catCA-overexpressing cells and surrounding normal cells by injecting APC MO blocks β-catCA-overexpressing cell elimination. Cell membrane was visualized by injecting membrane-tagged mKO2 mRNA (red). Scale bar, 200 μm. g Cells causing excess noise in Wnt/β-catenin-gradients efficiently undergo apoptosis. Top panels show the maps of artificially introduced cells in zebrafish embryos. Bottom graphs show the means ± SEM of caspase-3-active cell frequencies within the divided range along the AP axis (GSK-3βDN, n = 8 embryos, 1131 cells; Axin1, n = 14 embryos, 1308 cells). See also Supplementary Fig. 3
Fig. 3
Fig. 3
Membrane β-catenin and cadherin proteins form their concentration gradient along the AP-axis in a Wnt/β-catenin gradient-dependent manner. a Direct β-catenin-E-cadherin binding is required for unfit cell apoptosis induction. Schematic illustration of nuclear and membrane β-catenin functions (right). Graph show means ± SEM of GFP+ caspase-3-active cell frequencies in Lef1 or β-catCA mutant mosaic embryos (left) (n = 9, 11, 13, 13, 31, 14 and 6 embryos, two or more independent experiments). **p< 0.01 (one-way ANOVA). b Representative confocal fluorescence images show GFP (green), active caspase-3 (magenta), and DNA (blue) in embryos introduced with cells expressing Lef1 mutants or β-catCA mutants. Scale bar, 50 μm. c Both β-catCA and NES-β-catCA localize to the plasma membrane in zebrafish embryos. Scale bar, 20 μm. d Membrane β-catenin and E-cadherin protein levels correlate with Wnt/β-catenin signalling activity. Optical sagittal cross-section (dorsal side) in 8.3 hpf embryos. Panels show fluorescence of OTM:d2EGFP (green) and DNA (blue), fluorescence intensity of β-catenin and E-cadherin staining, and their magnified views. Scale bar, 50 μm. Bottom graph shows fluorescence intensity (means ± SEM, n = 12 cells per region) of β-catenin and E-cadherin staining at intercellular boundaries within three evenly divided regions across the AP axis. (Also see Methods). **p< 0.01 (t test). e Inhibition of Wnt signalling (Dkk1 overexpression) reduces nuclear as well as membrane β-catenin. Dorsal side of whole-mount β-catenin immunostaining of Tg(HS:dkk1b-GFP) zebrafish embryos and sibling embryos at 9 hpf exposed to heat shock at 37 °C from 4.3 to 5.3 hpf. +/− and −/− indicate the heterozygous transgenic sibling and non-transgenic wild-type sibling, respectively. Scale bar, 50 μm. Bottom graph shows fluorescent intensity (means ± SEM, n = 10 cells). **p< 0.01 (t test). f, g E-cadherin protein level correlates with Wnt/β-catenin signalling activity. 9 hpf embryos injected with dkk1b mRNA or Tg(HS:hsp70l:GFP-T2A-β-catCA) embryos exposed heat shock at 37 °C from 4.3 to 5.3 hpf were extracted and then subjected into immunoblotting with anti-E-cadherin and anti-α-tubulin antibodies (f) or qPCR (g)
Fig. 4
Fig. 4
Cadherin is involved in unfit cell sensing. a, b Mosaic unfit abnormal Wnt/β-catenin-activity cell introduction changes exogenous E-cadherin levels in zebrafish embryos. Confocal images showing embryos injected with E-cadherin-GFP mRNA (green) and mosaically introduced with mKO2 alone-expressing control cells or mKO2 and β-catCA- or Axin1-overexpressing cells (magenta). Right panels show fluorescence intensity of E-cadherin-GFP. Scale bar, 50 μm. c, d Partial E-cadherin knockdown (c) or E-cadherin overexpression (d) blocks β-catCA- or Axin1-overexpressing cell apoptosis. Confocal images showing whole-mount immunostaining of active caspase-3 (magenta) in mosaic embryos expressing membrane GFP ± β-catCA or Axin1 (green) and injected with low dose E-cadherin MO (E-cad KD) or E-cadherin mRNA. Arrowheads indicate caspase-3-active cells. Scale bar, 50 μm. Graphs show the means ± SEM (n = 8 or more embryos, two independent experiments) of GFP+ (β-catCA, Axin1) caspase-3 active cell frequencies (right). **p< 0.01, *p< 0.05 (t test). e Cells with unfit high E-cadherin levels undergo apoptosis in mosaic embryos. Confocal images showing whole-mount immunostaining of active caspase-3 (magenta) in mosaic embryos expressing membrane GFP ± E-cadherin or its mutant (green). Arrowheads indicate caspase-3-active cells. Scale bar, 50 μm. Graphs show the means ± SEM (n = 5 or more embryos, two independent experiments) of GFP+ caspase-3-active cell frequencies (right). **p< 0.01 (t test). f Cells with unfit low E-cadherin levels undergo apoptosis in mosaic embryos. E-cadherin partial knockdown (E-cad KD) cells or control cells (magenta) were transplanted into wild-type embryos. Confocal images showing whole-mount immunostaining of active caspase-3 (green) in mosaic embryos. Arrowheads indicate caspase-3-active cells. Scale bar, 50 μm. Graph shows the means ± SEM (n = 7 or more embryos, two independent experiments) of GFP+ caspase-3-active cell frequencies (right). **p< 0.01 (t test). See also Supplementary Fig. 4
Fig. 5
Fig. 5
TGF-β-Smad signalling mediates unfit cell killing. a Schematic representation of FACS (top) and mRNA expression changes by RNA-Seq between β-catCA-mosaically introduced (Mosaic), ubiquitously β-catCA-expressing (Ubiquitous), or uninjected embryos (bottom). (See also Supplementary Fig. 6e). b GFP-Smad2 translocates into unfit Wnt/β-catenin-activity cell nuclei. Confocal fluorescence images of cells overexpressing indicated genes in GFP-Smad2 mRNA (200 pg)-injected embryos. Scale bar, 50 μm. Box plots of nuclear/cytoplasmic GFP-Smad2 ratio show 75th, 50th (median) and 25th percentiles (right). Whiskers indicate minimum and maximum. Each dot represents one embryo. (n = 34, 43, 44 and 80 cells, two independent experiments) **p< 0.01 (one-way ANOVA). c Wnt/β-catenin-abnormal cells activate a Smad2/3/4-dependent reporter gene (SBE-luc). Confocal images showing whole-mount fluorescent in situ hybridization of luciferase mRNA in mosaic embryos expressing membrane GFP ± β-catCA or Axin1 (green) and injected with SBE-luc. Arrowheads indicate SBE-luc-active cells. Scale bar, 50 μm. SBE-luc active cell frequencies are graphed. (n = 5 or more embryos, two independent experiments) *p< 0.05 (one-way ANOVA). d, e Smad4 knockdown (d) or forced expression of smad2/3 dominant negative mutants (smad2/3DN) (e) blocks apoptosis of βcatCA- or Axin1-expressing cells. Confocal images showing whole-mount immunostaining of active caspase-3 (magenta) in mosaic embryos expressing membrane GFP ± β-catCA or Axin1 (green) and injected with control MO, smad4 MO, or smad2/3DN mRNA. Arrowheads indicate caspase-3-active cells. Scale bar, 50 μm. Graphs show the means ± SEM (n = 6 or more embryos, two independent experiments) of GFP+ (β-catCA- or Axin1-expressing) caspase-3-active cell frequencies (right). **p< 0.01, *p< 0.05 (t test). f Mosaic Smad3 activation is sufficient to induce apoptosis. Confocal images showing whole-mount immunostaining of active caspase-3 (magenta) in mosaic embryos expressing membrane GFP ± smad3CA. Arrowheads indicate caspase-3-active cells. Scale bar, 50 μm. Graph shows the means ± SEM (n = 4 or more embryos, two independent experiments) of GFP+ caspase-3-active cell frequencies (right). **p< 0.01 (t test). g E-cadherin αC mutant-expressing cell apoptosis is inhibited in smad2/3DN- or skilb-overexpressing embryos. Confocal images showing whole-mount immunostaining of active caspase-3 (magenta) in mosaic embryos expressing membrane GFP and E-cadherin mutant and injected without (−) or with smad2/3DN or skilb mRNA. Arrowheads indicate caspase-3-active cells. Scale bar, 50 μm. Graph shows the means ± SEM (n = 5 or more embryos, two independent experiments) of GFP+ caspase-3-active cell frequencies (right). *p< 0.05 (one-way ANOVA). See also Supplementary Fig. 5
Fig. 6
Fig. 6
ROS kills unfit cells downstream of cadherin and Smad signalling. a Representative confocal images showing whole-mount immunostaining of Sephs1 (magenta) in mosaic embryos expressing membrane GFP ± β-catCA or GSK3β (green). Scale bar, 50 μm. b, c Cells with unfit Wnt/β-catenin activity activate ROS production through E-cadherin and Smad signaling. b Fluorescence images showing ROS probe (CellRox Green)-stained mosaic embryos expressing membrane mKO2 ± indicated genes. Scale bars, 200 μm. c Confocal images showing whole-mount immunostaining of 8-OHdG (magenta) in mosaic embryos expressing membrane GFP ± indicated genes (green). Arrowheads indicate 8-OHdG-positive oxidized nuclei. Scale bar, 50 μm. Box plots of fluorescence intensity of 8-OHdG staining show 75th, 50th (median) and 25th percentiles (right). Whiskers indicate minimum and maximum. Each dot represents one embryo. (n = 40 or more cells, two independent experiments) **p< 0.01, *p< 0.05 (one-way ANOVA). d ROS downregulation blocks Wnt-activated or -inhibited cell apoptosis. Confocal images showing whole-mount immunostaining of active caspase-3 (magenta) in mosaic embryos expressing membrane GFP ± β-catCA- or Axin1 (green) and injected with SOD1 or sephs1 mRNA. Arrowheads indicate caspase-3-active cells. Scale bar, 50 μm (left). Graphs show the means ± SEM (n = 5 or 6 embryos, two independent experiments) of GFP+ caspase-3-active cell frequencies (right). **p< 0.01, *p< 0.05 (one-way ANOVA). e Cells with unfit Wnt/β-catenin activity reduce Bcl-2 protein levels. Confocal images of mosaic embryos expressing membrane mKO2 ± β-catCA- or Axin1 (magenta) and injected with GFP-Bcl2 mRNA. Scale bar, 50 μm (left). Graphs show the means ± SEM (n = 16 or more cells, two independent experiments) of fluorescence intensity of GFP-Bcl-2 (right). **p< 0.01, *p< 0.05 (one-way ANOVA). See also Supplementary Fig. 6
Fig. 7
Fig. 7
Apoptotic elimination of unfit cells is required for precise tissue patterning. a Sephs1 overexpression partially reduces physiologically occurring apoptosis in embryos as determined by caspase-3 immunostaining. Box plots of caspase-3-active cell number per embryo at 10 hpf stage show 75th, 50th (median) and 25th percentiles. Whiskers indicate minimum and maximum. Each dot represents one embryo (n = 28 embryos, two independent experiments). ****p< 0.0001, **p< 0.045 (one-way ANOVA). b Inhibiting ROS production distorts the Wnt/β-catenin-gradient. Whole-mount in situ hybridization of d2EGFP in Tg(OTM:d2EGFP) embryos (dorsal view) injected with mKO2 (control), SOD1, or sephs1 mRNA (800 pg) or treated with 100 μM NAC. Magnification of boxed area (black line) (right). Embryo percentages and numbers with similar expression patterns are shown. Red arrows: ectopic activation or inactivation areas. Scale bar, 200 μm. p < 0.05 for NAC treatment versus control; p < 0.01 for SOD1 or sephs1 mRNA versus control (Fisher’s exact test). c Inhibition of ROS-mediated apoptosis distorts AP patterning. Panels show whole-mount in situ hybridization of otx2 (marker of presumptive forebrain and midbrain), pax2a (marker of presumptive midbrain-hindbrain boundary), and cdx4 (marker of presumptive spinal cord) in embryos uninjected or injected with mKO2 (control), p35, sephs1, or SOD1 mRNA (800 pg). Scale bar, 200 μm. Bottom schematic illustration indicates expression pattern of AP tissue markers. Right graphs show percentages of embryos with normal or abnormal expression patterns. In abnormal embryos, a posterior marker (cdx4) and anterior markers (pax2a and otx2) are ectopically activated in the anterior and posterior areas, respectively. d Overexpression of SOD1 or sephs1 mRNA induces abnormal morphogenesis. Images show 32 hpf zebrafish larvae uninjected or injected with SOD1 or sephs1 mRNA (800 pg). Red arrow indicates abnormal cell proliferation. Scale bar, 500 μm. Percentages of embryos with normal or abnormal morphology are shown. The numbers shown above the graph indicate the total numbers of embryos analysed. **p< 0.01 (Fisher’s exact test). Note that a portion of embryos showed the anteriorization-related phenotype (e.g. short trunk and tail) or posteriorization-related phenotype (e.g. head- and eye-size reduction). A small number of embryos generated a tumour-like cell mass (arrows). e Schematic diagram of the Wnt/β-catenin-noise cancelling system. See also Supplementary Fig. 7

References

    1. Schier AF, Talbot WS. Molecular genetics of axis formation in zebrafish. Annu. Rev. Genet. 2005;39:561–613. doi: 10.1146/annurev.genet.37.110801.143752. - DOI - PubMed
    1. Wolpert L. Positional information and the spatial pattern of cellular differentiation. J. Theor. Biol. 1969;25:1–47. doi: 10.1016/S0022-5193(69)80016-0. - DOI - PubMed
    1. Petersen CP, Reddien PW. Wnt signaling and the polarity of the primary body axis. Cell. 2009;139:1056–1068. doi: 10.1016/j.cell.2009.11.035. - DOI - PubMed
    1. Merino MM, Levayer R, Moreno E. Survival of the fittest: essential roles of cell competition in development, aging, and cancer. Trends Cell Biol. 2016;26:776–788. doi: 10.1016/j.tcb.2016.05.009. - DOI - PubMed
    1. Morata G, Ripoll P. Minutes: mutants of drosophila autonomously affecting cell division rate. Dev. Biol. 1975;42:211–221. doi: 10.1016/0012-1606(75)90330-9. - DOI - PubMed

Publication types

MeSH terms