. 2020 Sep 25;21(5):1706-1716.
doi: 10.1093/bib/bbz092.

Tools for fundamental analysis functions of TCR repertoires: a systematic comparison

Affiliations

Tools for fundamental analysis functions of TCR repertoires: a systematic comparison

Yanfang Zhang et al. Brief Bioinform. .

Abstract

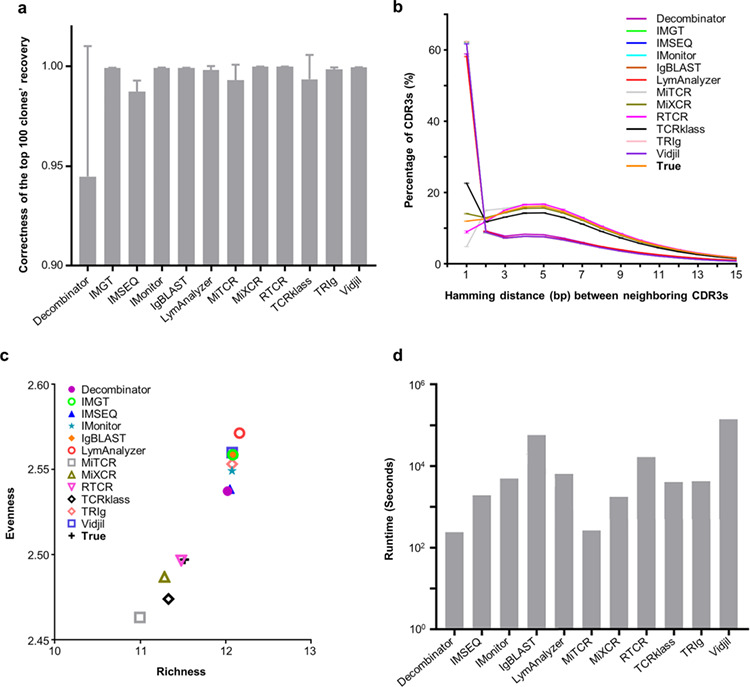
The full set of T cell receptors (TCRs) in an individual is known as his or her TCR repertoire. Defining TCR repertoires under physiological conditions and in response to a disease or vaccine may lead to a better understanding of adaptive immunity and thus has great biological and clinical value. In the past decade, several high-throughput sequencing-based tools have been developed to assign TCRs to germline genes and to extract complementarity-determining region 3 (CDR3) sequences using different algorithms. Although these tools claim to be able to perform the full range of fundamental TCR repertoire analyses, there is no clear consensus of which tool is best suited to particular projects. Here, we present a systematic analysis of 12 available TCR repertoire analysis tools using simulated data, with an emphasis on fundamental analysis functions. Our results shed light on the detailed functions of TCR repertoire analysis tools and may therefore help researchers in the field to choose the right tools for their particular experimental design.

Keywords: in silico simulation; T-cell receptor repertoire; high-throughput sequencing; immunology; tools benchmarking.


Figures

Figure 1
Figure 1
Flowchart showing the guidelines for TCR Rep-Seq tool selection. This flowchart is a step-by-step guideline showing how to select a tool for given input file formats, different sequencing strategies, customization of reference germ line databases, and expected output details.
Figure 2
Figure 2
Simulation pipeline for benchmark data. Simulated data were modeled after real-world data from a deep sequencing dataset. This model consists of statistics for gene usage, gene deletion and gene insertion. These parameters were considered to generate original individual clonotypes, sizes for which were assigned based on Zipf’s law. Subsequent PCR process and NGS were implemented using an in-house python script and a published sequencing simulator (ART), respectively. The amplified sequences were then randomly selected for subsequent HTS, which yielded in silico datasets resembling a real-world TCR repertoire dataset.
Figure 3
Figure 3
Statistics and comparisons of V and J gene segment assignments. (Left Y axis) The red boxplots show the percentage of reads assigned with V (a) and J (b) gene segments, V (c) and J (d) alleles. (Right Y axis) The blue dashed line indicates the accuracy of germline gene segment assignment. Note: aMiTCR does not report gene fragment assignments; bTCRklass, bDecombinator, bTRIg do not report allele information.
Figure 4
Figure 4
CDR3 identification results. a. The bar graph shows the ratio of the reported number of unique CDR3 nucleotide sequences to the “True” number (Left Y axis). The ratio of CDR3 identification is calculated as the number of reported CDR3s divided by the number of true CDR3s. The sections of blue, light orange, and light grey indicate the proportion of “True” CDR3s, non-singleton false positives, and singleton false positives, respectively. The error bars indicate the standard deviations. The grey line shows the percentage of singleton false positives identified by each tool (Right Y axis). MiTCR, MiXCR, RTCR and TCRklass reported the fewest false-positive CDR3s. b. Recall and accuracy of the resulting repertoires generated by twelve tools for five replicates. Recall (X axis) is defined as the fraction of simulated CDR3s that were correctly identified. Accuracy is defined as the fraction of simulated CDR3s in the total identified ones (Y axis). c. The fraction of singletons among the false-negative CDR3s. The light blue bars at the bottom indicate the fraction of singleton CDR3s with either PCR or sequencing errors, and the darker blue bars stand for those singletons without errors. d. The fraction of false positives that were caused by PCR or HTS errors. The X axis indicates the number of false positives identified by different tools, and the Y axis shows the fraction of error-containing false positives.
Figure 5
Figure 5
Clonality and runtime efficiency analyses results. a. Rank consistency of the top 100 clones between the true set and each tool’s recovery set. The grey bars indicate the average Spearman rank correlation coefficient based on 5 replicates, and the error bars indicate standard deviations. Higher bars indicate better recovery for the top 100 clones. b. Distribution of Hamming distance between nearest neighbor CDR3s. Each CDR3 was compared to all CDR3s with the same length, and the closest match is defined as its nearest neighbor. The Hamming distance was then calculated accordingly (X axis). The Y axis indicates the percent of CDR3s having specific distance to their nearest neighbors. Distributions closer to the True distribution are better than others. c. The distributions of repertoire richness and evenness. The richness and evenness were calculated according to Renyi entropies (see Materials and Methods). d. Runtime comparisons among tools. The bars indicate how many seconds does a tool needed to finish the calculation with same memory and CPU unit. The faster tools are indicated by the lower bars.

References

    1. Nikolich-Žugich J, Slifka MK, Messaoudi I. The many important facets of T-cell repertoire diversity. Nat Rev Immuno 2004;4:123–32. - PubMed
    1. Hosoi A, Takeda K, Nagaoka K, et al. Increased diversity with reduced “diversity evenness” of tumor infiltrating T-cells for the successful cancer immunotherapy. Sci Rep 2018;8:1058. - PMC - PubMed
    1. Dahal-Koirala S, Risnes LF, Christophersen A, et al. TCR sequencing of single cells reactive to DQ2.5-glia-α2 and DQ2.5-glia-ω2 reveals clonal expansion and epitope-specific V-gene usage. Mucosal Immunol 2016;9:587–96. - PubMed
    1. Delemarre EM, van den Broek T, Mijnheer G, et al. Autologous stem cell transplantation aids autoimmune patients by functional renewal and TCR diversification of regulatory T cells. Blood 2016;127:91–101. - PubMed
    1. Yew PY, Alachkar H, Yamaguchi R, et al. Quantitative characterization of T-cell repertoire in allogeneic hematopoietic stem cell transplant recipients. Bone Marrow Transplant 2015;50:1227–34. - PMC - PubMed

Publication types

Substances