. 2020 Jan;19(1):e13046.
doi: 10.1111/acel.13046. Epub 2019 Oct 17.

MicroRNA-134-5p inhibition rescues long-term plasticity and synaptic tagging/capture in an Aβ(1-42)-induced model of Alzheimer's disease

Affiliations

MicroRNA-134-5p inhibition rescues long-term plasticity and synaptic tagging/capture in an Aβ(1-42)-induced model of Alzheimer's disease

Nimmi Baby et al. Aging Cell. 2020 Jan.

Abstract

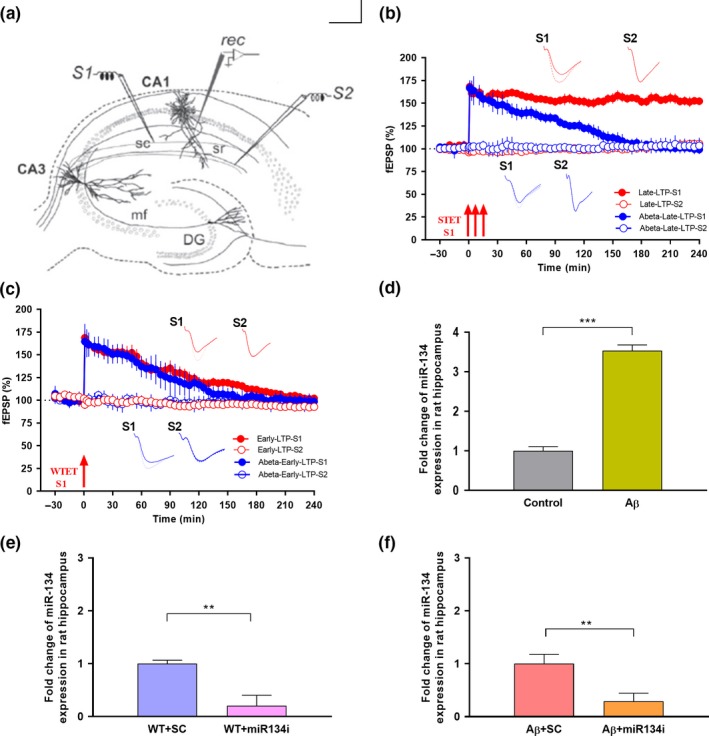
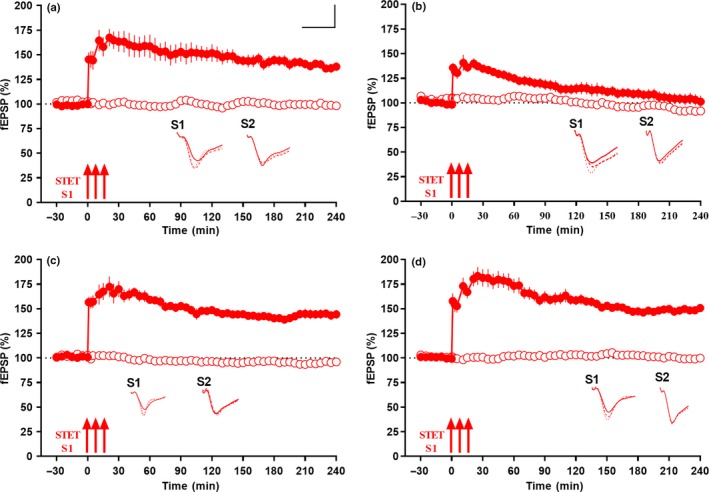
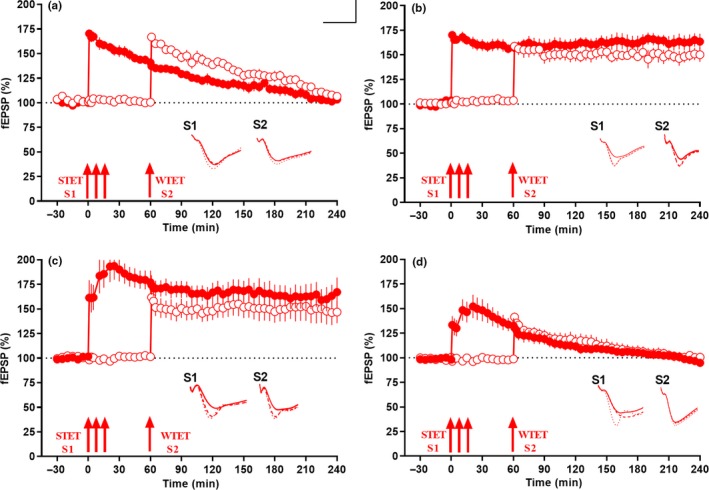
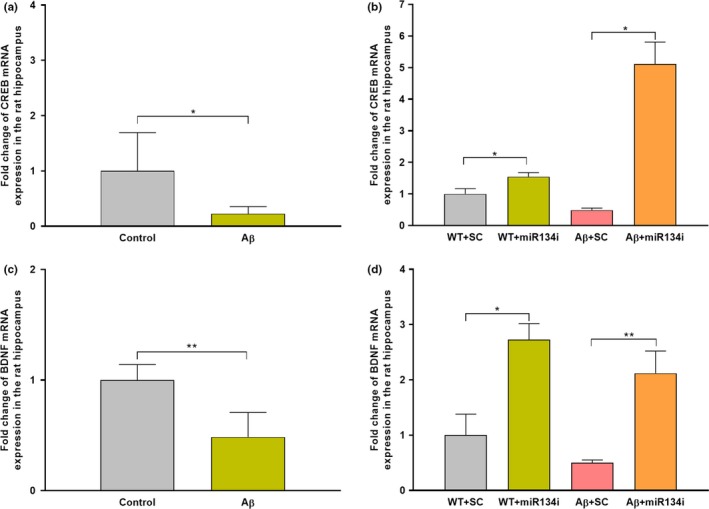
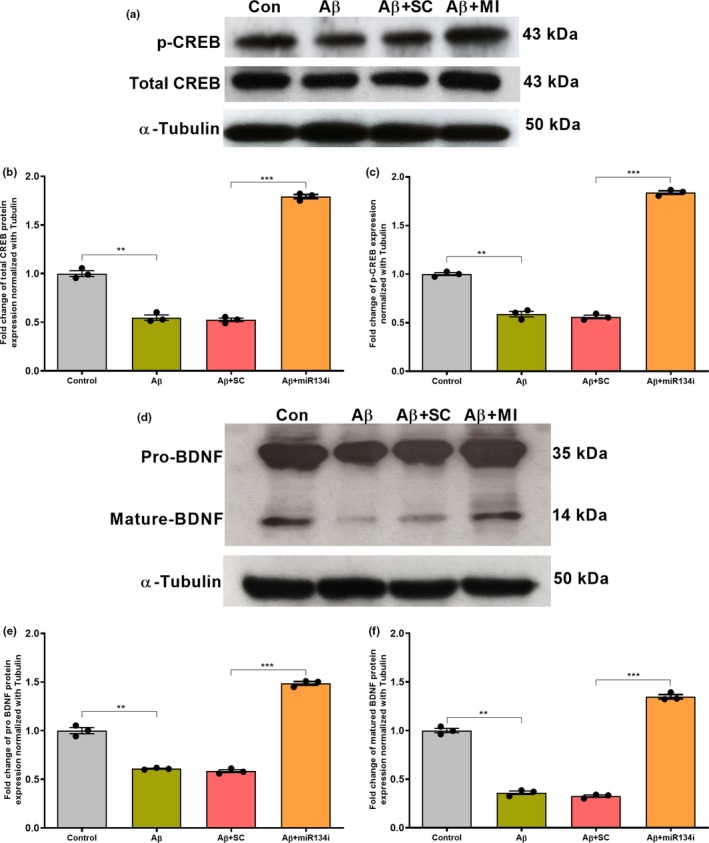
Progressive memory loss is one of the most common characteristics of Alzheimer's disease (AD), which has been shown to be caused by several factors including accumulation of amyloid β peptide (Aβ) plaques and neurofibrillary tangles. Synaptic plasticity and associative plasticity, the cellular basis of memory, are impaired in AD. Recent studies suggest a functional relevance of microRNAs (miRNAs) in regulating plasticity changes in AD, as their differential expressions were reported in many AD brain regions. However, the specific role of these miRNAs in AD has not been elucidated. We have reported earlier that late long-term potentiation (late LTP) and its associative mechanisms such as synaptic tagging and capture (STC) were impaired in Aβ (1-42)-induced AD condition. This study demonstrates that expression of miR-134-5p, a brain-specific miRNA is upregulated in Aβ (1-42)-treated AD hippocampus. Interestingly, the loss of function of miR-134-5p restored late LTP and STC in AD. In AD brains, inhibition of miR-134-5p elevated the expression of plasticity-related proteins (PRPs), cAMP-response-element binding protein (CREB-1) and brain-derived neurotrophic factor (BDNF), which are otherwise downregulated in AD condition. The results provide the first evidence that the miR-134-mediated post-transcriptional regulation of CREB-1 and BDNF is an important molecular mechanism underlying the plasticity deficit in AD; thus demonstrating the critical role of miR-134-5p as a potential therapeutic target for restoring plasticity in AD condition.

Keywords: Alzheimer's disease; Aβ(1-42); brain-derived neurotrophic factor; cAMP response element-binding protein; long-term potentiation; miRNA; synaptic tagging.


Conflict of interest statement

The authors declare that the research was conducted in the absence of any commercial or financial relationships that could be construed as a potential conflict of interest.

Figures

Figure 1
Figure 1
miR‐134‐5p expression in Aβ (1–42)‐treated rat hippocampus: (a) Schematic representation of the positioning of electrodes in the CA1 region of a transverse hippocampal slice. Recording electrode (rec) positioned in CA1 apical dendrites was flanked by two stimulating electrodes S1 and S2 in stratum radiatum (sr) to stimulate two independent Schaffer collateral (sc) synaptic inputs of the same neuronal population. (b) Late long‐term potentiation (late LTP) was maintained for 4 hr when a strong tetanization (STET) was applied to S1 (red closed circles). However, basal potential in S2 (red open circles) remained stable in wild‐type control slices (n = 7). STET application in S1 (blue closed circles) in Aβ (1–42) (200 nM) pretreated slices displayed impaired late LTP. Control potentials from S2 (blue open circles) remained stable throughout the recording (n = 7). (c) Induction of early LTP in S1 (red closed circles and blue closed circles) using a weak tetanization (WTET) protocol in both wild‐type control and Aβ (1–42) (200 nM) pretreated slices resulted in early LTP (red closed circles and blue closed circles, n = 7). Control potentials from S2 (red open circles and blue open circles) remained stable throughout the recording. All data presented as mean ± SEM. (d) qRT‐PCR analysis showed that miR‐134 expression was significantly increased in Aβ‐treated rat hippocampus by 3.5‐fold in comparison to wild‐type control rat hippocampus. Each sample was measured in duplicates and the expression of miR‐134‐5p was normalized to the expression levels of a miRNA reference gene, miR‐103‐3p and presented as mean ± SD. Significant difference between the group control versus Aβ is indicated by ***˂ .001, (student's t test, 12 slices each from 3 different biological samples, n = 3). (e‐f) Knockdown efficiency of miR‐134‐5p inhibitor in wild‐type and Aβ (1–42)‐treated rat hippocampal slices: (e) qRT‐PCR analysis showing a significant decrease in miR‐134‐5p expression in wild‐type slices treated with miR‐134i when compared to miR‐134‐5p scrambled inhibitor (SCi) treated wild‐type slices. (f) qRT‐PCR analysis showing a significant reduction of miR‐134‐5p expression in miR‐134i + Aβ (1–42) co‐treated rat hippocampal slices compared to SCi + Aβ(1–42) co‐treated slices. The data were normalized with miR‐103a‐3p, an internal control and presented as mean ± SD. Significant differences between the groups: WT + SCi versus WT + miR‐134i and SCi + Aβ versus miR‐134i + Aβ are indicated by *p ˂ .01 (student's t test, 12 slices each from 3 different biological samples, n = 3). The three arrows represent strong tetanization (STET) applied for inducing late LTP. Single arrow represents weak tetanization (WTET) applied for inducing early LTP. Insets in each graph represent typical fEPSP traces recorded 15 min before (continuous line), 30 min after (dotted line) and 240 min after (broken line) the induction of LTP. Calibration bar for all analog sweeps: vertical: 3 mV; horizontal: 5 ms
Figure 2
Figure 2
miR‐134 knockdown by miR‐134i rescues late LTP in Aβ (1–42)‐induced rat hippocampal slices: (a) Late LTP was maintained for 4 hr when a strong tetanization (STET) was applied to S1 (red closed circles) while control baseline potentials in S2 (red open circles) remained stable in miR‐134i (1 μM) and Aβ (1–42) (200 nM) pretreated slices (n = 7). (b) Late LTP by STET in S1 (red closed circles) in scrambled inhibitor (SCi) (1 μM) and Aβ (1–42) (200 nM) pretreated slices was impaired while basal potential in S2 (red open circles) remained stable throughout the recording period (n = 7). (c) Late LTP was maintained for 4 hr when a strong tetanization (STET) was applied to S1 (red closed circles) while control baseline potentials in S2 (red open circles) remained stable in miR‐134i (1 μM) pretreated wild‐type slices (n = 6). (d) Late LTP by STET in S1 (red closed circles) in scrambled inhibitor (SCi) (1 μM) pretreated wild‐type slices maintained for 4 hr while basal potential in S2 (red open circles) remained stable throughout the recording period (n = 8). All symbols/traces are as in Figure 1. Calibration bar for all analog sweeps: vertical: 3 mV; horizontal: 5 ms
Figure 3
Figure 3
miR‐134 knockdown ameliorates Aβ (1–42)‐induced deficit in synaptic tagging and capture (STC). (a) Strong before weak paradigm in which STET applied in S1 (red closed circles) at 0 min to induce late LTP and WTET applied in S2 to induce early LTP (red open circles) at 60 min in Aβ(1–42) (200 nM) pretreated slices, potentiation in both synaptic inputs returned to baseline within 4 hr. No STC was observed in this condition while in (b), the same experimental design in control slices showed STC. Early LTP in S2 was transformed to late LTP by capturing PRPs from S1. (c) STET applied in S1 (red closed circles) at 0 min and WTET applied in S2 (red open circles) at 60 min in miR‐134i (1 μM) and Aβ(1–42)(200 nM) pretreated slices showed long‐lasting potentiation for 4 hr resulted in late LTP in both the synaptic inputs, thereby expressing STC (n = 7). (d) STET applied in S1 (red closed circles) at 0 min and WTET applied in S2 (red open circles) at 60 min in SCi (1 μM) and Aβ(1–42) (200 nM) pretreated slices both returned to baseline within 4 hr and failed to express late LTP in both the inputs S1 and S2 (n = 6). All data presented as mean ± SEM. The three arrows represent strong tetanization (STET) applied for inducing late LTP. Single arrow represents weak tetanization (WTET) applied for inducing early LTP. Insets in each graph represent typical fEPSP traces recorded 15 min before (continuous line), 30 min after (dotted line) and 240 min after (broken line) the induction of LTP. Calibration bar for all analog sweeps: vertical: 3 mV; horizontal: 5 ms
Figure 4
Figure 4
miR‐134 knockdown elevates CREB and BDNF mRNA expression in Aβ(1–42)‐treated rat hippocampus: (a) qRT‐PCR analysis showing a significant reduction of CREB‐1 mRNA expression in Aβ(1–42)‐treated hippocampal slices. Each sample was measured in duplicates and normalized to the internal control GAPDH. Significant differences between the two groups, Control versus Aβ, are indicated by *p ˂ .05 (student's t test, 12 slices each from 4 different biological samples, n = 4). (b) qRT‐PCR analysis showing a significant increase in CREB‐1 mRNA expression in miR‐134 knockdown wild‐type slices treated with or without Aβ(1–42) compared to scrambled miR‐134 inhibitor‐treated wild‐type slices with or without Aβ(1–42). Each sample was measured in duplicates and normalized to the internal control GAPDH. Significant differences between the groups: WT + SCi versus WT + miR‐134i and SCi + Aβ versus miR‐134i + Aβ are indicated by *p ˂ .05, (one‐way ANOVA, 12 slices each from 4 different biological samples, n = 4). (c) qRT‐PCR analysis showing a significant decrease of BDNF mRNA expression in Aβ(1–42)‐treated rat hippocampal slices. Each sample was measured in duplicates and normalized to the internal control GAPDH. Significant differences between the two groups Control versus Aβ are indicated by **˂ .01 (student's t test, 12 slices each from 4 different biological samples, n = 4). (d) miR‐134 knockdown using miR‐134i in wild‐type slices treated with or without Aβ (1–42) significantly elevated BDNF mRNA levels when compared to scrambled miR‐134 inhibitor‐treated wild‐type slices co‐treated with or without Aβ(1–42). Each sample was measured in duplicates and normalized to the internal control GAPDH. Significant differences between the groups: WT + SCi versus WT + miR‐134i and SCi + Aβ versus miR‐134i + Aβ are indicated by *˂ .05, **p ˂ .01 (one‐way ANOVA, 12 slices each from 4 different biological samples, n = 4)
Figure 5
Figure 5
(a–c) miR‐134 knockdown elevates total CREB and p‐CREB levels in rat hippocampal slices: Western blot analysis showing a significant reduction in total CREB and p‐CREB levels in Aβ(1–42)‐treated young rat hippocampal slices when compared to that of wild‐type control (a–c). However, a significant increase in total CREB and p‐CREB expression was detected in miR‐134 knockdown Aβ(1–42)‐treated rat hippocampal slices when compared to the respective scrambled inhibitor (SCi)‐treated group (a–c). Total CREB (43 kDa), p‐CREB (43 kDa) and α‐Tubulin (50 kDa) immunoreactive bands are shown (a). The data are normalized to respective tubulin. Significant differences between the groups (Control versus Aβ and SCi + Aβ versus miR‐134i + Aβ are indicated by **˂ .01, **˂ .001, (one‐way ANOVA, 12 slices each from 4 different biological samples, n = 4). (d–f) miR‐134 knockdown increases pro‐ and mature‐BDNF level: Western blot analysis shows that both pro‐ and mature‐BDNF protein levels were reduced in Aβ (1–42)‐treated young rat hippocampus and SCi + Aβ (1–42)‐treated young rat hippocampus when compared to wild‐type control hippocampus (d–f). However, a significant increase in both pro‐ and mature‐BDNF expression was observed in miR‐134 knockdown Aβ (1–42)‐treated hippocampal slices when compared to the respective scrambled inhibitor‐treated groups (d–f). Pro‐BDNF (35 kDa), mature‐BDNF (14 kDa) and α‐Tubulin (50 kDa) immunoreactive bands are shown (d). The data are normalized to respective tubulin. Significant differences between the groups: Control versus Aβ, SCi + Aβ versus miR‐134i + Aβ are indicated by **˂ .01, ***˂ .001 (one‐way ANOVA, 12 slices each from 4 different biological samples, n = 4)

References

    1. Alzheimer’s Association , (2015). 2015 Alzheimer's disease facts and figures. Alzheimer's & Dementia: The Journal of the Alzheimer's Association, 11(3), 332. - PubMed
    1. Arancibia, S. , Silhol, M. , Moulière, F. , Meffre, J. , Höllinger, I. , Maurice, T. , & Tapia‐Arancibia, L. (2008). Protective effect of BDNF against beta‐amyloid induced neurotoxicity in vitro and in vivo in rats. Neurobiology of Disease, 31(3), 316–326. 10.1016/j.nbd.2008.05.012 - DOI - PubMed
    1. Bastin, C. , Bahri, M. A. , Miévis, F. , Lemaire, C. , Collette, F. , & Genon, S. , … Salmon, E. (2014). Associative memory and its cerebral correlates in Alzheimer׳ s disease: Evidence for distinct deficits of relational and conjunctive memory. Neuropsychologia, 63, 99–106. - PMC - PubMed
    1. Caccamo, A. , Maldonado, M. A. , Bokov, A. F. , Majumder, S. , & Oddo, S. (2010). CBP gene transfer increases BDNF levels and ameliorates learning and memory deficits in a mouse model of Alzheimer's disease. Proceedings of the National Academy of Sciences, 107, 201012851. - PMC - PubMed
    1. Caracciolo, L. , Marosi, M. , Mazzitelli, J. , Latifi, S. , Sano, Y. , & Galvan, L. , … Carmichael, S. T. (2018). CREB controls cortical circuit plasticity and functional recovery after stroke. Nature Communications, 9(1), 2250. - PMC - PubMed

Publication types