

Effects of silver nanoparticles coated with anti-HER2 on irradiation efficiency of SKBR3 breast cancer cells
- PMID: 31625520
- PMCID: PMC8676115
- DOI: 10.1049/iet-nbt.2018.5258
Effects of silver nanoparticles coated with anti-HER2 on irradiation efficiency of SKBR3 breast cancer cells
Retraction in
-
Retraction.IET Nanobiotechnol. 2022 Aug;16(6):238. doi: 10.1049/nbt2.12087. Epub 2022 May 8. IET Nanobiotechnol. 2022. PMID: 35526269 Free PMC article.
Abstract
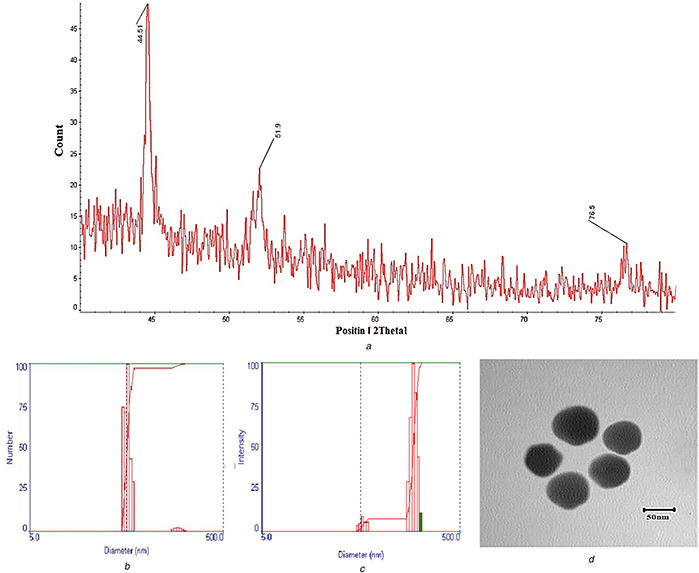
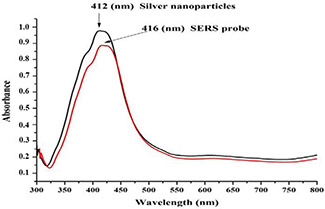
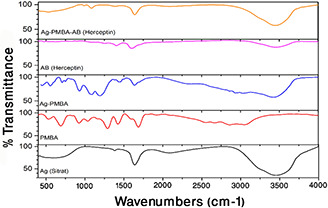
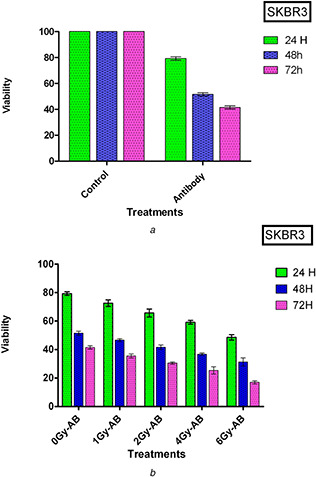
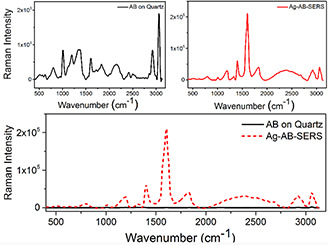
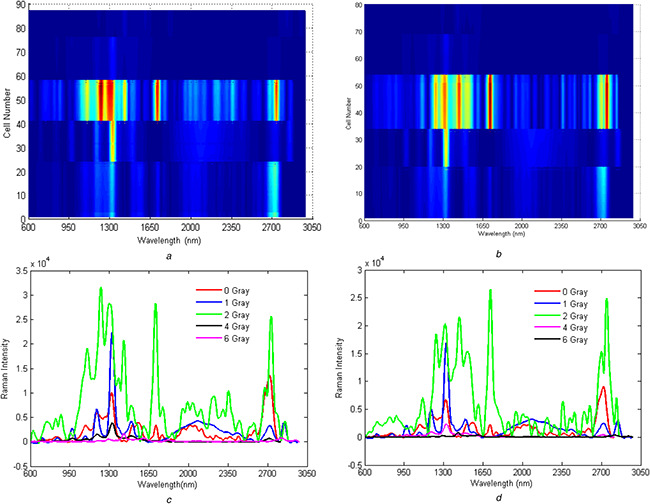
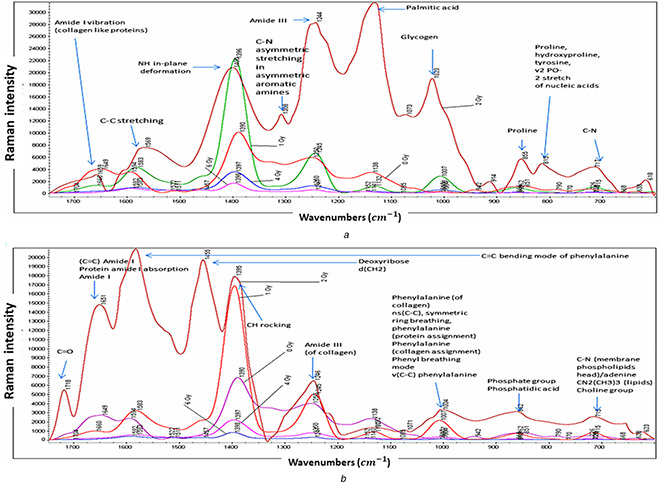
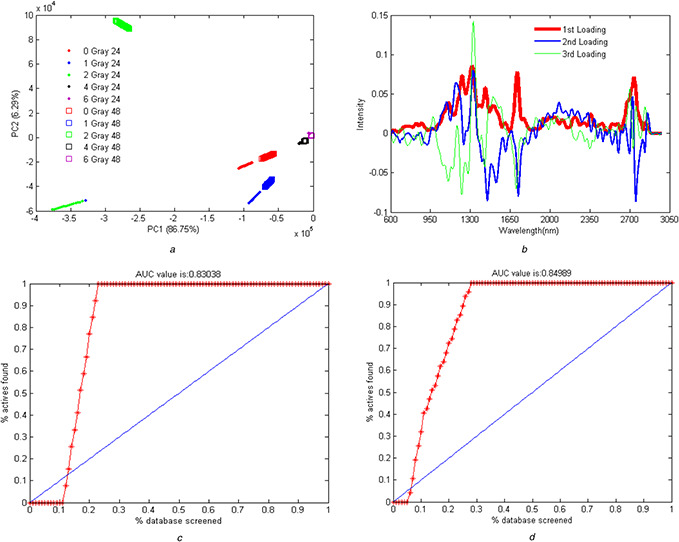
Breast cancer is the second cause of death in the world. Ionising radiation is a potent mutagen that can cause DNA damage, chromosomes breakage, and cell death. In the present study, radiotherapy and nanoparticle-antibodies (ABs) have been combined to enhance the efficacy of cancer cell treatment. Silver nanoparticles (SNP) were synthesised, coated with anti-HER2, and then characterised with different techniques such as X-ray diffraction, dynamic light scattering, transmission electron microscopy, Fourier transform infrared, and UV-Vis spectroscopy. SKBR3 cells were irradiated with cobalt-60 in the presence of nanoparticle-AB as the drug. Cell viability was measured using the diphenyltetrazolium bromide assay, and the cellular status was assessed by Raman spectroscopy. Irradiation considerably decreased cell viability proportionate to the dose increase and post-irradiation time. The surface-enhanced Raman spectroscopy increased the signal in the presence of SNP. Increasing the dose to 2 Gy increased the irradiation resistance, and higher dose increases (4 and 6 Gy) enhanced the irradiation sensitivity. Moreover, the cellular changes induced by irradiation in the presence of the drug were stable after 48 h. The authors results introduced the combination of the drug with radiation as an effective treatment for cancer and Raman spectroscopy as a suitable tool to diagnose effective irradiation doses.
Figures
References
-
- Hall E.J. Giaccia A.J.: ‘Radiobiology for the Radiologist’ (Lippincott Williams & Wilkins, Philadelphia, 2006)
-
- Mothersill C. Abend M. Bréchignac F. et al.: ‘The tubercular badger and the uncertain curve:‐the need for a multiple stressor approach in environmental radiation protection’, Environ. Res., 2019, 168, pp. 130 –140 - PubMed
-
- Thongsuksai P. Chongsuvivatwong V. Sriplung H.: ‘Delay in breast cancer care: a study in Thai women’, Med. Care, 2000, 38, (1), pp. 108 –114 - PubMed
Publication types
MeSH terms
Substances
LinkOut - more resources
Full Text Sources
Medical
Research Materials
Miscellaneous
