. 2019 Dec 6;125(12):1087-1102.
doi: 10.1161/CIRCRESAHA.119.315833. Epub 2019 Oct 18.

Mitochondrial Metabolic Reprogramming by CD36 Signaling Drives Macrophage Inflammatory Responses

Affiliations

Mitochondrial Metabolic Reprogramming by CD36 Signaling Drives Macrophage Inflammatory Responses

Yiliang Chen et al. Circ Res. .

Abstract

Rationale: A hallmark of chronic inflammatory disorders is persistence of proinflammatory macrophages in diseased tissues. In atherosclerosis, this is associated with dyslipidemia and oxidative stress, but mechanisms linking these phenomena to macrophage activation remain incompletely understood.

Objective: To investigate mechanisms linking dyslipidemia, oxidative stress, and macrophage activation through modulation of immunometabolism and to explore therapeutic potential targeting specific metabolic pathways.

Methods and results: Using a combination of biochemical, immunologic, and ex vivo cell metabolic studies, we report that CD36 mediates a mitochondrial metabolic switch from oxidative phosphorylation to superoxide production in response to its ligand, oxidized LDL (low-density lipoprotein). Mitochondrial-specific inhibition of superoxide inhibited oxidized LDL-induced NF-κB (nuclear factor-κB) activation and inflammatory cytokine generation. RNA sequencing, flow cytometry, 3H-labeled palmitic acid uptake, lipidomic analysis, confocal and electron microscopy imaging, and functional energetics revealed that oxidized LDL upregulated effectors of long-chain fatty acid uptake and mitochondrial import, while downregulating fatty acid oxidation and inhibiting ATP5A (ATP synthase F1 subunit alpha)-an electron transport chain component. The combined effect is long-chain fatty acid accumulation, alteration of mitochondrial structure and function, repurposing of the electron transport chain to superoxide production, and NF-κB activation. Apoe null mice challenged with high-fat diet showed similar metabolic changes in circulating Ly6C+ monocytes and peritoneal macrophages, along with increased CD36 expression. Moreover, mitochondrial reactive oxygen species were positively correlated with CD36 expression in aortic lesional macrophages.

Conclusions: These findings reveal that oxidized LDL/CD36 signaling in macrophages links dysregulated fatty acid metabolism to oxidative stress from the mitochondria, which drives chronic inflammation. Thus, targeting to CD36 and its downstream effectors may serve as potential new strategies against chronic inflammatory diseases such as atherosclerosis.

Keywords: animals; atherosclerosis; fatty acids; mice; mitochondria.


Figures

Figure 1.
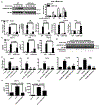
Figure 1.. OxLDL Induces CD36-Dependent Mitochondrial ROS Production.
(A) Examples of histograms of carboxy-DCFDA fluorescence in WT or cd36 null peritoneal macrophages treated with 50μg/ml oxLDL for 1h. MFI was quantified and shown in the bar graph; n=3 per group. (B) Examples of histograms of MitoNeoD fluorescence in WT peritoneal macrophages treated with 20 μg/ml LDL or oxLDL for 24h. MFI are shown in the bar graph; n=4 per group. (C) WT peritoneal macrophages treated with 20 μg/ml oxLDL for indicated time and MitoNeoD MFI was quantified and shown in the bar graph; n=4 per group. (D) Examples of histograms of MitoNeoD fluorescence in WT or cd36 null peritoneal macrophages treated with 20 μg/ml oxLDL for 24h. MFI was quantified and shown in the bar graph; n=4 per group. ****p<0.0001 compared to control.
Figure 2.
Figure 2.. OxLDL-Induced Mitochondrial ROS Facilitates NF-κB Activation and Pro-inflammatory Cytokine Production.
(A) Examples of Western blot images from WT and cd36 null macrophages treated with 20 μg/ml oxLDL for indicated time periods. NF-κB activation was assessed by immunoblot using an antibody against phospho-serine536 in NF-κB (p65). Membranes were stripped and re-probed with the antibody against NF-κB (p65). Blot images were quantified and expressed as percentage of control; n=3 per group. (B) WT and cd36 null peritoneal macrophages were treated with 20 μg/ml oxLDL for 8h. Total RNA was isolated and subjected to qRT-PCR for analysis of pro-inflammatory cytokine genes including mcp1, il6, tnf-α, and cxcl10. The anti-inflammatory cytokine il10 was also assessed n=4 per group. (C) WT and cd36 null peritoneal macrophages were treated with 20 μg/ml oxLDL for 8h. Then culture media were collected and subjected to ELISA assay for MCP-1, IL-6, and TNf-α; n=4 per group. (D) Examples of Western blot images from WT peritoneal macrophages treated with 20 μg/ml oxLDL for indicated time (lane 1-4), or cells pre-treated with 500μM MitoTEMPO for 1h before addition of 20 μg/ml oxLDL (lane 5-8), or cells pre-treated with 200μM etomoxir for 1h before addition of 20 μg/ml oxLDL (lane 9-12). Membranes were probed for phospho-serine536 in NF-κB, stripped and re-probed for NF-κB; n=3. (E) WT peritoneal macrophages were treated with 20μg/ml oxLDL for 4h or pre-treated with either 500μM MitoTEMPO or 200μM etomoxir for 1h before addition of 20μg/ml oxLDL for 4h. Total RNA was isolated and subjected to qRT-PCR for mcp1, il6, tnf-α, cxcl10, and il1b; n=4 per group. (F) WT peritoneal macrophages were treated with 20 μg/ml oxLDL for 24h or pre-treated with either 500μM MitoTEMPO or 200μM etomoxir for 1h before addition of 20 μg/ml oxLDL for 24h. Culture media were collected and subjected to ELISA assay for MCP-1, and IL-6; n=4 per group. Data are presented as mean ± SEM. **p<0.01, ***p<0.001, ****p<0.0001 compared to control conditions. ##p<0.01, ###p<0.001, ####p<0.0001 compared to oxLDL treated alone conditions.
Figure 3.
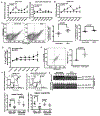
Figure 3.. OxLDL-CD36 Signaling Induces a Metabolic Switch in Macrophages from Mitochondrial OXPHOS to Glycolysis.
(A/B) Left panels show representative OCR (A) and ECAR (B) curves from WT peritoneal macrophages treated with incremental concentrations of oxLDL for 24h. Right panels show quantified data from replicate studies; n=4 per group. Both OCR and ECAR values were normalized by protein content in each 96-well sample. (C) OCR and ECAR levels were quantified from WT peritoneal macrophages treated with 50 μg/ml oxLDL at timed points; n=4 per group. (D) Examples of histograms of 2-NBDG fluorescence in WT peritoneal macrophages treated with 50 μg/ml oxLDL for 3h. Mean fluorescence intensity (MFI) was quantified from 5 separate experiments and shown as fold change in the bar graph. (E) Examples of Western blot image of PDHK1 and β-actin (loading control) from WT peritoneal macrophages treated with 20 μg/ml oxLDL for 24h. Images were quantified, normalized to β-actin and expressed as percentage of control. n=3 per group. (F) OCR and ECAR were quantified and combined from WT or cd36 null peritoneal macrophages treated with 20 μg/ml oxLDL for 24h. n=4 per group; WT or cd36 null peritoneal macrophages were treated with 20 μg/ml oxLDL for 5h in the presence of 2-NBDG and intracellular 2-NBDG fluorescence signals were measured by flow cytometry; n=3 per group. (G) WT or cd36 null peritoneal macrophages were treated with 20 μg/ml oxLDL for indicated time periods and cell surface levels of glucose transporter Glut1 were assessed by flow cytometry using PE-conjugated anti-Glut1 IgG; n=4 per group. (H) WT or cd36 null cd36 null peritoneal macrophages were treated with 20 μg/ml oxLDL for 24h and mitochondria membrane potential was assayed by TMRM fluorescence. MFI was quantified and shown in the bar graph; n=4 per group. (I) Examples of western blots with anti-FITC and anti-ATP5A antibodies in anti-ATP5A immunoprecipitates from WT peritoneal macrophages treated with indicated concentrations of oxLDL for 24hr and incubated with 5-IAF to tag cysteine free thiols. (J) Examples of histograms of 2-NBDG fluorescence in WT peritoneal macrophages treated with 20 μg/ml oxLDL for 5h or pre-treated with MitoTempo for 1h before addition of 20 μg/ml oxLDL for 5h; n=3 per group. *p<0.05, **p<0.01, ****p<0.0001 compared to control conditions.
Figure 4.
Figure 4.. Next-Generation RNA Sequencing Reveals That OxLDL Leads to Re-programming of Major Metabolic Pathways in Macrophages.
WT peritoneal macrophages were treated with 20 μg/ml oxLDL for 8h (n=3 per group) and total RNA was isolated, purified and subjected to next-generation RNA sequencing. (A) Venn Diagram of the differentially expressed genes among four pair-wise comparisons shows that the treatment of oxLDL has a strong effect in both genetic backgrounds, a loss of many gene’s response for cd36 null, and a switch where new genes change expression for cd36 null that did not for WT. (B) PC analysis revealed a strong and consistent global gene expression change for both the treatment with oxLDL and for the cd36 null. The first PC was largely determined by treatment, while the second by cd36 null. (C) Expression of genes encoding metabolic enzymes involved in the TCA cycle. (D) Expression of genes encoding metabolic enzymes contributing to the electron transport chain. Gene expression values were expressed as log2(FC) comparing between oxLDL and control conditions and shown in the heatmap. FC: fold change. (E) Expression of genes encoding antioxidant enzymes. Key enzymes emphasized in the text are highlighted in red rectangles. (F) Expression of genes encoding metabolic enzymes contributing to de novo fatty acid synthesis. (G) Expression of genes encoding metabolic enzymes contributing to the fatty acid oxidation. Gene expression values were converted by Z-score and shown in the heatmap.
Figure 5.
Figure 5.. OxLDL Stimulates Fatty Acid Trafficking into Mitochondria, Driving Re-purposing and Inflammation.
(A) WT or cd36 null peritoneal macrophages were treated with 20 μg/ml oxLDL for 24h. Cells were then incubated with 1μg/ml bodipy-palmitic acid for 5min. Fluorescence signals from bodipy-palmitic acid were assayed by flow cytometry and data were combined and shown in the bar graphs; n=3 per group. (B) WT peritoneal macrophages were treated with 20 μg/ml oxLDL for 24h. Total RNA was isolated and subjected to qRT-PCR for specific genes involved in FA uptake and intracellular trafficking, including cd36, fabp4, acsl1, cpt1a and cpt2; n=4 per group. (C) Examples of Western blots of FABP4, ACSL1 and β-actin (loading control) from WT peritoneal macrophages treated with culture medium or 20 μg/ml oxLDL for 24h. Images were quantified, normalized by β-actin and expressed as percentage of control; n=5 per group. (D) Examples of Western blot images from WT peritoneal macrophages treated with 20 μg/ml oxLDL for indicated times. ACC inactivation was detected by immunoblot using an antibody against ACC1/2 phospho-serine791. Membranes were stripped and re-probed with the antibody against ACC1/2. Blots of the mitochondrial specific isoform ACC2 were quantified and expressed as percentage of control; n=4 per group. (E) WT or cd36 null peritoneal macrophages were treated with 20 μg/ml oxLDL for 3h before addition of 3H-Palmitate and mitochondria fractions were isolated and 3H signals were quantified; n=5 per group. (F) WT peritoneal macrophages were treated with 20 μg/ml oxLDL for 8h. Total RNA was isolated and subjected to qRT-PCR for genes responsible for the initial step of FAO including acadm and acadl; n=4 per group. (G) WT or cd36 null peritoneal macrophages were treated with 20 μg/ml oxLDL for 24h and then subjected to FAO assay using the Seahorse XF system. The differences in OCR with or without etomoxir were calculated and considered basal FAO. The differences in OCR with or without etomoxir after addition of FCCP were calculated and considered maximum FAO. n=3 per group. (H) WT macrophage mitochondria were isolated and subjected to (QFAME) lipidomics analysis. All detected fatty acid species were quantified and shown in the bar graphs. n=3 per group. (I) WT peritoneal macrophages were treated with 20 μg/ml oxLDL for 5h after pre-treatment with 200μM etomoxir for 1h. Mitochondrial ROS levels were then assayed using MitoNeoD and MFI was quantified and shown in the bar graphs. Data are presented as percentage of mitochondrial ROS induction by oxLDL; n=3 per group. (J) WT peritoneal macrophages were treated with 20 μg/ml oxLDL for 5h in the presence of 2-NBDG after pre-treatment with 200μM etomoxir for 1h followed. Intracellular 2-NBDG fluorescence was measured by flow cytometry and MFI was quantified and expressed as percentage of control. n=4 per group. (K) WT or cd36 null peritoneal macrophages were pre-treated with different doses (50μM, 100μM and 200μM) of etomoxir for 1h followed by addition of 20 μg/ml oxLDL for 24h. Culture media were collected and subjected to ELISA assay for MCP-1, and IL-6; n=4 per group. *p<0.05, **p<0.01 compared to control conditions.
Figure 6.
Figure 6.. OxLDL Alters Morphology and Dynamics of the Mitochondria Network.
(A) Examples of confocal images of WT bone marrow-derived macrophages expressing mitochondrial-targeting EYFP. Cells were either maintained in the culture media (control) or treated with 20 μg/ml oxLDL for 24h. Scale bar: 20μM. White rectangle area within the left image was magnified and shown on the right for both conditions. (B) Images from (A) were processed and 3D mitochondrial networks were reconstituted. PHI represents the relative size of the largest connected component to the total mitochondrial size. White arrows point to the three way junctions and white arrow heads to the free ends in the magnified views in (A). The above parameters were quantified by the software MitoGraph and shown in the bar graph. n=25~30 for each group. (C) Examples of Western blots of DRP1, MFN1 and β-actin (loading control) from WT peritoneal macrophages treated with 20 μg/ml oxLDL for indicated time. Images of DRP1 were quantified, normalized by β-actin and expressed as percentage of control; n=3 per group. *p<0.05 compared to control. (D) Examples of EM images of WT peritoneal macrophages treated with culture media (control) or with 50 μg/ml oxLDL for 24h were shown. Mitochondria with abnormal cristae structures were highlighted by black arrows. Scale bar: 500nm.
Figure 7.
Figure 7.. CD36 Directs a Mitochondrial Metabolic Switch in Vivo under Atherogenic Conditions.
(A) WBC mitochondrial ROS levels were measured by flow cytometry in cells from apoe null mice (left panel) and apoe/cd36 double null mice fed chow or high fat diet (HFD) weekly for 6 weeks; n=5 per group. (B) CD36 surface expression levels were assessed in WBC from apoe null mice on chow or HFD weekly for 6 weeks; n=5 per group. (C) Examples of dot plots of WBC from apoe null mice on chow/HFD for 4 weeks. WBCs were stained with MitoNeoD for Mitochondrial ROS and FITC-conjugated anti-Ly6C. Percentage of MitoNeoD+Ly6C+ and MitoNeoDLy6C+ populations; n=5 per group. (D) apoe null WBCs were stained with PE-conjugated anti-Glut1 and FITC-conjugated anti-Ly6C. Percentage of Ly6C+Glut1+ population is shown; n=5 per group. (E) Aortic lesional F4/80+ cell population was stained with MitoNeoD and FITC-conjugated anti-CD36. A typical dot plot was shown and MitoNeoD MFI were compared between CD36+ and CD36 populations. (F) At the conclusion of 6-weeks of HFD, apoe null mice or apoe/cd36 double null mice were sacrificed and peritoneal cells were isolated and analyzed by the Seahorse Mito Stress Test. Representative OCR curves are shown in the upper panels and individual OCR basal levels as well as spare capacity levels in the lower panels as dot plots. (G) Examples of images of anti-FITC and anti-ATP5A Western blots of macrophages from apoe null or apoe/cd36 double null mice collected after the 6-week HFD challenge. ATP5A cysteine modification was assayed by the same procedure as detailed in Figure 3I. *p<0.05, **p<0.01, ***p<0.001 compared to chow diet group.

Comment in

References

    1. Barquera S, Pedroza-Tobias A, Medina C, Hernandez-Barrera L, Bibbins-Domingo K, Lozano R and Moran AE. Global Overview of the Epidemiology of Atherosclerotic Cardiovascular Disease. Arch Med Res. 2015;46:328–38. doi: 10.1016/j.arcmed.2015.06.006. - DOI - PubMed
    1. Jackson AO, Regine MA, Subrata C and Long S. Molecular mechanisms and genetic regulation in atherosclerosis. Int J Cardiol Heart Vasc. 2018;21:36–44. doi: 10.1016/j.ijcha.2018.09.006. - DOI - PMC - PubMed
    1. Tietge UJ. Hyperlipidemia and cardiovascular disease: inflammation, dyslipidemia, and atherosclerosis. Curr Opin Lipidol. 2014;25:94–5. doi: 10.1097/MOL.0000000000000051. - DOI - PubMed
    1. Libby P, Ridker PM and Maseri A. Inflammation and atherosclerosis. Circulation. 2002;105:1135–43. doi. - PubMed
    1. Moore KJ and Tabas I. Macrophages in the pathogenesis of atherosclerosis. Cell. 2011;145:341–55. doi: 10.1016/j.cell.2011.04.005. - DOI - PMC - PubMed

Publication types