. 2020 Mar 1;36(5):1614-1621.
doi: 10.1093/bioinformatics/btz788.

Topological data analysis quantifies biological nano-structure from single molecule localization microscopy

Affiliations

Topological data analysis quantifies biological nano-structure from single molecule localization microscopy

Jeremy A Pike et al. Bioinformatics. .

Abstract

Motivation: Localization microscopy data is represented by a set of spatial coordinates, each corresponding to a single detection, that form a point cloud. This can be analyzed either by rendering an image from these coordinates, or by analyzing the point cloud directly. Analysis of this type has focused on clustering detections into distinct groups which produces measurements such as cluster area, but has limited capacity to quantify complex molecular organization and nano-structure.

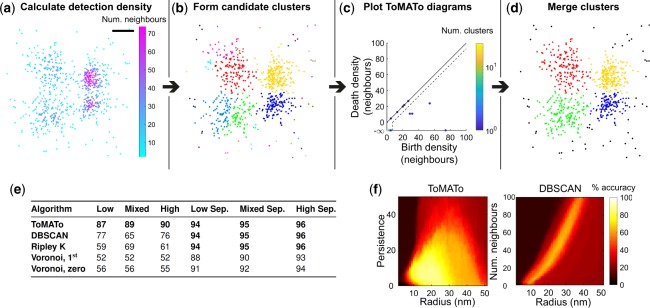
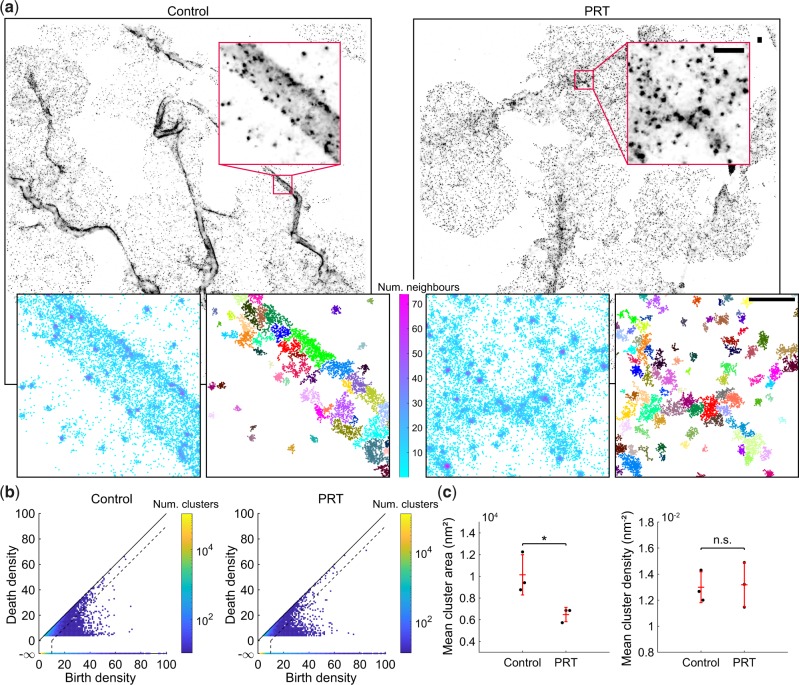
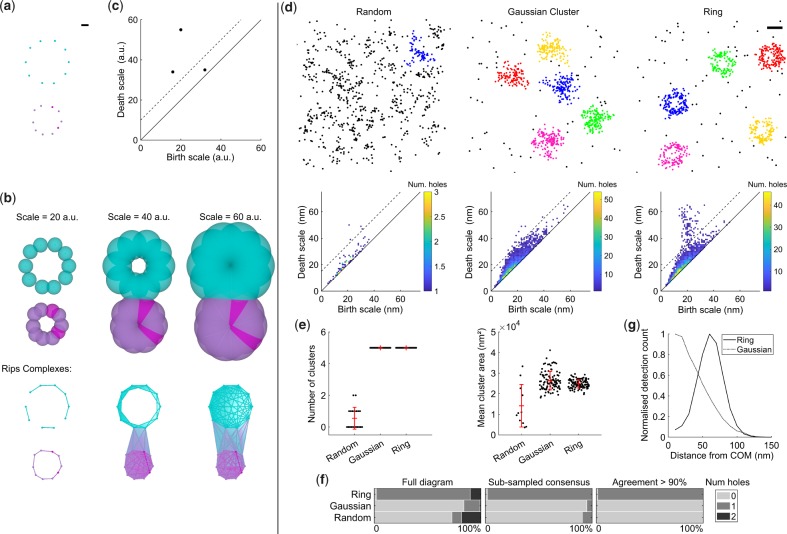
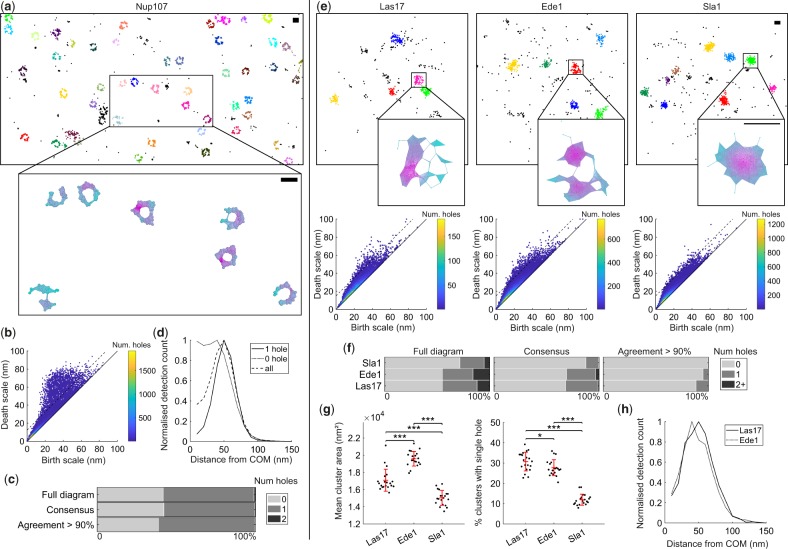
Results: We present a segmentation protocol which, through the application of persistence-based clustering, is capable of probing densely packed structures which vary in scale. An increase in segmentation performance over state-of-the-art methods is demonstrated. Moreover we employ persistent homology to move beyond clustering, and quantify the topological structure within data. This provides new information about the preserved shapes formed by molecular architecture. Our methods are flexible and we demonstrate this by applying them to receptor clustering in platelets, nuclear pore components, endocytic proteins and microtubule networks. Both 2D and 3D implementations are provided within RSMLM, an R package for pointillist-based analysis and batch processing of localization microscopy data.

Availability and implementation: RSMLM has been released under the GNU General Public License v3.0 and is available at https://github.com/JeremyPike/RSMLM. Tutorials for this library implemented as Binder ready Jupyter notebooks are available at https://github.com/JeremyPike/RSMLM-tutorials.

Supplementary information: Supplementary data are available at Bioinformatics online.


Figures

Fig. 1.
Fig. 1.
Persistence-based clustering for SMLM data. (a) 2D dSTORM simulation of four Gaussian clusters in close proximity with unequal variance (mixed density). The first step in the ToMATo algorithm is the calculation of detection density which is estimated by counting the number of neighboring detections within a fixed search radius, here set to the optimal value of 19 nm. Scale-bar 50 nm. (b) Detections are assigned to local maxima in the density estimate using a mode seeking approach. These density modes form candidate clusters. (c) ToMATo diagram showing the birth and death density for each candidate cluster. The birth density corresponds to the maximum detection density within the candidate, and the death density is the level at which the candidate merges to a stronger neighbouring cluster. The difference between the birth and death density defines the persistence of the candidate cluster and is represented on the diagram as the vertical distance from the diagonal. A persistence threshold is chosen below which clusters are merged (dotted line). Here this is set to the optimal value of 6 detections. The highest peak in each connected component resides at death density . The colour bar represents the number of candidate clusters at a specified birth: death density, this is needed if more than more candidate is located at the same position on the diagram. (d) Final ToMATo clustering results after cluster merging. Noise detections, shown in black, are assigned when detections cannot be merged to a cluster above the persistence threshold. (e) Performance of clustering algorithms was quantified as the percentage of correctly assigned detections. Six different scenarios were simulated: low, mixed and high density clusters either in close proximity, or well separated (Sep.). For each scenario twenty simulations were analyzed and the maximal performance (averaged across simulations) for all parameter sets is shown. (f) Performance of ToMATo and DBSCAN across all tested parameters for the mixed density dataset
Fig. 2.
Fig. 2.
Syk inhibition reduces the mean area of integrin α2β1 clusters. (a) Platelets were seeded onto collagen fibres and treated with either the Syk inhibitor PRT060318, or a DMSO control. The sample was immunolabelled for integrin α2β1, secondary labelled with AlexaFluor647 and imaged using dSTORM. Persistence-based clustering (ToMATo) was used to segment integrin α2β1 nano-structures. Representative dSTORM image reconstructions, density estimates and clustering results (noise not shown). The search radius for the calculation of the density estimate and linking graph was set to 20 nm. Scale-bar 500 nm. (b) ToMATo diagrams showing the birth and death density for each candidate cluster. Dotted line shows the chosen persistence threshold for merging of clusters (10 detections). (c) Mean cluster area and cluster density. N = 3, four fields of view per replicate. The entire field of view was analyzed and mean cluster statistics were computed for all clusters in a replicate. Comparisons by two-sample t-test (*P <0.05), error bars are mean ± SD
Fig. 3.
Fig. 3.
Persistent homology for topological analysis of clusters in SMLM datasets. (a) Illustrative example where detections are spaced evenly on the circumference of two circles. Scale-bar 10 arbitrary units (a.u.). (b) Building a filtration. Balls of varying diameter were placed at each detection (top) and the Rips complexes (bottom) were determined by the overlap of these balls. The filtration was evaluated for all integer values between 1 and 60 a.u. Without the filtration, it would be difficult to choose a scale which fully encapsulates the clustering and topology of the data. Simplex colour is set by the detection density estimate and is only for display purposes. (c) The persistence diagram summarizes structure within the filtration. The birth and death scales for each hole are shown. The persistence threshold is shown as a dotted line and there are two significant holes above this threshold. (d) Simulations for randomly distributed molecules, Gaussian clusters and rings with 60 nm radius were segmented using ToMATo. For each cluster a filtration was constructed and the corresponding persistence diagrams are shown. All holes have been grouped into a single persistence diagram per scenario. A persistence threshold of 15 nm was applied to all scenarios (dotted line). Scale-bar 100 nm. (e) Mean number of clusters and cluster area. Error bars are mean ± SD (f) Percentage of clusters with specified number of holes for each scenario. This was calculated using either the full diagram, the sub-sampled consensus, or the sub-sampled consensus with agreement > 90%. (g) Averaged radial distribution for clusters with agreement > 90%. As expected the peak of the profile for the ring simulation lies at 60 nm
Fig. 4.
Fig. 4.
Persistent homology quantifies the topological configuration of biological nano-structures. (a) Topological analysis of Nup107-Snap-AlexaFluor647 imaged using dSTORM. Cropped field of view showing clustering result and example Rips complex evaluated at 50 nm. Scale-bar 100 nm. (b) A threshold of 15 nm was chosen for the persistence diagram (dotted line). (c) Percentage of Nup107 clusters with specified topological configuration. This was calculated using either the full diagram, the sub-sampled consensus, or the sub-sampled consensus with agreement > 90%. (d) Clusters were filtered for consensus agreement > 90% and the averaged radial distribution was plotted for clusters with either one hole, no hole or both. Peak for single hole clusters at 50 nm. (e) Topological analysis of the endocytic proteins Las17, Ede1 and Sla1 in yeast. Cropped fields of view showing clustering results and example Rips complexes evaluated at 30 nm. Persistence threshold was set to 15 nm (dotted lines). (f) Percentage of clusters with specified topological configuration. (g) Mean cluster area and the percentage of clusters with a single hole. Twenty fields of view were analyzed. To assess differences between endocytic proteins a one-way analysis of variance (ANOVA) was performed. If significant (P <0.05) subsequent pair-wise tests between endocytic proteins were performed using the Student’s t-test. P values were corrected for multiple comparisons using the Bonferroni method (*P <0.05, ***P <0.001). Error bars are mean ± SD (h) Averaged radial distributions for all clusters with a single hole and consensus agreement > 90%. Peak at 50 and 40 nm for Las17 and Ede1 respectively

References

    1. Adams H. et al. (2014) JavaPlex: a research software package for persistent (co) homology In: International Congress on Mathematical Software. pp. 129–136. Springer.
    1. Andronov L. et al. (2016) ClusterViSu, a method for clustering of protein complexes by Voronoi tessellation in super-resolution microscopy. Sci. Rep., 6, 24084.. - PMC - PubMed
    1. Beckerle M.C. et al. (1989) Activation-dependent redistribution of the adhesion plaque protein, talin, in intact human platelets. J. Cell Biol., 109, 3333–3346. - PMC - PubMed
    1. Beghin A. et al. (2017) Localization-based super-resolution imaging meets high-content screening. Nat. Methods, 14, 1184.. - PubMed
    1. Berthold M.R. et al. (2009) KNIME-the Konstanz information miner: version 2.0 and beyond. ACM SIGKDD Explorations Newslett., 11, 26–31.

Publication types