. 2020 Jan 1;173(1):114-130.
doi: 10.1093/toxsci/kfz219.

Transcriptional Profiling of the Murine Airway Response to Acute Ozone Exposure

Affiliations

Transcriptional Profiling of the Murine Airway Response to Acute Ozone Exposure

Adelaide Tovar et al. Toxicol Sci. .

Abstract

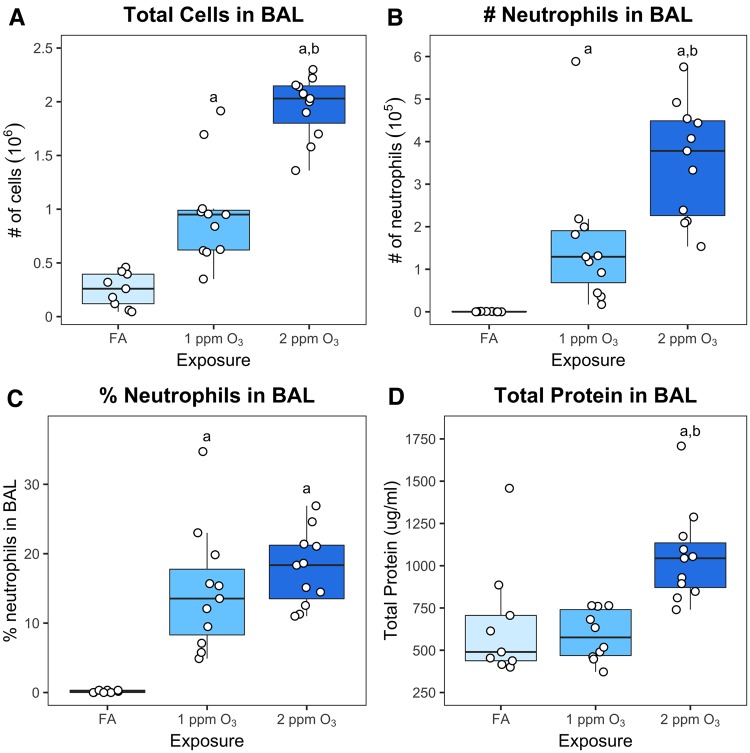
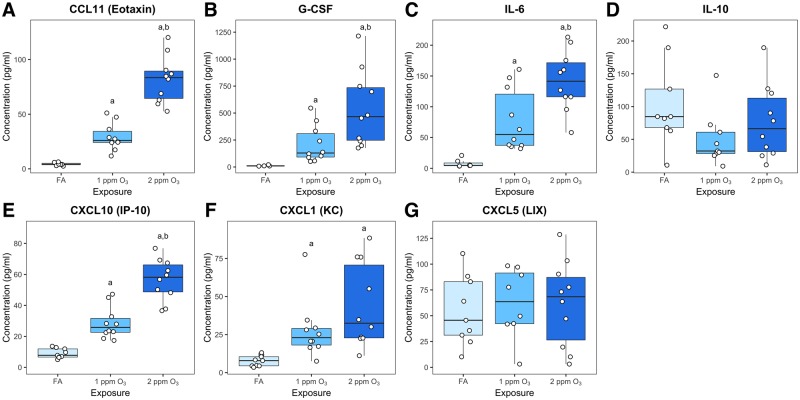
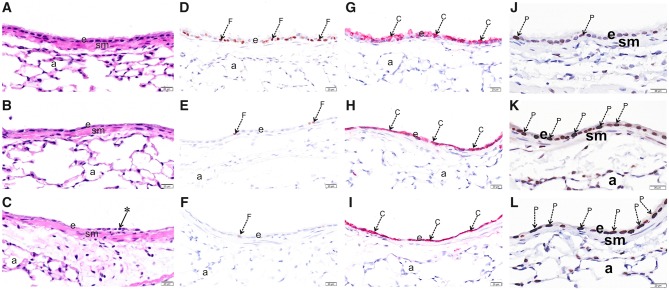
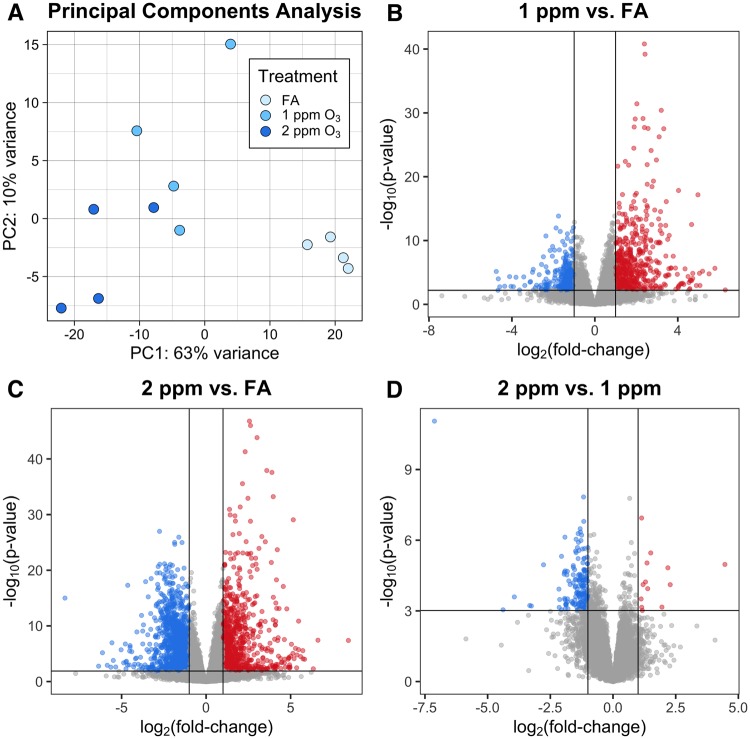
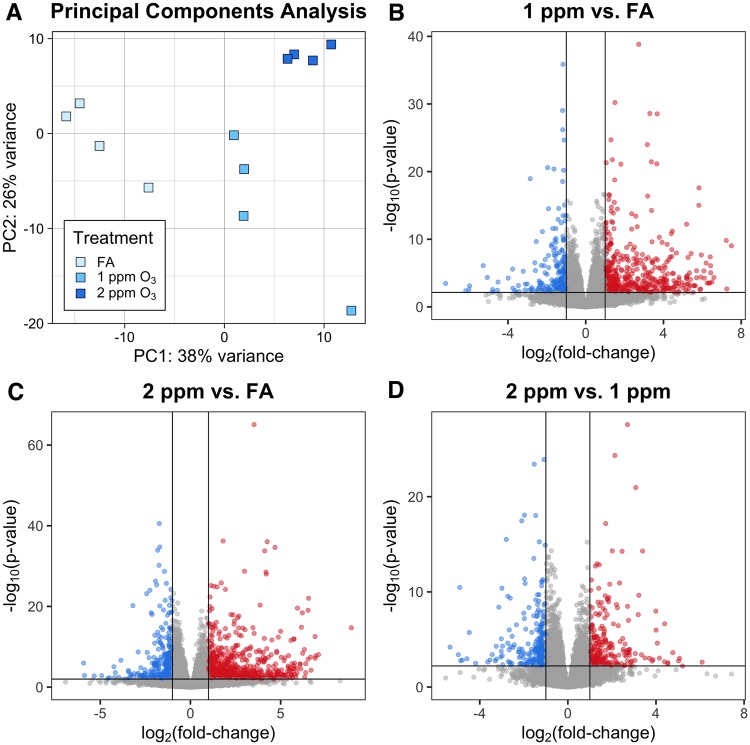
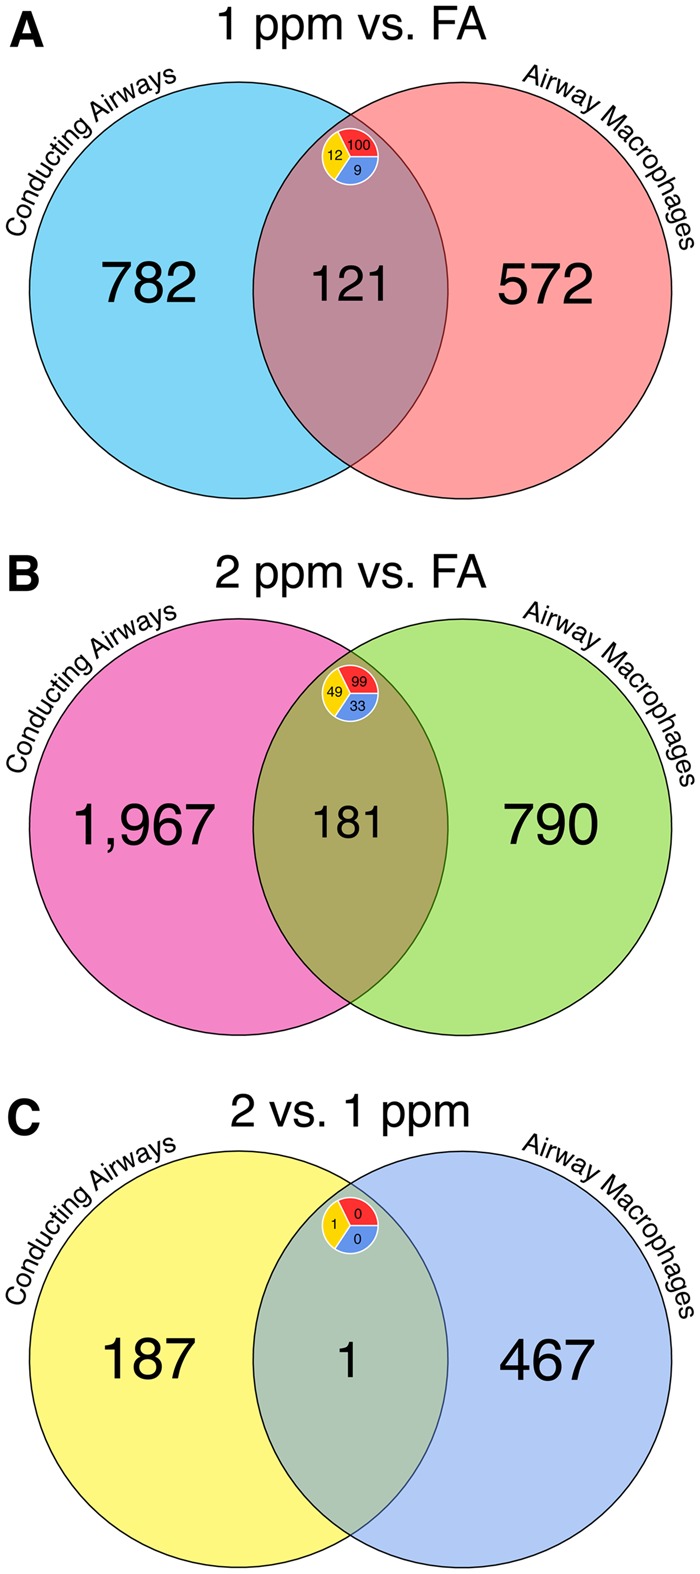
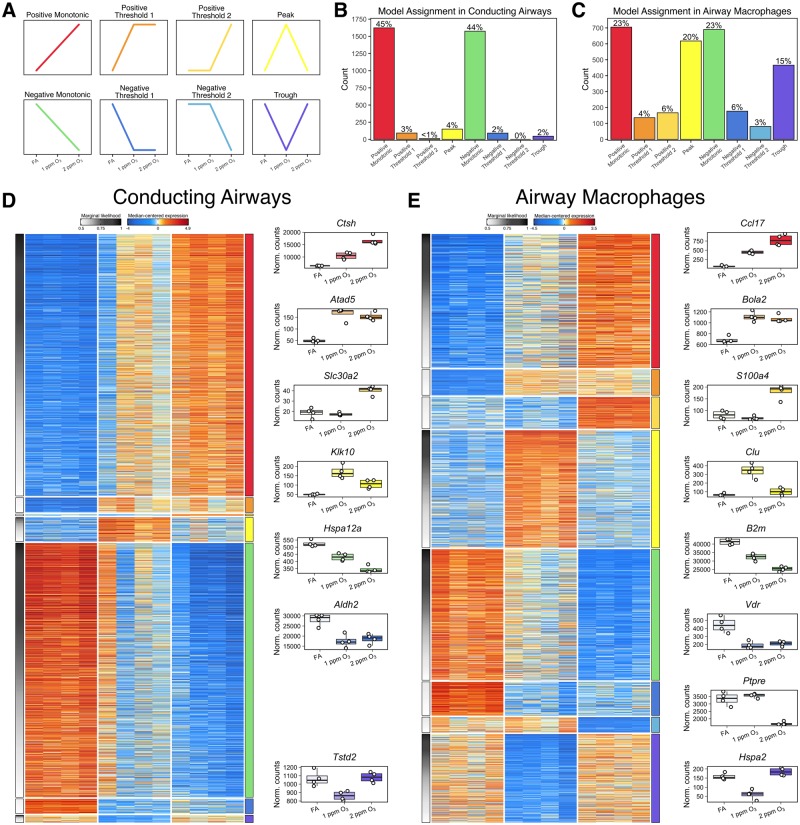
Ambient ozone (O3) exposure has serious consequences on respiratory health, including airway inflammation and injury. Decades of research have yielded thorough descriptions of these outcomes; however, less is known about the molecular processes that drive them. The aim of this study was to further describe the cellular and molecular responses to O3 exposure in murine airways, with a particular focus on transcriptional responses in 2 critical pulmonary tissue compartments: conducting airways (CA) and airway macrophages (AM). After exposing adult, female C57BL/6J mice to filtered air, 1 or 2 ppm O3, we assessed hallmark responses including airway inflammation (cell counts and cytokine secretion) and injury (epithelial permeability), followed by gene expression profiling of CA and AM by RNA-seq. As expected, we observed concentration-dependent increases in airway inflammation and injury. Conducting airways and AM both exhibited changes in gene expression to both 1 and 2 ppm O3 that were largely compartment-specific. In CA, genes associated with epithelial barrier function, detoxification processes, and cellular proliferation were altered, while O3 affected genes involved in innate immune signaling, cytokine production, and extracellular matrix remodeling in AM. Further, CA and AM also exhibited notable differences in concentration-response expression patterns for large numbers of genes. Overall, our study has described transcriptional responses to acute O3 exposure, revealing both shared and unique gene expression patterns across multiple concentrations of O3 and in 2 important O3-responsive tissues. These profiles provide broad mechanistic insight into pulmonary O3 toxicity, and reveal a variety of targets for focused follow-up studies.

Keywords: air pollution; inflammation; injury; lung; mouse; ozone; transcriptomics.


Figures

Figure 1.
Figure 1.
O3 exposure induces inflammation and injury in C57BL/6J mice. Eleven-week-old female C57BL/6J mice were exposed to filtered air (FA), 1 or 2 ppm O3 for 3 h, sacrificed 21 h subsequently, and cell types, cell numbers, and total protein concentration were measured in bronchoalveolar lavage fluid. (A) Total cell number (106), (B) neutrophil number (105), and (C) % neutrophils were measured by differential cell counting. (D) Total protein in BAL was measured using a fluorometric Qubit assay. Results are displayed as box-and-whisker plots depicting the distribution of the data as the minimum, first quartile, median, third quartile, and maximum with all points overlaid (n = 11 for 1 and 2 ppm O3 exposure, n = 9 for FA exposure); a: p < 0.05 compared to FA group, b: p < 0.05 compared to 1 ppm group.
Figure 2.
Figure 2.
Ozone induced changes in cytokine and chemokine concentrations in BAL. A multiplex cytokine detection assay was used to measure the concentration of (A) CCL11 (eotaxin), (B) G-CSF, (C) IL-6, (D), IL-10, (E) CXCL10 (IP-10), (F) CXCL1 (KC), and (G) CXCL5 (LIX) in BAL fluid. Results are displayed as box-and-whisker plots depicting the distribution of the data as the minimum, first quartile, median, third quartile, and maximum with all points overlaid (n = 10 for 1 and 2 ppm O3 exposure, n = 9 for FA exposure, and points below limited of detection were excluded from analysis); a: p < 0.05 compared to FA group, b: p < 0.05 compared to 1 ppm group.
Figure 3.
Figure 3.
O3 exposure causes epithelial damage in the upper airways. Light photomicrographs of the respiratory epithelium lining the axial airway of the left lung lobe from mice exposed to 0 (A,D,G,J), 1 (B,E,H,K) or 2 ppm (C,F,I,L) ozone. Tissues were histochemically stained with hematoxylin and eosin (A, B, C) or immunohistochemically stained for (D, E, F) FOXJ1, (G, H, I) club cell secretory protein (CCSP), or (J, K, L) proliferating cell nuclear antigen (PCNA). Abbreviations: a, alveolar parenchyma; arrow *, exfoliating epithelium; arrow C (red chromogen), CCSP; arrow F (brown chromogen), FOXJ1; arrow P (brown chromogen), PCNA; e, respiratory epithelium; sm, airway smooth muscle.
Figure 4.
Figure 4.
O3 exposure induces altered gene expression in conducting airways (CA). Gene expression of CA tissue from mice exposed to FA, 1 or 2 ppm O3. (A) Principal components analysis shows separation of the 3 treatment groups. Differential expression analysis revealed (B) 903 DEGs in 1 ppm versus FA, (C) 2148 DEGs in 2 ppm versus FA, and (D) 188 DEGs in 2 ppm versus FA (n = 4 per treatment group, fold-change cutoff = 2, Benjamini–Hochberg adjusted p-value < 0.05).
Figure 5.
Figure 5.
Airway macrophage (AM) gene expression is altered by O3 exposure. Gene expression in pooled AM from mice exposed to FA, 1 or 2 ppm O3. (A) Principal components analysis displays separation of AMs across all 3 treatment groups. Differential expression analysis revealed (B) 693 DEGs in 1 ppm versus FA, (C) 971 DEGs in 2 ppm versus FA, and (D) 467 DEGs in 2 versus 1 ppm (n = 4 pools per treatment group, fold-change cutoff = 2, Benjamini–Hochberg adjusted p-value < 0.05).
Figure 6.
Figure 6.
Comparison of differential gene expression results shows shared and unique responses to O3 across tissue compartments. Venn diagrams comparing lists of differentially expressed (DE) genes in conducting airway tissue and airway macrophages from (A) the 1 ppm versus FA comparison, (B) the 2 ppm versus FA comparison, and (C) the 2 versus 1 ppm comparison. Labels display the number of genes within a set. Inset circles display the number of upregulated (red top right), down regulated (blue bottom right), or genes with contrasting expression patterns (yellow left) within an intersecting set.
Figure 7.
Figure 7.
Concentration-response patterns of gene expression in conducting airways and airway macrophages. A subset of genes in both conducting airways and airway macrophages were probabilistically assigned into 1 of 8 distinct expression patterns. Schematic graphs of each category are displayed in panel A, and their order and the color assigned to each pattern is consistent throughout the figure. The frequency of genes assigned into each trend category with a marginal likelihood greater than 0.5 within (B) conducting airways and (C) airway macrophages. Heatmaps depict median-centered expression of categorized gene from (D) conducting airways and (E) airway macrophages, arranged by expression pattern. Boxplots of genes exemplifying each pattern are arranged to the right of each heatmap.

References

    1. Akinbami L. J., Lynch C. D., Parker J. D., Woodruff T. J. (2010). The association between childhood asthma prevalence and monitored air pollutants in metropolitan areas, united states, 2001-2004. Environ. Res. 110, 294–301. - PubMed
    1. Anenberg S. C., Henze Daven K., Tinney V., Kinney P. L., Raich W., Fann N., Malley C. S., Roman H., Lamsal L., Duncan B., et al. (2018). Estimates of the global burden of ambient pm2.5, ozone, and no2 on asthma incidence and emergency room visits. Environ. Health Perspect. 126, 107004.. - PMC - PubMed
    1. Aris R. M., Christian D., Hearne P. Q., Kerr K., Finkbeiner W. E., Balmes J. R. (1993). Ozone-induced airway inflammation in human subjects as determined by airway lavage and biopsy. Am. Rev. Respir. Dis. 148, 1363–1372. - PubMed
    1. Arredouani M. S., Franco F., Imrich A., Fedulov A., Lu X., Perkins D., Soininen R., Tryggvason K., Shapiro S. D., Kobzik L. (2007). Scavenger receptors SR-AI/II and MARCO limit pulmonary dendritic cell migration and allergic airway inflammation. J. Immunol. 178, 5912–5920. - PubMed
    1. Backus G. S., Howden R., Fostel J., Bauer A. K., Cho H. Y., Marzec J., Peden D. B., Kleeberger S. R. (2010). Protective role of interleukin-10 in ozone-induced pulmonary inflammation. Environ. Health Perspect. 118, 1721–1727. - PMC - PubMed

Publication types