. 2019 Oct 17;11(20):9025-9042.
doi: 10.18632/aging.102368. Epub 2019 Oct 17.

Differentially expressed autophagy-related genes are potential prognostic and diagnostic biomarkers in clear-cell renal cell carcinoma

Affiliations

Differentially expressed autophagy-related genes are potential prognostic and diagnostic biomarkers in clear-cell renal cell carcinoma

Bangbei Wan et al. Aging (Albany NY). .

Abstract

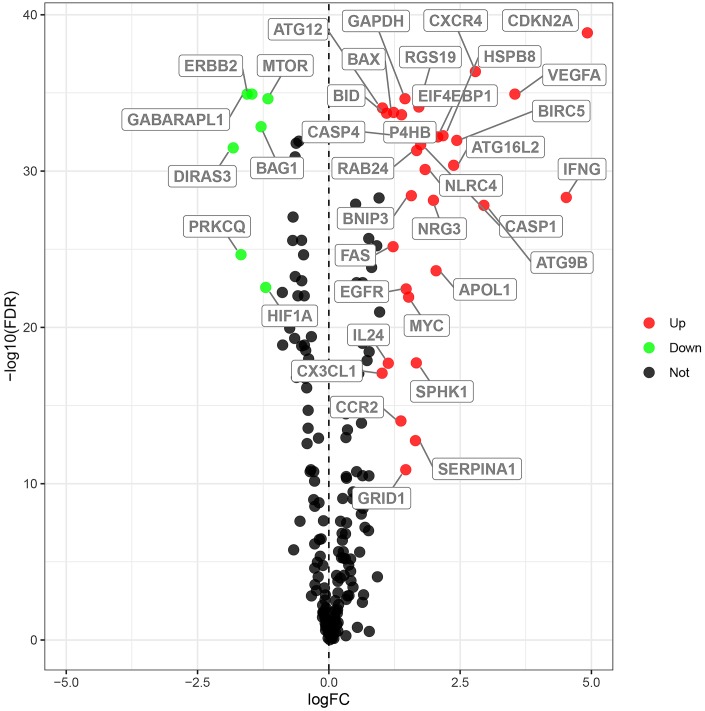
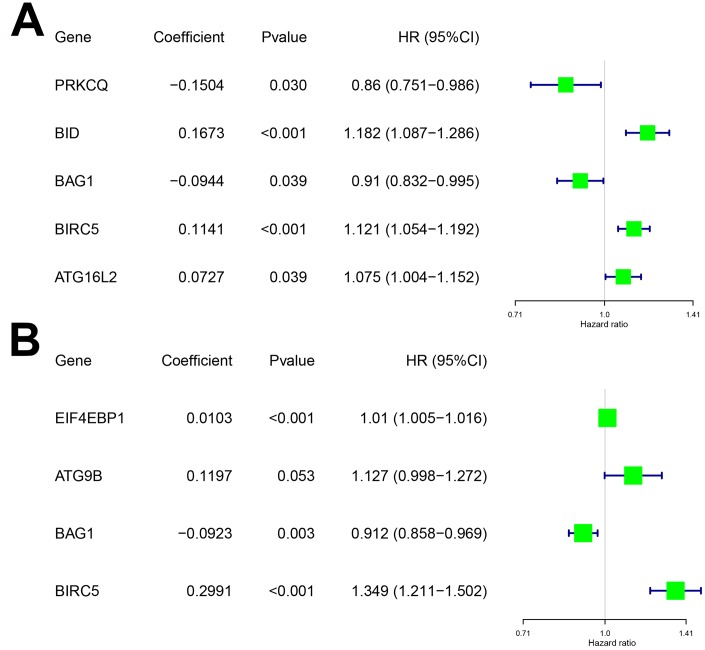
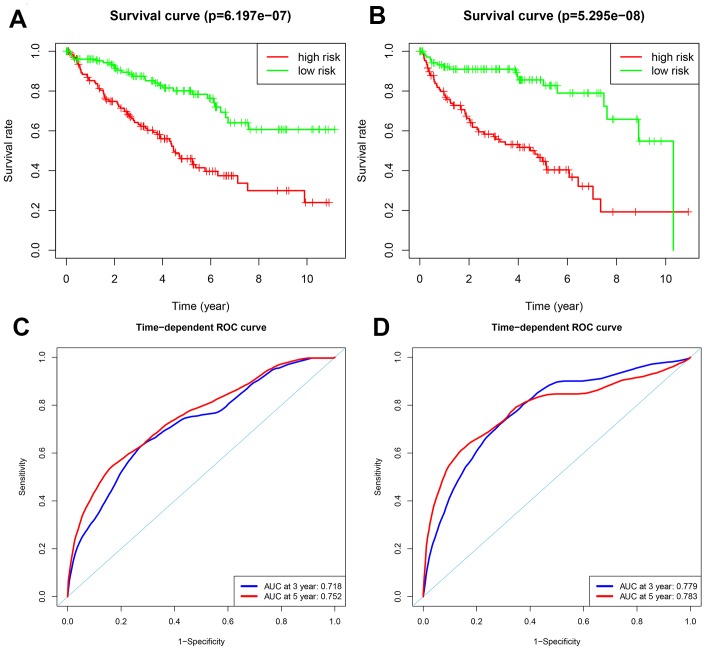
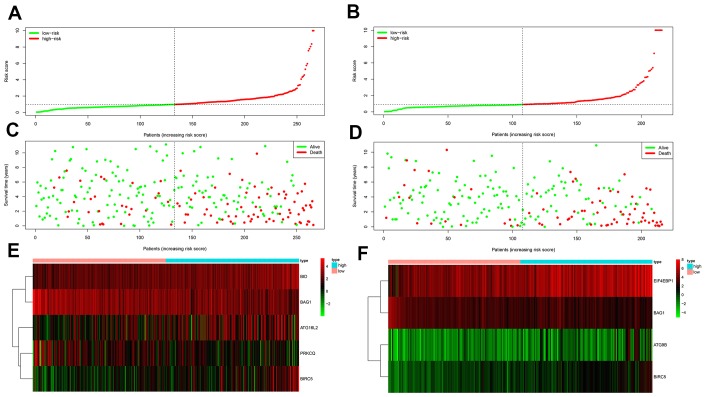
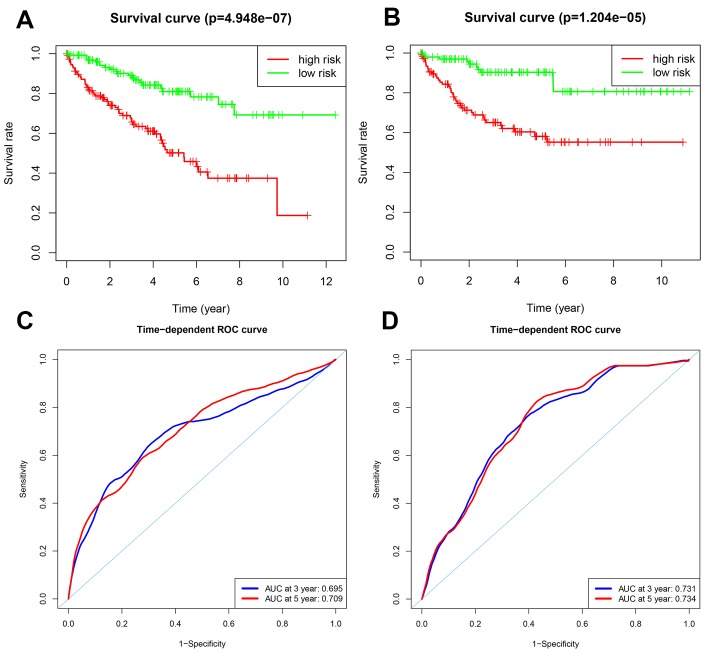
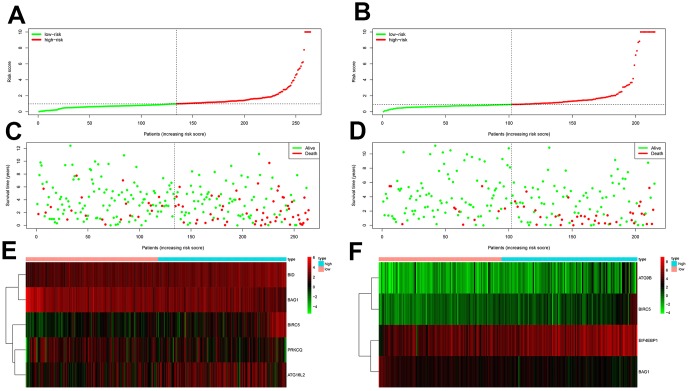
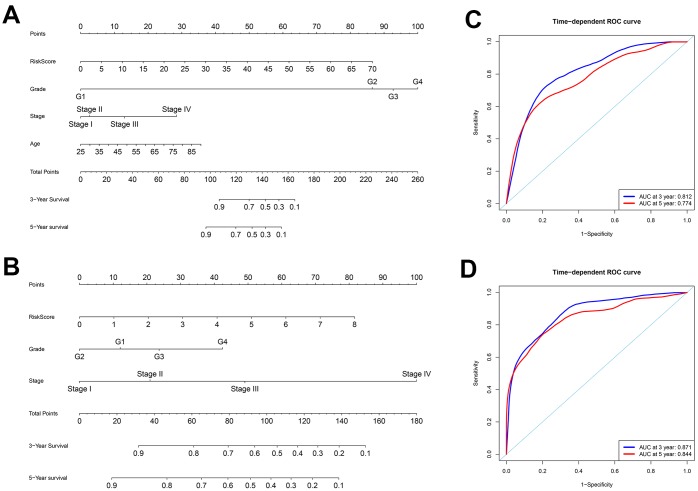
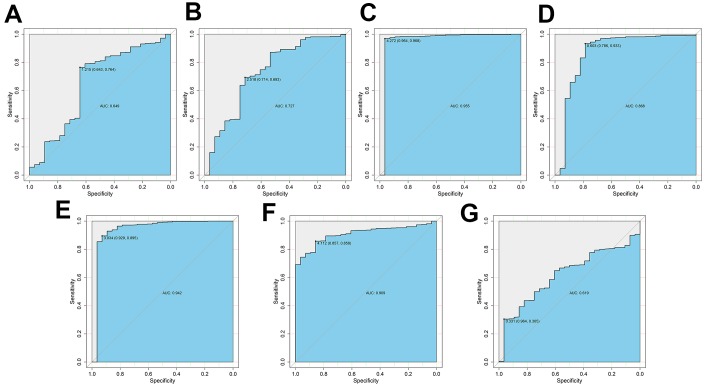
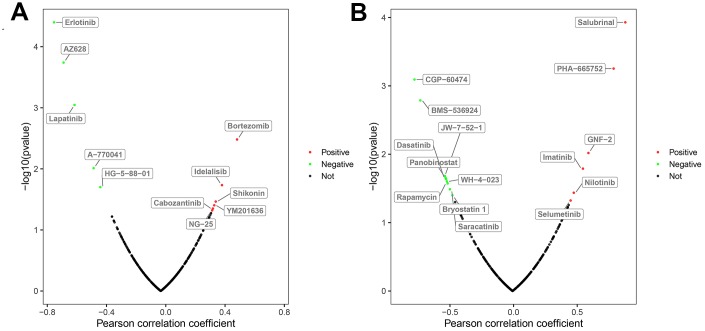
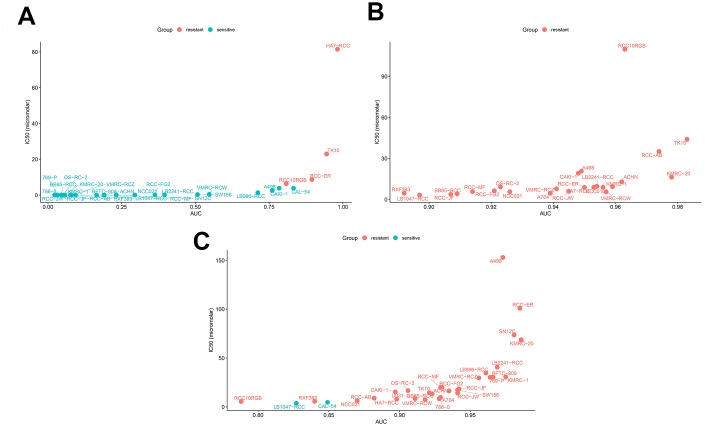
We examined the role of differentially expressed autophagy-related genes (DEARGs) in clear cell Renal Cell Carcinoma (ccRCC) using high-throughput RNA-seq data from The Cancer Genome Atlas (TCGA). Cox regression analyses showed that 5 DEARGs (PRKCQ, BID, BAG1, BIRC5, and ATG16L2) correlated with overall survival (OS) and 4 DEARGs (EIF4EBP1, BAG1, ATG9B, and BIRC5) correlated with disease-free survival (DFS) in ccRCC patients. Multivariate Cox regression analysis using the OS and DFS prognostic risk models showed that expression of the nine DEARGs accurately and independently predicted the risk of disease recurrence or progression in ccRCC patients (area under curve or AUC values > 0.70; all p < 0.05). Moreover, the DEARGs accurately distinguished healthy individuals from ccRCC patients based on receiver operated characteristic (ROC) analyses (area under curve or AUC values > 0.60), suggesting their potential as diagnostic biomarkers for ccRCC. The expression of DEARGs also correlated with the drug sensitivity of ccRCC cell lines. The ccRCC cell lines were significantly sensitive to Sepantronium bromide, a drug that targets BIRC5. This makes BIRC5 a potential therapeutic target for ccRCC. Our study thus demonstrates that DEARGs are potential diagnostic and prognostic biomarkers and therapeutic targets in ccRCC.

Keywords: TCGA database; autophagy; autophagy-related genes; ccRCC; prognosis.


Conflict of interest statement

CONFLICTS OF INTEREST: The authors declare that they had no conflicts of interests.

Figures

Figure 1
Figure 1
Differential expression of autophagy-related genes in ccRCC tissue samples. The differential expression of 238 autophagy related genes (ARGs) in ccRCC tissue samples (n=539) compared with normal healthy kidney samples (n=72) is shown in the –log (FDR) vs. log (FC) plot. The red dots represent 31 upregulated DEARGs, the green dots represent 7 downregulated DEARGs, and the remaining black dots represent ARGs that are not differentially expressed in ccRCC tissue samples.
Figure 2
Figure 2
Characteristics of risk DEARGs in the prognostic risk models. Regression coefficients and hazard ratios of the risk DEARGs for the (A) Overall survival (OS) and (B) Disease-Free Survival (DFS) models are shown.
Figure 3
Figure 3
Analysis of OS and DFS prognostic risk models in training group ccRCC patients. (A) Kaplan-Meier survival curve analysis of OS in the high-risk (red line) and low-risk (green line) ccRCC patients in the training group. (B) Kaplan-Meier survival curve analysis of disease-free survival (DFS) in the high-risk (red line) and low-risk (green line) ccRCC patients. (C) Time-dependent ROC curves show area under curve (AUC) values at 3-year (blue) and 5-year (red) OS in the training group ccRCC patients. (D) Time-dependent ROC curves show AUC values at 3-year (blue) and 5-year (red) DFS in the training group ccRCC patients.
Figure 4
Figure 4
Prognosis of high-risk and low-risk training group ccRCC patients. (A) Risk score distribution of high-risk (red) and low-risk (green) ccRCC patients in the OS model. (B) Risk score distribution of high-risk (red) and low-risk (green) ccRCC patients in the DFS model. (C) Scatter plot shows the survival status of ccRCC patients in the OS model. Red dots denote patients that are dead and green dots denote patients that are alive. (D) Scatter plot shows survival status of ccRCC patients in the DFS model. Red dots denote patients that are dead and green dots denote patients that are alive. (E) Expression of risk genes in the high-risk (blue) and low-risk (pink) training group ccRCC patients in the OS model. (F) Expression of risk genes in the high-risk (blue) and low-risk (green) training group ccRCC patients in the DFS model. The color code for gene expression in E and F shows green denoting lowest expression and red denoting highest expression
Figure 5
Figure 5
Validation of the OS and DFS prognostic risk models in the testing group ccRCC patients. (A) Kaplan-Meier survival curve analysis of OS in the high-risk (red line) and low-risk (green line) ccRCC patients in the testing group. (B) Kaplan-Meier survival curve analysis of DFS in the high-risk (red line) and low-risk (green line) ccRCC patients in the testing group. (C) Time-dependent ROC curve analyses shows AUC values for 3-year (blue) and 5-year (red) OS in the testing group ccRCC patients. (D) Time-dependent ROC curve analyses shows AUC values for 3-year (blue) and 5-year (red) DFS in the testing group ccRCC patients.
Figure 6
Figure 6
Prognostic analyses of high-risk and low-risk ccRCC patients in the testing group. (A) Risk score distribution of high risk (red) and low-risk (green) ccRCC patients from the testing group using the OS model. (B) Risk score distribution of high risk (red) and low-risk (green) ccRCC patients from the testing group using the DFS model. (C) Scatter plots show survival status of testing group ccRCC patients using the OS model. (D) Scatter plots show survival status plots of testing group ccRCC patients using the DFS model. (E) Expression of risk genes in the high-risk (blue) and low-risk (pink) testing group ccRCC patients in the OS model. (F) Expression of risk genes in the high-risk (blue) and low-risk (pink) testing group ccRCC patients in the DFS model. The color code for gene expression in E and F shows green denoting lowest expression and red denoting highest expression.
Figure 7
Figure 7
Construction of nomograms and ROC curve analysis of prognosis for ccRCC patients from the TCGA database. (AB) The nomograms for (A) OS and (B) DFS are shown. (CD) ROC curve analysis shows 3-year (blue) and 5-year (red) OS and the corresponding AUC values for the ccRCC patients from the TCGA database. (D) ROC curve analysis shows 3-year (blue) and 5-year (red) DFS and the corresponding AUC values for the ccRCC patients from the TCGA database.
Figure 8
Figure 8
ROC curve analysis to determine potential diagnostic value of the risk DEARGs in ccRCC. The ROC curve plots for (A) PRKCQ (AUC = 0.649), (B) BID (AUC = 0.727), (C) BAG1 (AUC = 0.955), (D) BIRC5 (AUC = 0.868), (E) ATG16L2 (AUC = 0.942), (F) EIF4EBP1 (AUC = 0.909), and (G) ATG9B (AUC = 0.619) genes in ccRCC are shown.
Figure 9
Figure 9
Correlation between the expression status of risk DEARGs and drug sensitivity of ccRCC cell lines. The plot shows the correlation between the expression status of (A) BAG1 and (B) BIRC5 genes relative to the sensitivity of several ccRCC cell lines to various drugs. The green dots represent drugs that negatively correlate with the expression of the risk genes (p < 0.05) based on their IC50 values; red dots indicate positive correlation of the corresponding drugs with the expression of risk genes (p < 0.05) based on their IC50 values; and black dots represent drugs that do not show any significant correlation based on their IC50 values with the expression of risk genes (p > 0.05).
Figure 10
Figure 10
Drug sensitivity analyses of ccRCC cell lines. The AUC versus IC50 plots show sensitivity of several ccRCC cell lines to treatment with (A) Sepantronium bromide, (B) Axitinib, and (C) Cabozantinib. The cell lines with IC50 values that are greater than the maximum screening concentrations used for the targeted drugs are considered to be resistant to the corresponding drugs. The green dots denote drug-sensitive ccRCC cell lines and red dots denote drug-resistant ccRCC cell lines. IC50 =half maximal inhibitory concentration; AUC: Area under the dose-response curve.

References

    1. Siegel RL, Miller KD, Jemal A. Cancer statistics, 2019. CA Cancer J Clin. 2019; 69:7–34. 10.3322/caac.21551 - DOI - PubMed
    1. Miller KD, Nogueira L, Mariotto AB, Rowland JH, Yabroff KR, Alfano CM, Jemal A, Kramer JL, Siegel RL. Cancer treatment and survivorship statistics, 2019. CA Cancer J Clin. 2019; 69:363–385. 10.3322/caac.21565 - DOI - PubMed
    1. Chen VJ, Hernandez-Meza G, Agrawal P, Zhang CA, Xie L, Gong CL, Hoerner CR, Srinivas S, Oermann EK, Fan AC. Time on Therapy for at Least Three Months Correlates with Overall Survival in Metastatic Renal Cell Carcinoma. Cancers (Basel). 2019; 11. 10.3390/cancers11071000 - DOI - PMC - PubMed
    1. Dikic I, Johansen T, Kirkin V. Selective autophagy in cancer development and therapy. Cancer Res. 2010; 70:3431–4. 10.1158/0008-5472.CAN-09-4027 - DOI - PubMed
    1. Macintosh RL, Ryan KM. Autophagy in tumour cell death. Semin Cancer Biol. 2013; 23:344–51. 10.1016/j.semcancer.2013.05.006 - DOI - PubMed

Publication types

Substances