. 2019 Oct 17;179(3):687-702.e18.
doi: 10.1016/j.cell.2019.09.029.

Generation of Blastocyst-like Structures from Mouse Embryonic and Adult Cell Cultures

Affiliations

Generation of Blastocyst-like Structures from Mouse Embryonic and Adult Cell Cultures

Ronghui Li et al. Cell. .

Abstract

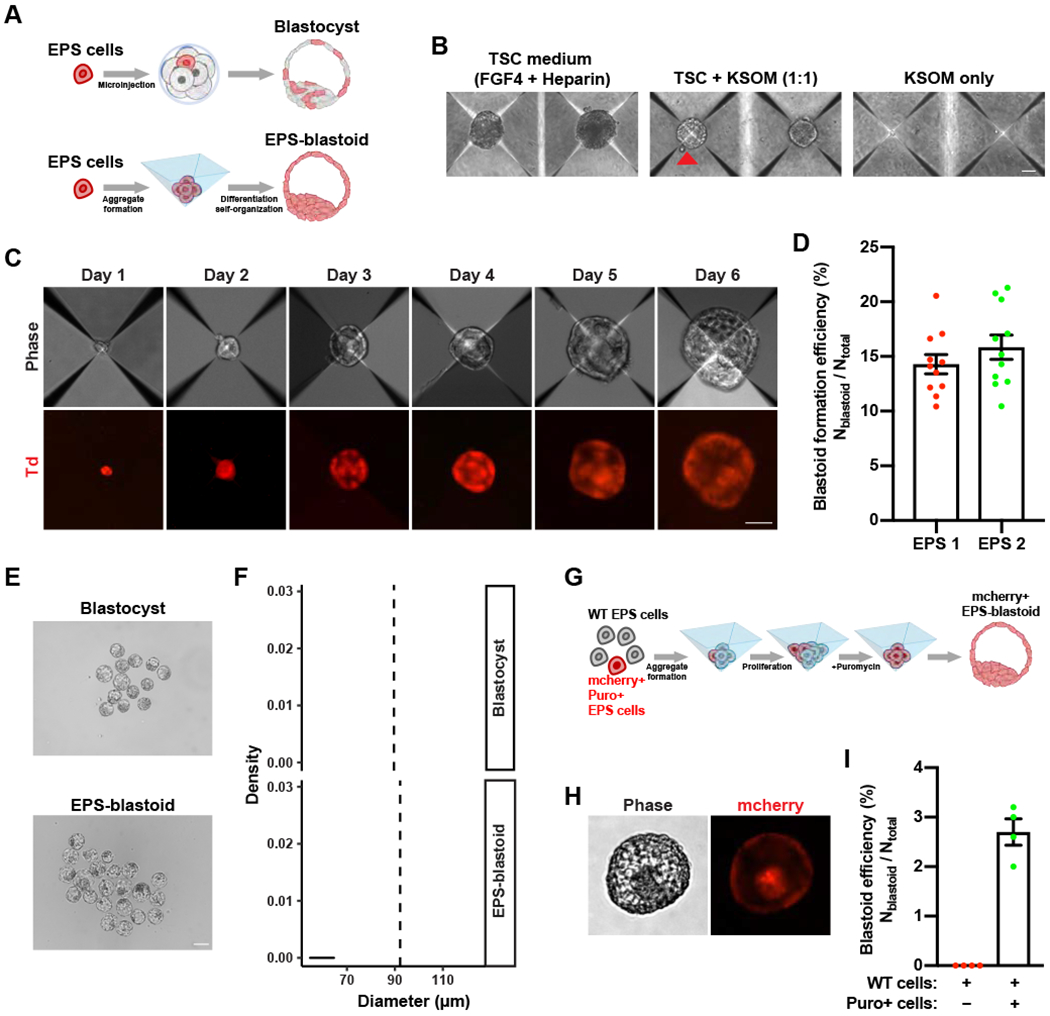
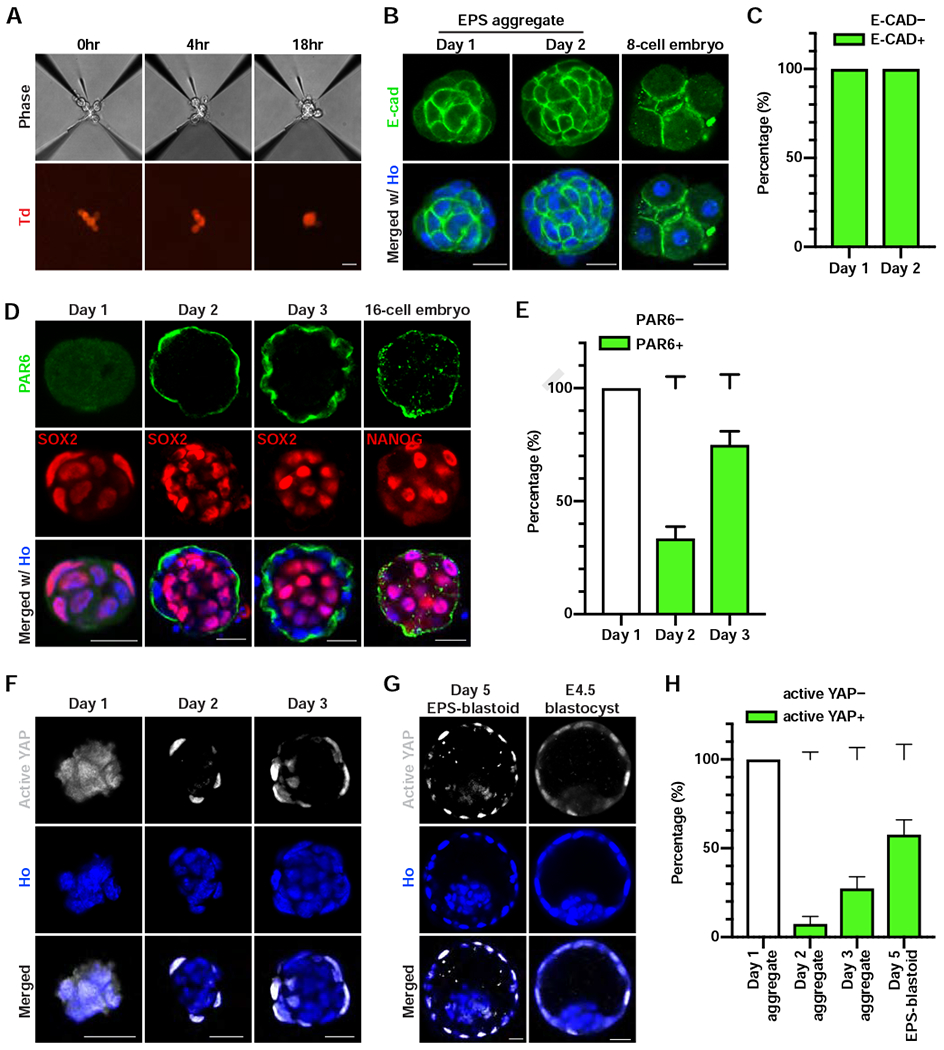
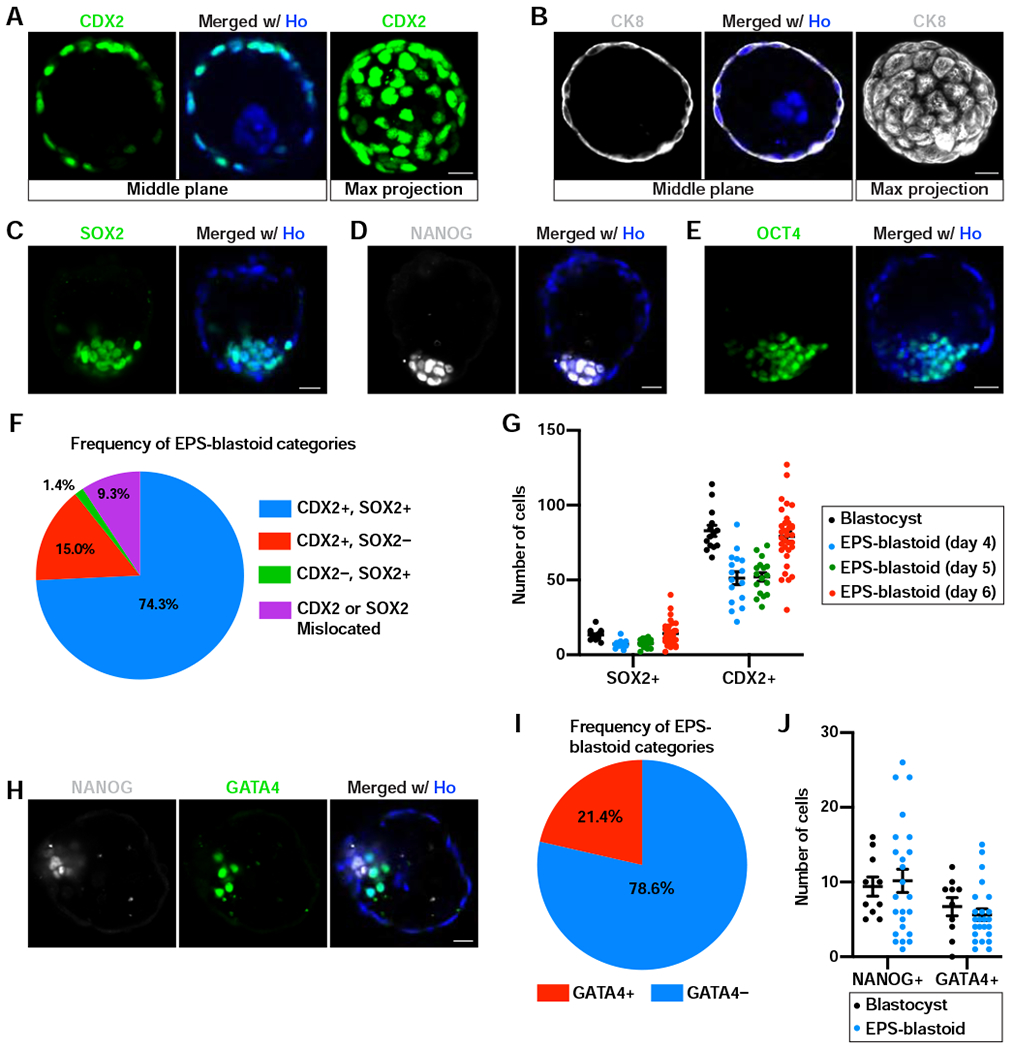
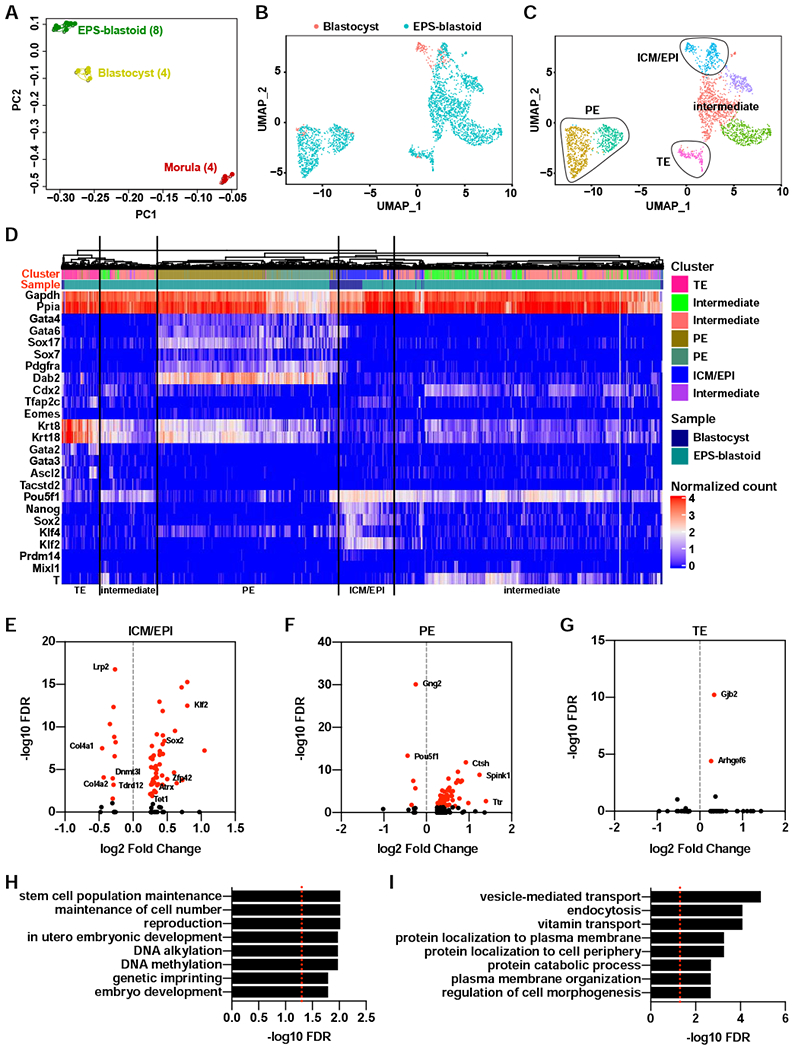
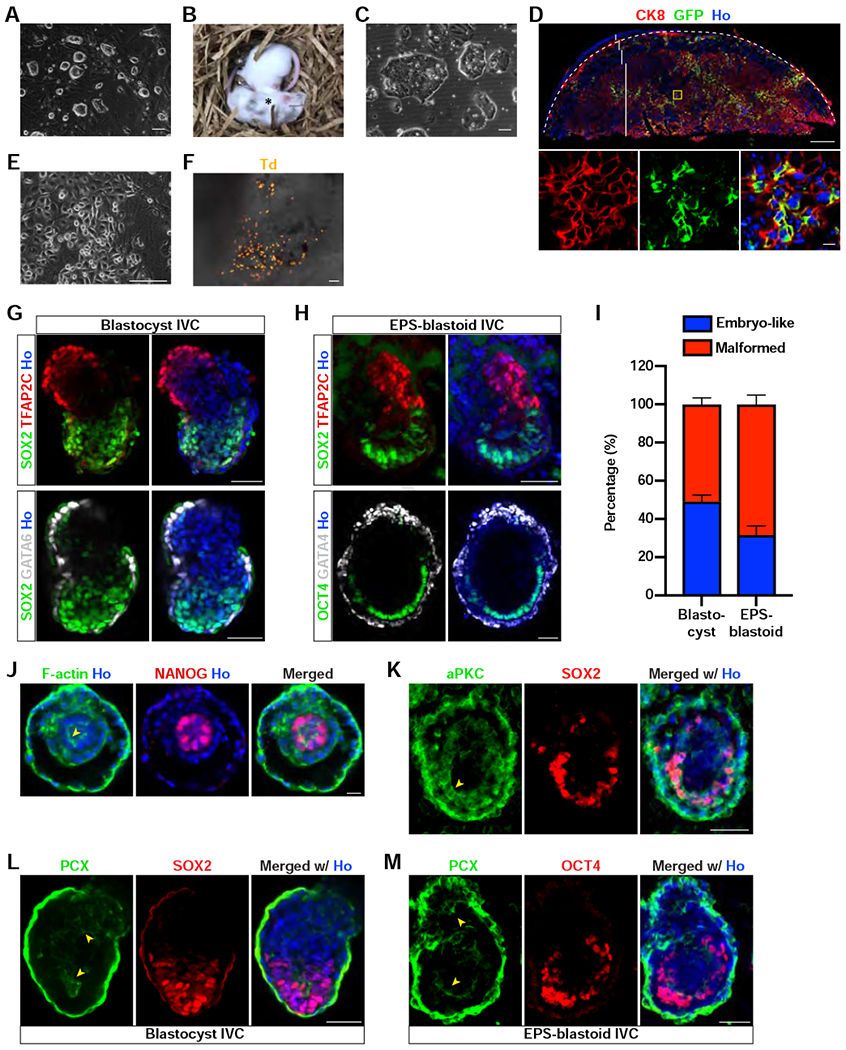
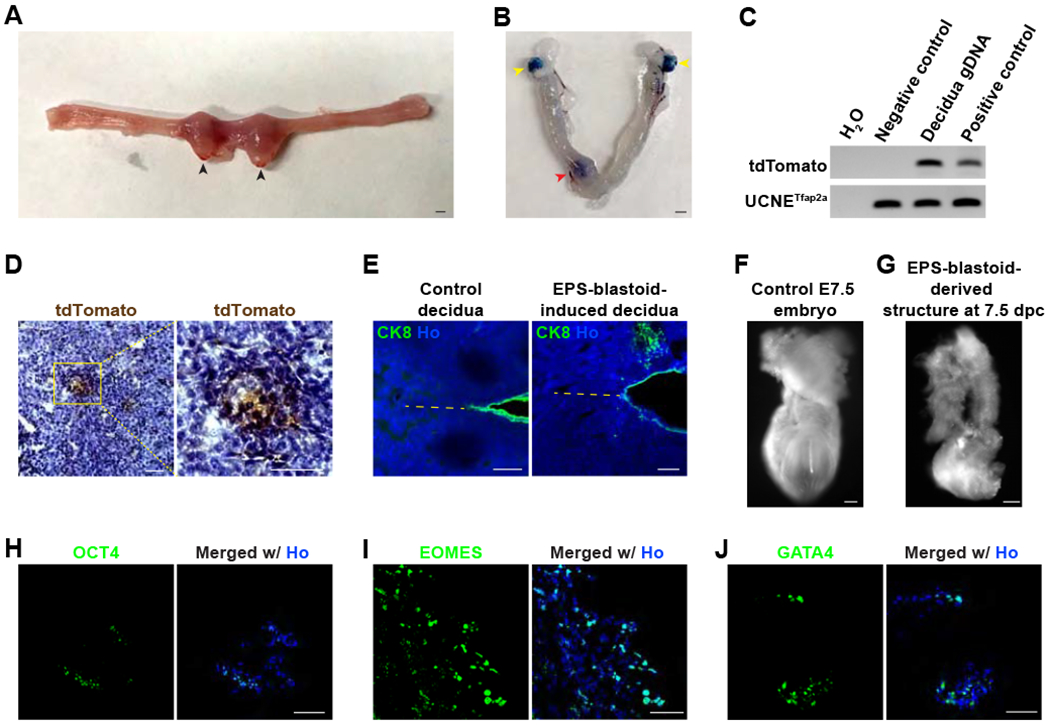
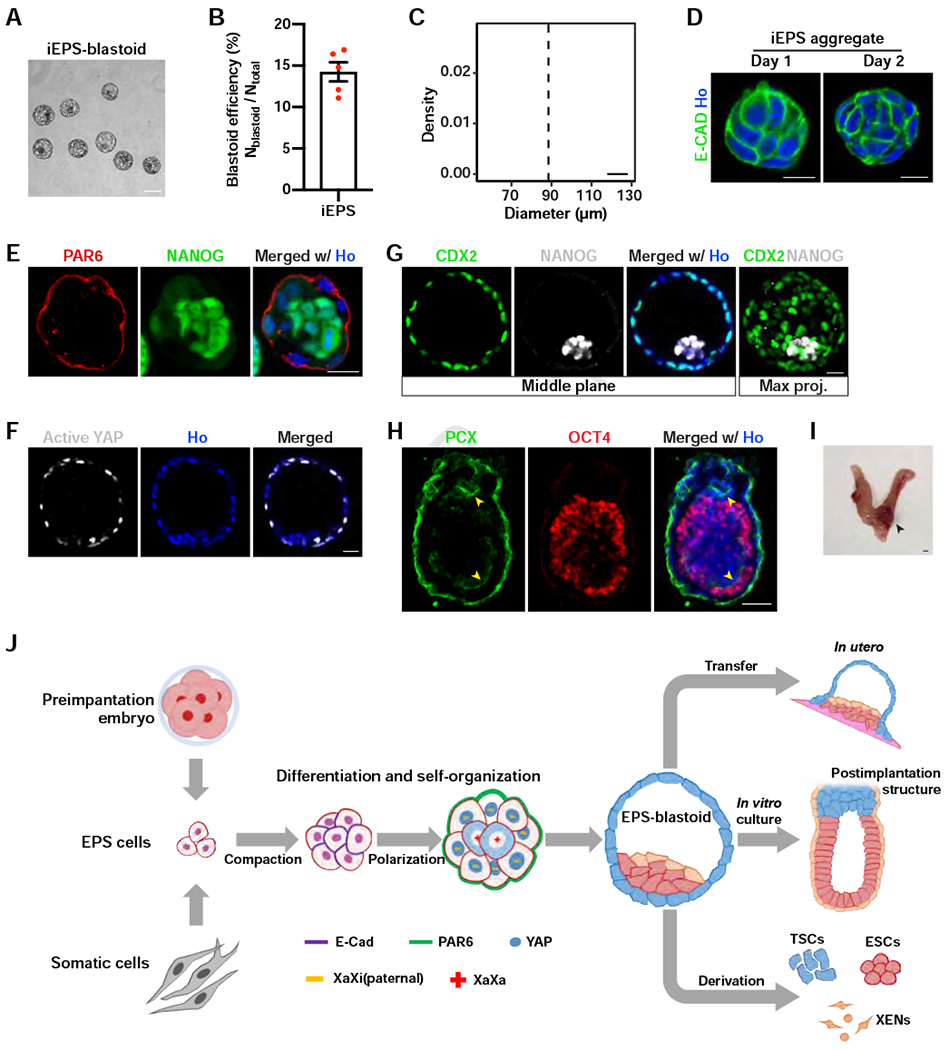
A single mouse blastomere from an embryo until the 8-cell stage can generate an entire blastocyst. Whether laboratory-cultured cells retain a similar generative capacity remains unknown. Starting from a single stem cell type, extended pluripotent stem (EPS) cells, we established a 3D differentiation system that enabled the generation of blastocyst-like structures (EPS-blastoids) through lineage segregation and self-organization. EPS-blastoids resembled blastocysts in morphology and cell-lineage allocation and recapitulated key morphogenetic events during preimplantation and early postimplantation development in vitro. Upon transfer, some EPS-blastoids underwent implantation, induced decidualization, and generated live, albeit disorganized, tissues in utero. Single-cell and bulk RNA-sequencing analysis revealed that EPS-blastoids contained all three blastocyst cell lineages and shared transcriptional similarity with natural blastocysts. We also provide proof of concept that EPS-blastoids can be generated from adult cells via cellular reprogramming. EPS-blastoids provide a unique platform for studying early embryogenesis and pave the way to creating viable synthetic embryos by using cultured cells.

Keywords: EPS cells; EPS-blastoid; blastocyst; blastoids; extended pluripotent stem cells; implantation; reprogramming; totipotent.


Conflict of interest statement

DECLARATION OF INTERESTS

None

Figures

Figure 1.
Figure 1.. A 3D Differentiation System for Generating Blastocyst-like Structures from EPS Cells
(A) Top panel: A diagram showing that a single EPS cell can contribute to both embryonic (Em) and extraembryonic (ExEm) lineages in the blastocyst after injection into an 8-cell embryo. Bottom panel: A diagram showing that EPS cells differentiate and self-organize into an EPS-blastoid. (B) Phase contrast images of EPS cell aggregates cultured in the indicated medium conditions for four days. The red triangle indicates an EPS-blastoid. (C) Representative phase contrast (upper panel) and fluorescence images (lower panel) of EPS cell aggregates at the indicated time point showing the formation of EPS-blastoids. Phase, phase contrast; Td, tdTomato. (D) Quantification of EPS-blastoids formation efficiency. n = 11 independent assays for each EPS cell line. (E) Phase contrast images of E3.5 blastocysts (upper panel) and EPS-blastoids (lower panel). (F) Histograms showing the distribution of the diameters of E3.5 blastocysts (upper panel) and EPS-blastoids (lower panel). n = 55 blastocysts and n = 95 EPS-blastoids. The vertical dotted line denotes the mean of the group. (G) A diagram showing the strategy for a single EPS cell to generate a clonal EPS-blastoid. (H) Phase contrast (left) and fluorescent (right) images of an EPS-blastoid generated using the strategy shown in (G). (I) Quantification of EPS-blastoids formation efficiency in the assay described in (G). n = 4 independent assays. Data are represented as mean ± SEM. Scale bars, 50 μm (B, C), 100 μm (E), 20 μm (H). See also Figure S1 and Table S1.
Figure 2.
Figure 2.. EPS-blastoid Formation Recapitulates Key Preimplantation Developmental Processes
(A) Phase contrast (upper panel) and fluorescent (lower panel) images of EPS cells at the indicated time after cell seeding. Td, tdTomato. (B) Immunofluorescence staining of an EPS aggregate at day 1 (left), day 2 (middle), and a compacted 8-cell embryo (right) for E-cadherin (E-CAD). (C) Quantification of the percentage of cell aggregates showing E-CAD+ staining at the indicated day. n = 3 biological replicates for each time point. (D) Immunofluorescence staining of EPS aggregates at the indicated time points and 16-cell embryos for PAR6 and SOX2 or NANOG. (E) Quantification of the percentage of cell aggregates showing a PAR6 ring at the indicated time points. n = 3 biological replicates for each time point. (F and G) Immunofluorescence staining for active YAP in EPS aggregates at the indicated time point (F), an EPS-blastoid (G), and an E4.5 blastocyst (G). (H) Quantification of the percentage of structures showing active YAP+ at the indicated time points. n = 3 independent assays for day 1, day 2 aggregates, and day 5 EPS-blastoids; n = 5 independent assays for day 3 aggregates. Data are represented as mean ± SEM. Scale bars, 20 μm. Ho, Hoechst. See also Figure S2 and Table S1.
Figure 3.
Figure 3.. EPS-blastoids Possess Three Lineages of Blastocysts
(A and B) Immunofluorescence staining of EPS-blastoids for CDX2 (A) and CK8 (B). The rightmost panel is the maximum intensity projection of z-stack images of the indicated protein. (C-E) Immunofluorescence staining of EPS-blastoids for SOX2 (C), NANOG (D), and OCT4 (E). (F) Quantification of the frequency of different EPS-blastoid categories based on CDX2 and SOX2. n = 140 EPS-blastoids. (G) Quantification of the number of cells with SOX2+ or CDX2+ staining in the ICM or TE compartment, respectively, of the indicated samples. n =14 blastocysts, 16 EPS-blastoids at day 4, 17 EPS-blastoids at day 5, and 34 EPS-blastoids at day 6. (H) Immunofluorescence staining of an EPS-blastoid for NANOG and GATA4. (I) Quantification of the frequency of EPS-blastoids with or without GATA4+ PE-like cells. n = 112 EPS-blastoids. (J) Quantification of the number of cells with NANOG+ or GATA4+ staining in the EPI- or PE-like compartment, respectively, of blastocysts or EPS-blastoids. n = 15 blastocysts and 24 EPS-blastoids. Data are represented as mean ± SEM. Scale bars, 20 μm. Ho, Hoechst. See also Figure S3.
Figure 4.
Figure 4.. Transcriptome Analysis of EPS-blastoids
(A) Principle component analysis (PCA) of bulk RNA-Seq data from individual EPS-blastoid, blastocyst, and morula. The number of biological replicates in each group was shown inside the parenthesis. (B) A Umap plot of 2702 cells from blastocysts and EPS-blastoids after alignment using the Seurat package. (C) A Umap plot showing the clustering of all cells. The identities of each cluster were determined based on the expression of the lineage markers. (D) Unsupervised clustering analysis showing the cells of similar lineage identities cluster to each other regardless of sample type. The cluster row indicates the subpopulation defined in (C). The sample row indicates the sample type. (E to G) Dot plots showing the differentially expressed genes (DEGs) in the ICM/EPI lineage (E), PE lineage (F), and TE lineage (G) between blastocysts and EPS-blastoids. Genes with FDR exceeding the statistical significance cutoff (FDR < 0.05) are labeled with red color. (H and I) Gene ontology analysis of biological functions for DEGs in the ICM/EPI lineage (H) and PE lineage (I) between blastocyst and EPS-blastoids. Red dotted line indicates the cutoff (FDR < 0.05). See also Figure S4, Table S2, and Table S3.
Figure 5.
Figure 5.. In Vitro Developmental Potential of EPS-blastoids
(A) Phase contrast image of de novo derived ES cell lines from EPS-blastoids. (B) Brightfield image of two littermates generated from blastocyst injected with EPS-blastoid-derived ES cells showing that these cells can contribute to chimeric mice. The star symbol denotes a chimeric mouse. (C) Phase contrast image of de novo derived TS cell lines from EPS-blastoids. (D) Immunofluorescence staining of a placental section for CK8 and GFP. The panels below are the enlargement of the yellow boxed region. The placenta was delineated by a dotted line; dec, decidua layer; gc, giant cell layer; sp, spongiotrophoblast layer; laby, labyrinth layer. (E) Phase contrast image of de novo derived XEN cell lines from EPS-blastoids. (F) Brightfield image of a yolk sac overlaid with tdTomato epifluorescence image showing EPS-blastoid-derived XEN cells can contribute to the developing yolk sac. Td, tdTomato. (G) Immunofluorescence staining of blastocyst-derived postimplantation embryo-like structures for TFAP2C and SOX2 (upper panel) or GATA6 and SOX2 (lower panel). (H) Immunofluorescence staining of EPS-blastoid-derived postimplantation embryo-like structures for TFAP2C and SOX2 (upper panel) or GATA4 and OCT4 (lower panel). (I) Quantification of the percentage of postimplantation embryo-like and malformed structures formed after in vitro culture of blastocysts and EPS-blastoids. n = 3 and 4 independent assays for blastocysts and EPS-blastoids, respectively. (J) Immunofluorescence staining of an EPS-blastoid-derived peri-implantation embryo-like structure for F-actin and NANOG showing the formation of rosette EPI-like structure. (K) Immunofluorescence staining of an EPS-blastoid-derived postimplantation embryo-like structure for aPKC and SOX2. Yellow arrowhead denotes the apical domain. (L and M) Immunofluorescence staining of a blastocyst- (L) or an EPS-blastoid- (M) derived postimplantation embryo-like structure for PCX and SOX2 (L) or PCX and OCT4 (M). Yellow arrowheads denote the enrichment of PCX protein around the lumens in both the EPI and ExE-like structure. PCX, podocalyxin. Data are represented as mean ± SEM. Scale bar, 500 μm (D, upper), 100 μm (A, C, E, and F), 50 μm (G, H, K, L, and M), 20 μm (D, bottom; and J). Ho, Hoechst. See also Figure S5.
Figure 6.
Figure 6.. In Vivo Developmental Potential of EPS-blastoids
(A) Brightfield image showing the formation of decidua in the mouse uterus 5 days after EPS-blastoids transfer at 2.5 dpc. Black arrowheads indicate deciduae. (B) Brightfield image of a mouse uterus 5 days after EPS-blastoids transfer at 2.5 dpc with Evan’s blue staining. The red arrowhead indicates a decidua. Yellow arrowheads denote the ovaries. (C) PCR analysis of genomic DNA for the tdTomato gene reveals the presence of EPS-blastoid-derived cells in the decidua tissue. UCNETfap2a was used as an internal loading control. (D) Immunohistochemistry analysis of decidua sections showing the decidua contains EPS-blastoid-derived tdTomato+ cells. The image on the right is the enlargement of the yellow box region. (E) Immunofluorescence staining of a section from control decidua (left) or EPS-blastoid-induced decidua (right) for CK8. The dotted line indicates the embryonic axis. AM, antimesometrial pole; M, mesometrial pole. (F and G) Brightfield images of a control E7.5 embryo (F) or an in vivo EPS-blastoid-derived structure recovered from decidua at 7.5 dpc (5 days after EPS-blastoids transfer) (G). (H - J) Immunofluorescence staining of sections from an in vivo EPS-blastoid-derived structure recovered from decidua at 7.5 dpc (5 days after EPS-blastoids transfer) for OCT4 (H), EOMES (I), and GATA4 (J). Scale bar, 1 mm (A, and B), 100 μm (D, E, F, and G), and 50 μm (H, I, and J). Ho, Hoechst. See also Figure S6, Table S4, and Table S5.
Figure 7.
Figure 7.. Generation of EPS-blastoids from Somatic Cells
(A) A phase contrast image of iEPS-blastoids. (B) Quantification of iEPS-blastoids formation efficiency. n = 5 independent assays. (C) Histogram showing the distribution of diameters of iEPS-blastoids. n = 23 iEPS-blastoids. (D) Immunofluorescence staining of iEPS aggregates at the indicated day of blastoid induction for E-cadherin. (E) Immunofluorescence staining of an iEPS aggregate at day 2 of blastoid induction for PAR6 and NANOG. (F) Immunofluorescence staining of an iEPS-blastoid for active YAP. (G) Immunofluorescence staining of an iEPS-blastoid for CDX2 and NANOG. The rightmost panel shows the maximum intensity projection of z-stack images of the indicated protein. (H) Immunofluorescence staining of a postimplantation embryo-like structure from in vitro culture of iEPS-blastoids for PCX and OCT4. The yellow arrowheads indicate the lumens lined with PCX. (I) Brightfield image showing the formation of decidua in the mouse uterus 5 days after iEPS-blastoids transfer at 2.5 dpc. Black arrowhead indicates decidua. (J) A diagram summarizing the major findings of this study. Data are represented as mean ± SEM. Scale bar, 1 mm (I), 100 μm (A), 50 μm (H), and 20 μm (D, E, F, and G). Ho, Hoechst. See also Figure S7 and Table S1.

Comment in

References

    1. Bao S, Tang F, Li X, Hayashi K, Gillich A, Lao K, and Surani MA (2009). Epigenetic reversion of post-implantation epiblast to pluripotent embryonic stem cells. Nature 2013 500:7462 461, 1292–1295. - PMC - PubMed
    1. Barton SC, Ferguson-Smith AC, Fundele R, and Surani MA (1991). Influence of paternally imprinted genes on development. Development 113, 679–687. - PubMed
    1. Beccari L, Moris N, Girgin M, Turner DA, Baillie-Johnson P, Cossy A-C, Lutolf MP, Duboule D, and Arias AM (2018). Multi-axial self-organization properties of mouse embryonic stem cells into gastruloids. Nature 2013 500:7462 562, 272–276. - PubMed
    1. Bedzhov I, and Zernicka-Goetz M (2014). Self-Organizing Properties of Mouse Pluripotent Cells Initiate Morphogenesis upon Implantation. Cell 156, 1032–1044. - PMC - PubMed
    1. Bedzhov I, Leung CY, Bialecka M, and Zernicka-Goetz M (2014a). In vitro culture of mouse blastocysts beyond the implantation stages. Nat Protoc 9, 2732–2739. - PubMed

MeSH terms