. 2019 Oct 17;20(20):5156.
doi: 10.3390/ijms20205156.

Determination of Ligand Profiles for Pseudomonas aeruginosa Solute Binding Proteins

Affiliations

Determination of Ligand Profiles for Pseudomonas aeruginosa Solute Binding Proteins

Matilde Fernández et al. Int J Mol Sci. .

Abstract

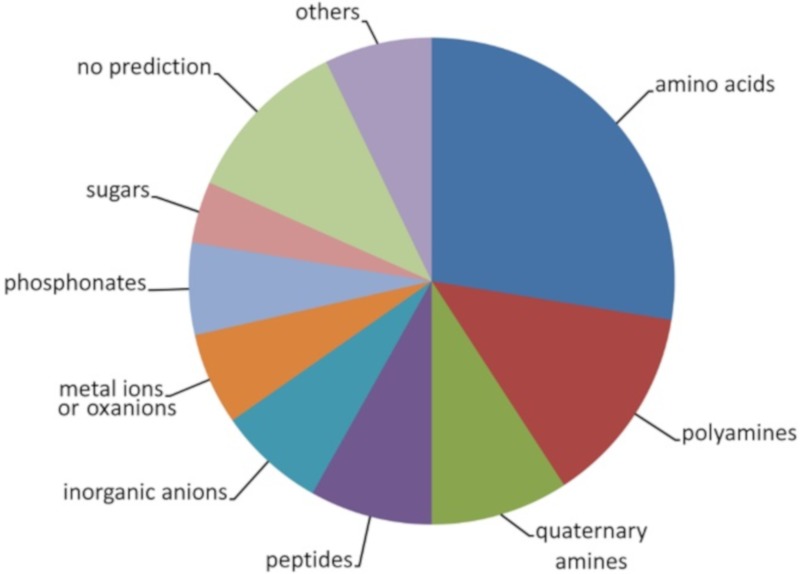
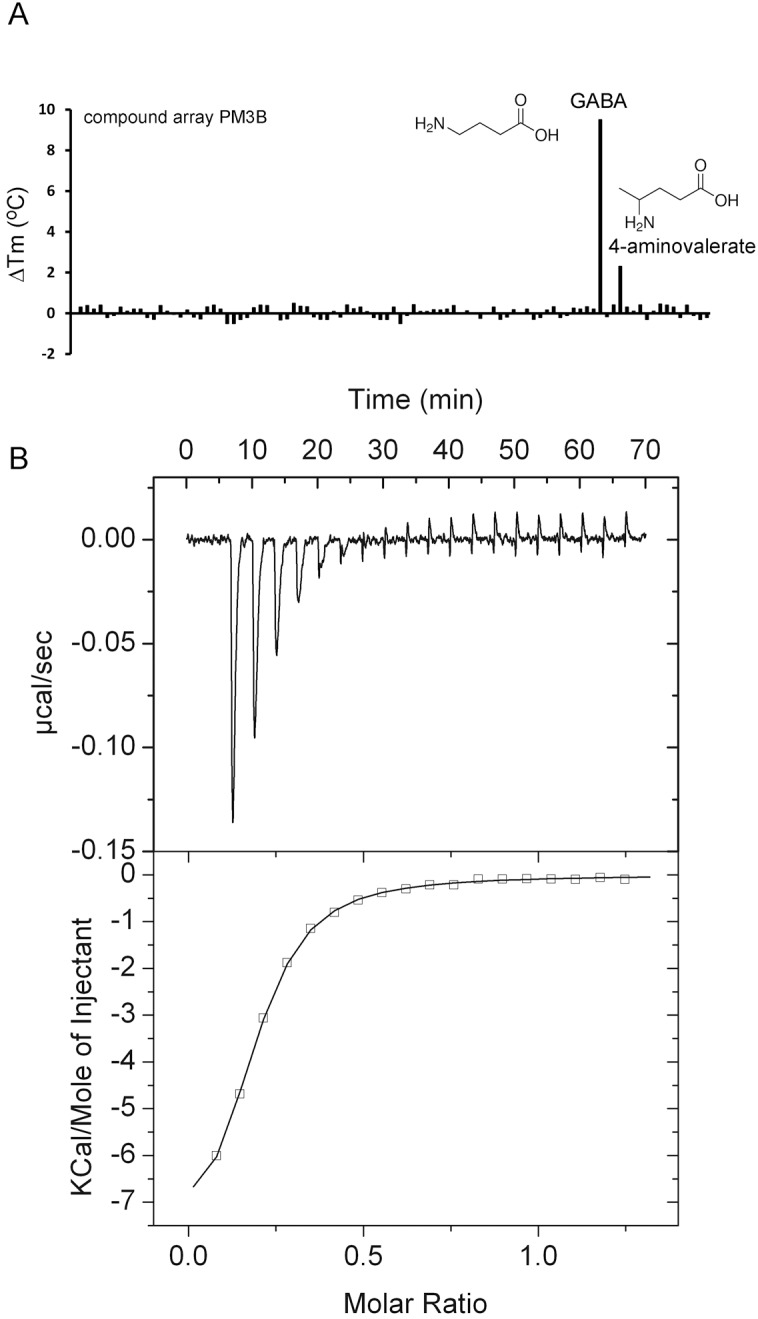
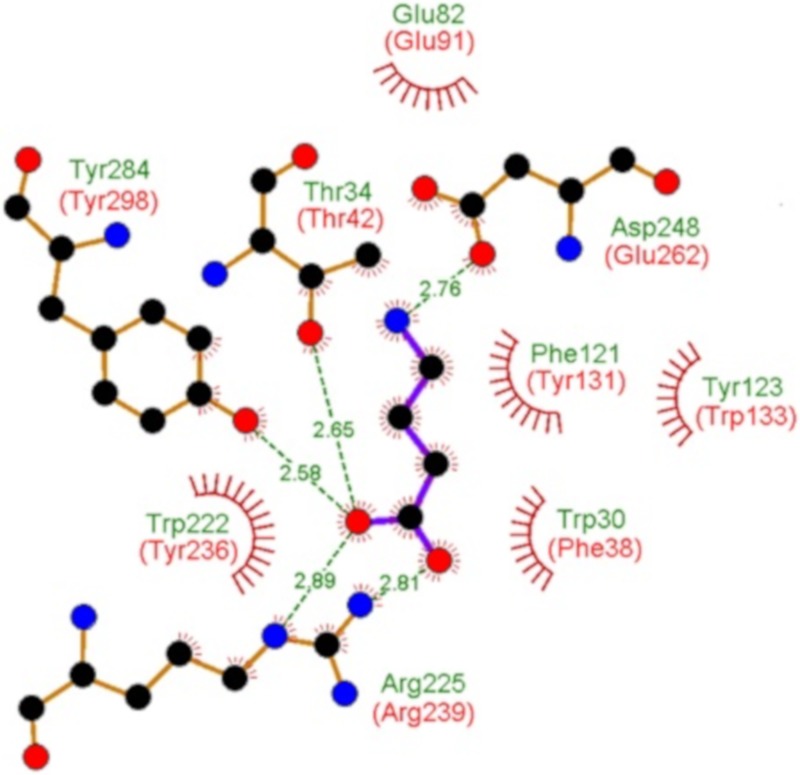
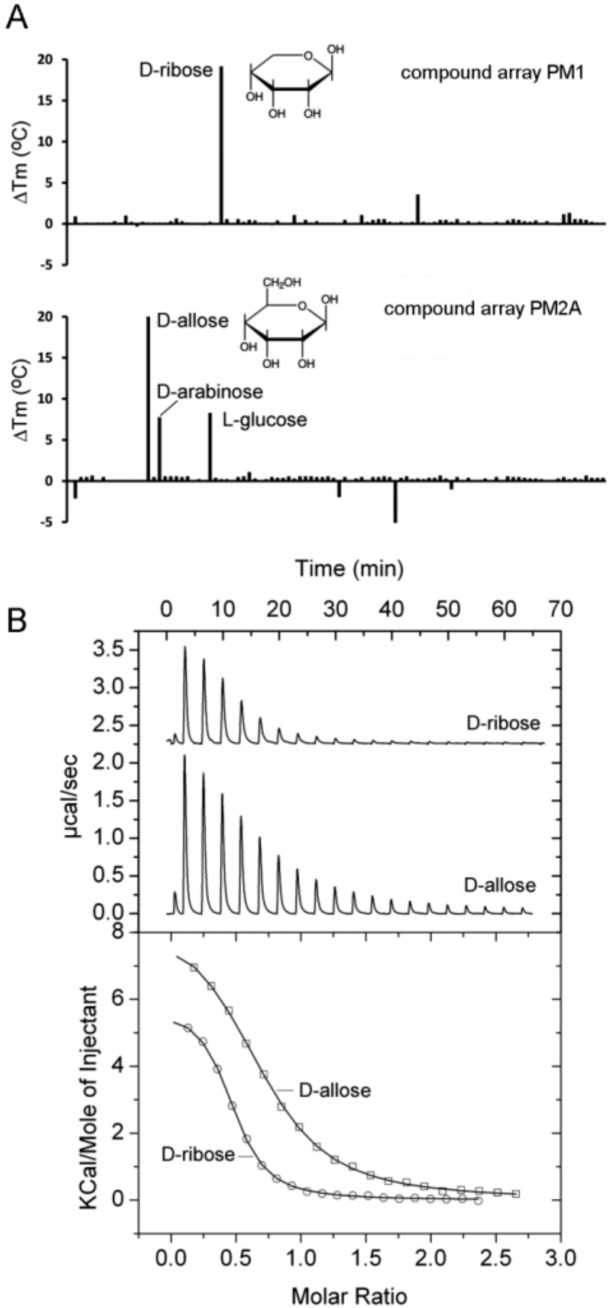
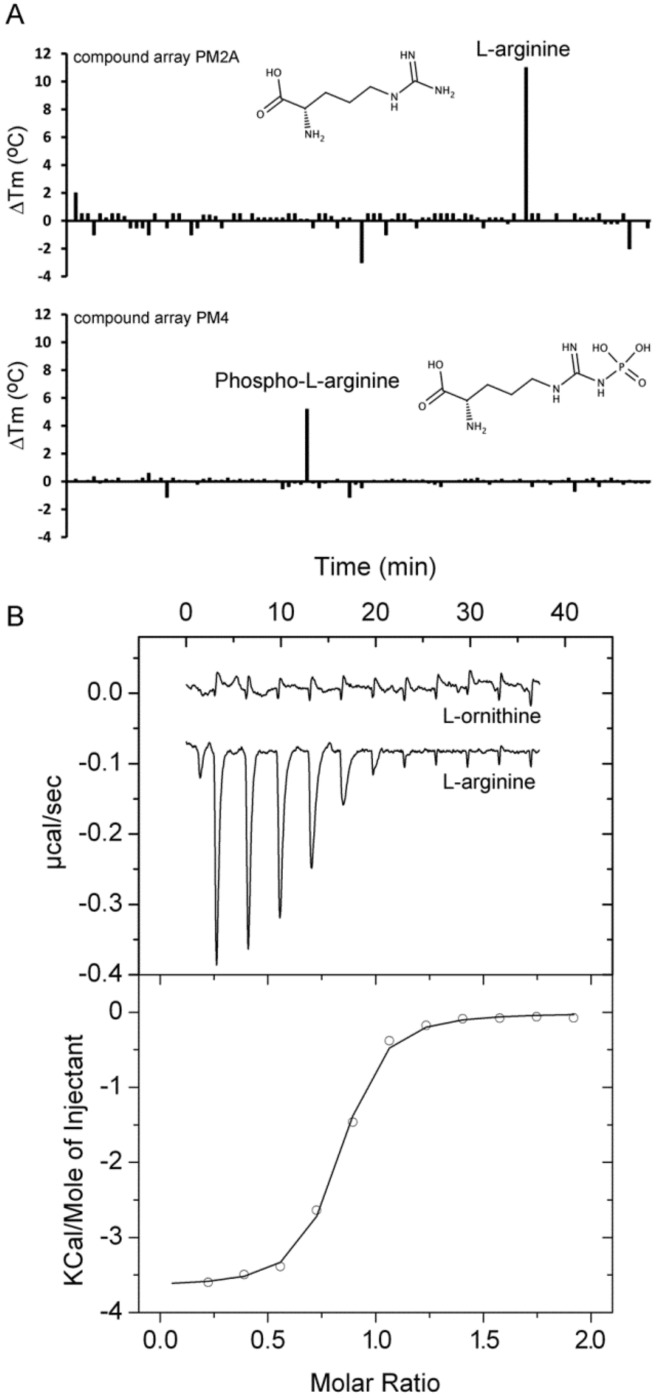
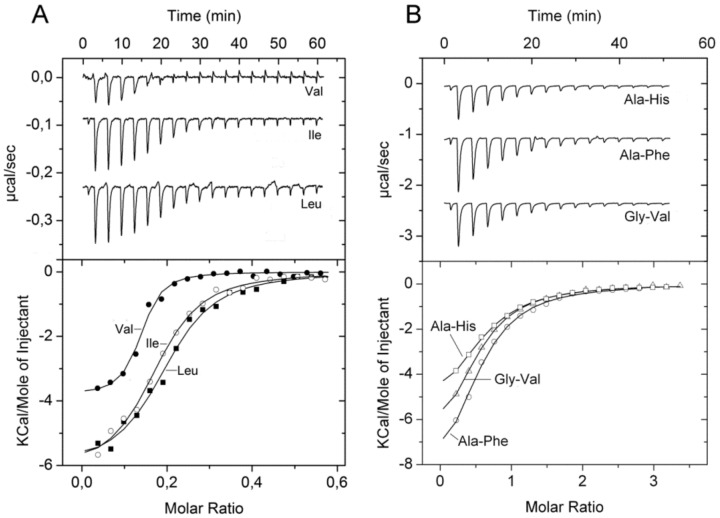
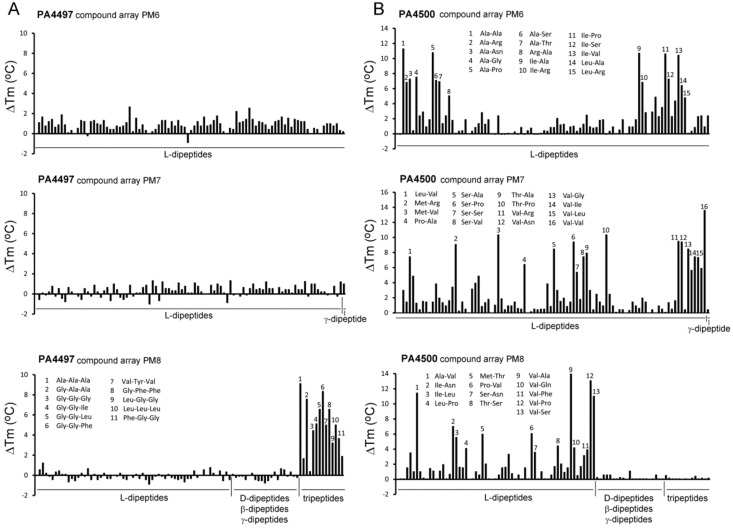
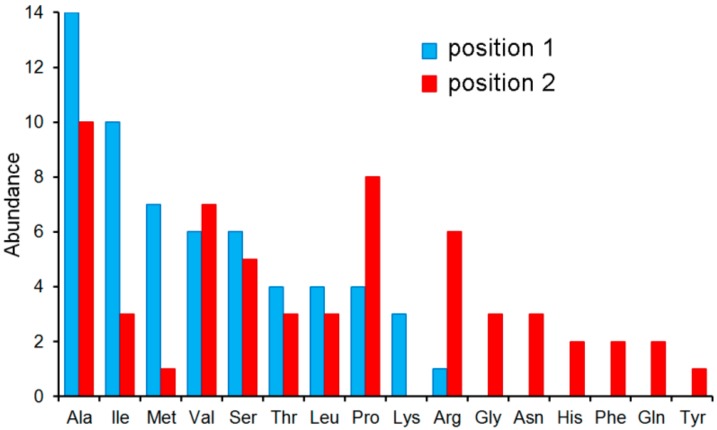
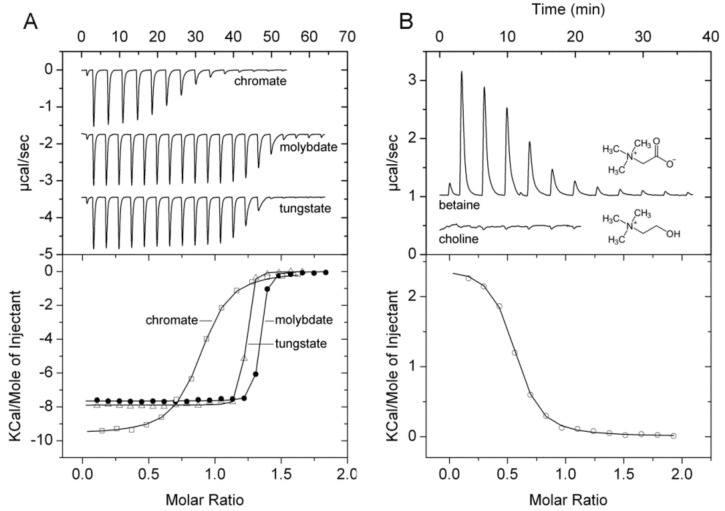
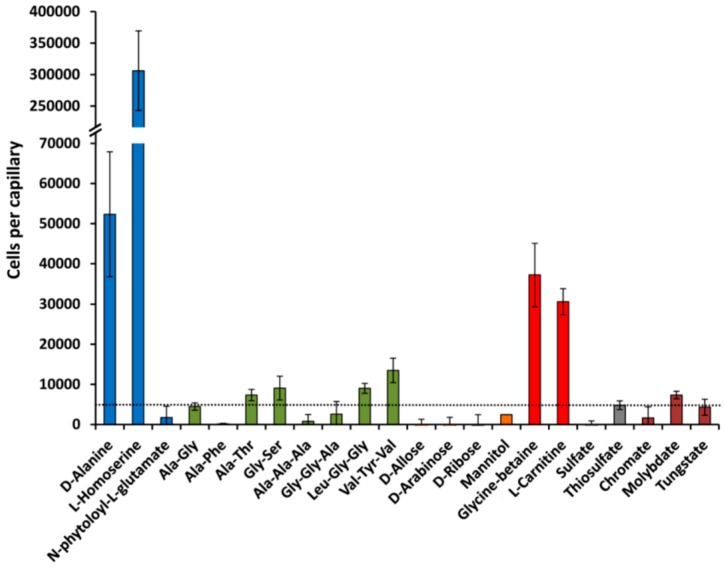
Solute binding proteins (SBPs) form a heterogeneous protein family that is found in all kingdoms of life. In bacteria, the ligand-loaded forms bind to transmembrane transporters providing the substrate. We present here the SBP repertoire of Pseudomonas aeruginosa PAO1 that is composed of 98 proteins. Bioinformatic predictions indicate that many of these proteins have a redundant ligand profile such as 27 SBPs for proteinogenic amino acids, 13 proteins for spermidine/putrescine, or 9 proteins for quaternary amines. To assess the precision of these bioinformatic predictions, we have purified 17 SBPs that were subsequently submitted to high-throughput ligand screening approaches followed by isothermal titration calorimetry studies, resulting in the identification of ligands for 15 of them. Experimentation revealed that PA0222 was specific for γ-aminobutyrate (GABA), DppA2 for tripeptides, DppA3 for dipeptides, CysP for thiosulphate, OpuCC for betaine, and AotJ for arginine. Furthermore, RbsB bound D-ribose and D-allose, ModA bound molybdate, tungstate, and chromate, whereas AatJ recognized aspartate and glutamate. The majority of experimentally identified ligands were found to be chemoattractants. Data show that the ligand class recognized by SPBs can be predicted with confidence using bioinformatic methods, but experimental work is necessary to identify the precise ligand profile.

Keywords: chemotaxis; ligand recognition; solute binding protein; transport.


Conflict of interest statement

The authors do not declare any conflict of interest.

Figures

Figure 1
Figure 1
Prediction of ligands recognized by solute binding proteins of P. aeruginosa PAO1. Shown are the compound families of the predicted 98 SBPs. For further detail, see Table S1.
Figure 2
Figure 2
Identification of PA0222 as GABA binding protein. (A) Thermal shift assays of PA0222 and the compounds of array PM3B. Shown are Tm changes with respect to the ligand-free protein. (B) Microcalorimetric titration of 10 µM PA0222 with 200 µM GABA (4.8 µL aliquots). Upper panel: Raw titration data. Lower panel: Dilution heat corrected and concentration normalized integrated raw data. The line is the best fit using the “One Binding Site” model of the MicroCal version of ORIGIN.
Figure 3
Figure 3
Evidence for specific GABA binding solute proteins in bacteria. Shown and annotated in green are amino acids that interact with bound GABA in the three dimensional structure of the specific GABA binding protein Atu4243 of Agrobacterium fabrum (pdb ID 4EUO). Annotated in red are the corresponding amino acids of PA0222 in its protein sequence alignment with Atu4243 (Figure S2).
Figure 4
Figure 4
Identification of PA1946 as binding protein for D-ribose and D-allose. (A) Thermal shift assays of PA1946 and the compounds of arrays PM1 and PM2A. Shown are Tm changes with respect to the ligand-free protein. (B) Microcalorimetric titration of 50 µM PA1946 with 1 mM D-ribose (8 µL aliquots) and 2 mM d-allose (4.8 µL aliquots). Upper panel: Raw titration data. Lower panel: Dilution heat corrected and concentration normalized integrated raw data. The line is the best fit using the ‘One Binding Site’ model of the MicroCal version of ORIGIN.
Figure 5
Figure 5
Identification of PA0888 as L-arginine binding protein. (A) Thermal shift assays of PA0888 and the compounds of arrays PM2A and PM4. Shown are Tm changes with respect to the ligand-free protein. (B) Microcalorimetric titration of 10 µM PA0888 with 500 µM l-ornithine and l-arginine (4.8 µL aliquots). Upper panel: Raw titration data. Lower panel: dilution heat corrected and concentration normalized integrated raw data. The line is the best fit using the ‘One Binding Site’ model of the MicroCal version of ORIGIN.
Figure 6
Figure 6
Microcalorimetric binding studies of amino acids and dipeptides to different solute binding proteins of P. aeruginosa. (A) Titration of 10 µM PA1074 with 100 µM l-Val, l-Ile and l-Leu (6.4 µL aliquots). (B) Titration of 25 µM PA4500 with 1 mM solutions of different dipeptides (6.4 µL aliquots). Upper panel: Raw titration data. Lower panel: Dilution heat corrected and concentration normalized integrated raw data. The line is the best fit using the ‘One Binding Site’ model of the MicroCal version of ORIGIN.
Figure 7
Figure 7
Thermal shift ligand binding studies of the solute binding proteins PA4497 and PA4500. Shown are Tm changes with respect to the ligand-free protein for PA4497 (A) and PA4500 (B). Compound arrays PM6, PM7, and PM8 that contain different di- and tripeptides were used. Peptides that caused major changes are annotated. The complete list of peptides that caused Tm increases superior to 3 °C is provided in Table S3. Microcalorimetric titrations of PA4500 with some dipeptides are shown in Figure 6B.
Figure 8
Figure 8
The ligand profile of PA4500. In total, 59 l-dipeptides caused Tm shift of more than 3 °C (Table S3). Shown is the number of amino acids at positions 1 and 2 of these 59 dipeptides.
Figure 9
Figure 9
Microcalorimetric binding studies of metal oxanions and quaternary amines to different solute binding proteins of P. aeruginosa. (A) Titration of 40 µM PA1863 with 1 mM solutions of Na2MoO4, K2Cr2O7, or Na2WO4 (6.4 µL aliquots). (B) Titration of 169 µM PA3889 with 5 mM glycine-betaine (6.4 µL aliquots) and 40 µM PA3889 with 1 mM choline (6.4 µL aliquots). Upper panel: Raw titration data. Lower panel: Dilution heat corrected and concentration normalized integrated raw data. The line is the best fit using the ‘One Binding Site’ model of the MicroCal version of ORIGIN.
Figure 10
Figure 10
Chemotaxis of Pseudomonas aeruginosa PAO1 towards different ligands recognized by solute binding proteins. In all cases, the chemoeffector concentration was 1 mM, except molybdate which was at 0.1 mM. Data are means and standard deviations from three biological replicates conducted in triplicate. Data were corrected with the number of cells that swam into buffer containing capillaries.

References

    1. Wuichet K., Zhulin I.B. Origins and diversification of a complex signal transduction system in prokaryotes. Sci. Signal. 2010;3:ra50. doi: 10.1126/scisignal.2000724. - DOI - PMC - PubMed
    1. Parkinson J.S., Hazelbauer G.L., Falke J.J. Signaling and sensory adaptation in Escherichia coli chemoreceptors: 2015 update. Trends Microbiol. 2015;23:257–266. doi: 10.1016/j.tim.2015.03.003. - DOI - PMC - PubMed
    1. Bi S., Sourjik V. Stimulus sensing and signal processing in bacterial chemotaxis. Curr. Opin. Microbiol. 2018;45:22–29. doi: 10.1016/j.mib.2018.02.002. - DOI - PubMed
    1. Hickman J.W., Tifrea D.F., Harwood C.S. A chemosensory system that regulates biofilm formation through modulation of cyclic diguanylate levels. Proc. Natl. Acad. Sci. USA. 2005;102:14422–14427. doi: 10.1073/pnas.0507170102. - DOI - PMC - PubMed
    1. Whitchurch C.B., Leech A.J., Young M.D., Kennedy D., Sargent J.L., Bertrand J.J., Semmler A.B., Mellick A.S., Martin P.R., Alm R.A., et al. Characterization of a complex chemosensory signal transduction system which controls twitching motility in Pseudomonas aeruginosa. Mol. Microbiol. 2004;52:873–893. doi: 10.1111/j.1365-2958.2004.04026.x. - DOI - PubMed