. 2019 Oct 18;20(1):211.
doi: 10.1186/s13059-019-1837-6.

DeepImpute: an accurate, fast, and scalable deep neural network method to impute single-cell RNA-seq data

Affiliations

DeepImpute: an accurate, fast, and scalable deep neural network method to impute single-cell RNA-seq data

Cédric Arisdakessian et al. Genome Biol. .

Abstract

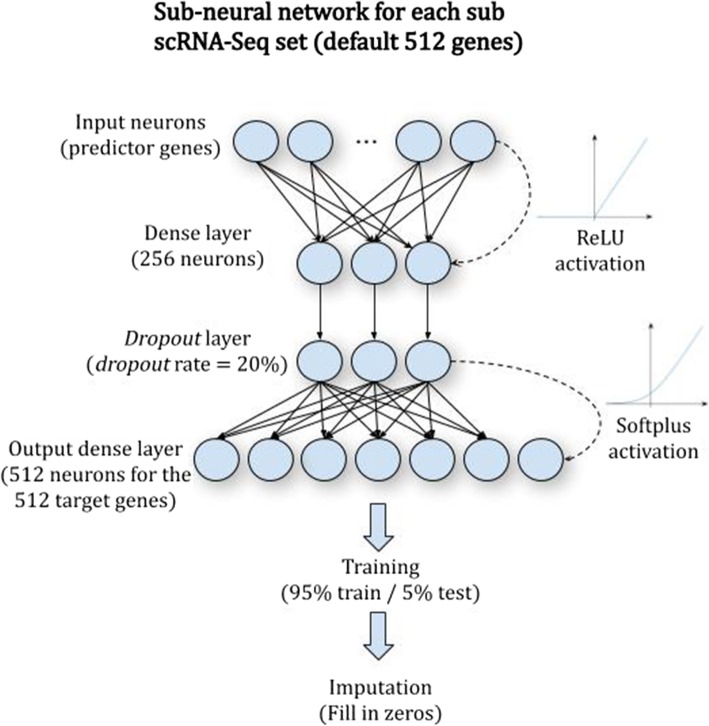
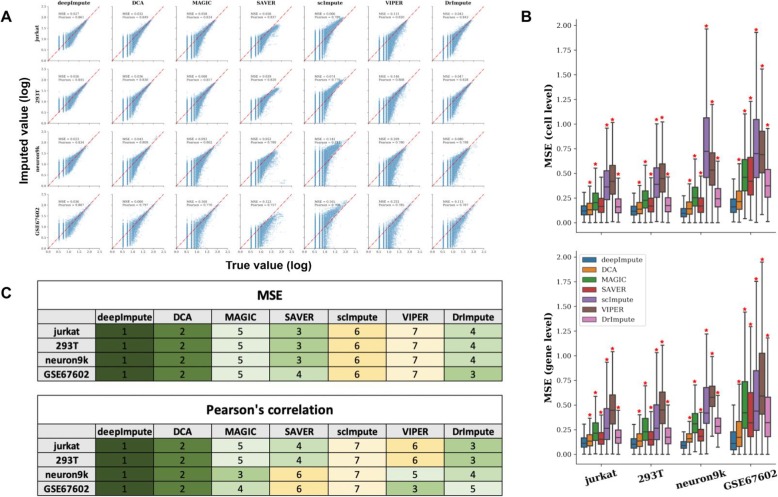
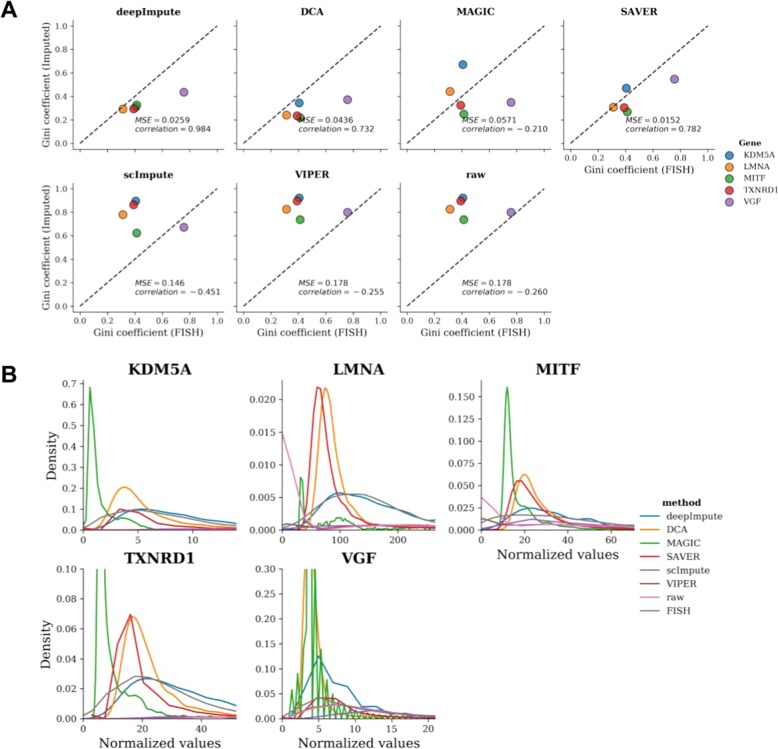
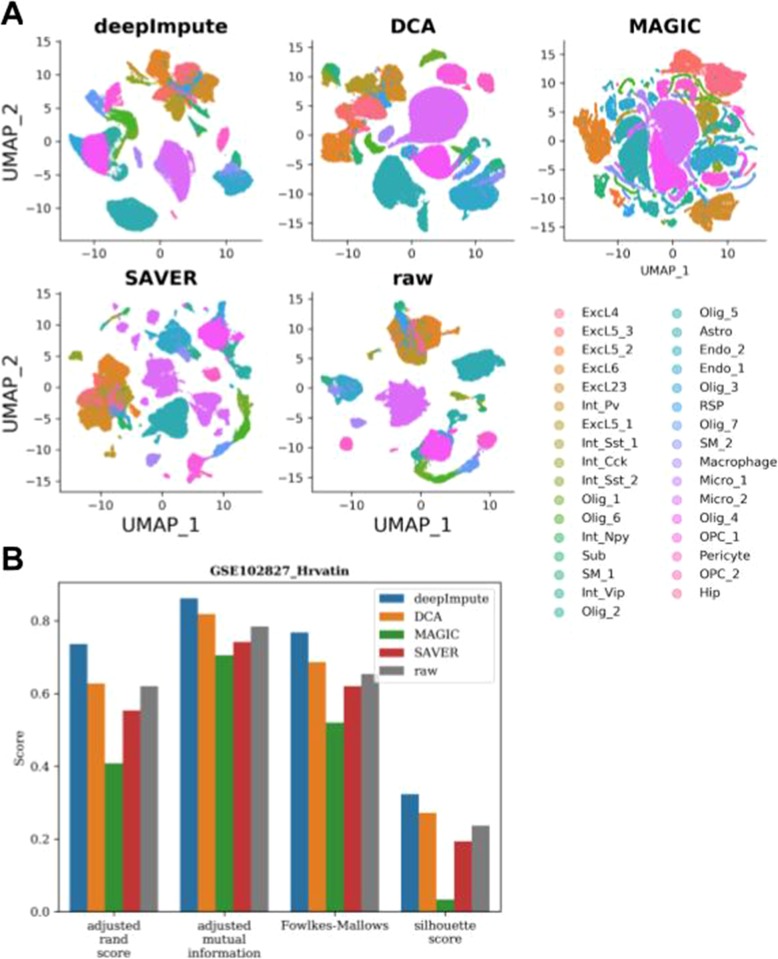
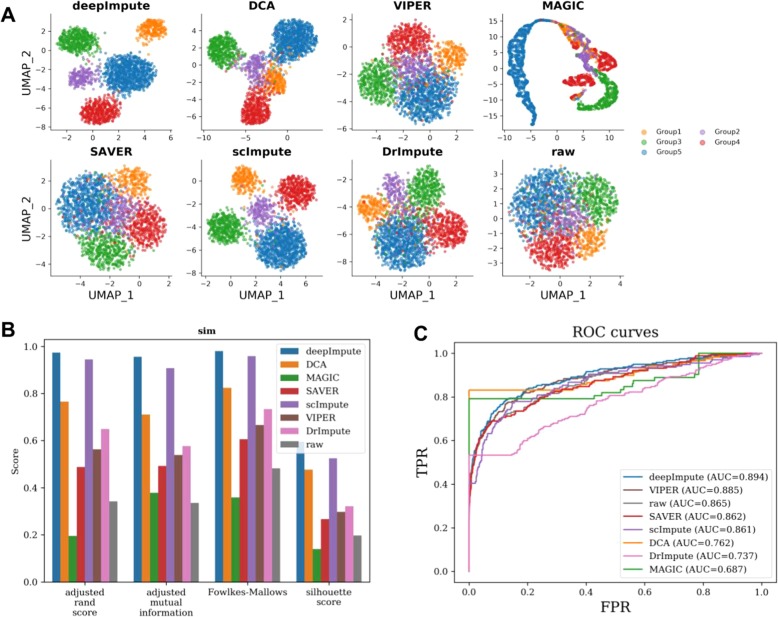
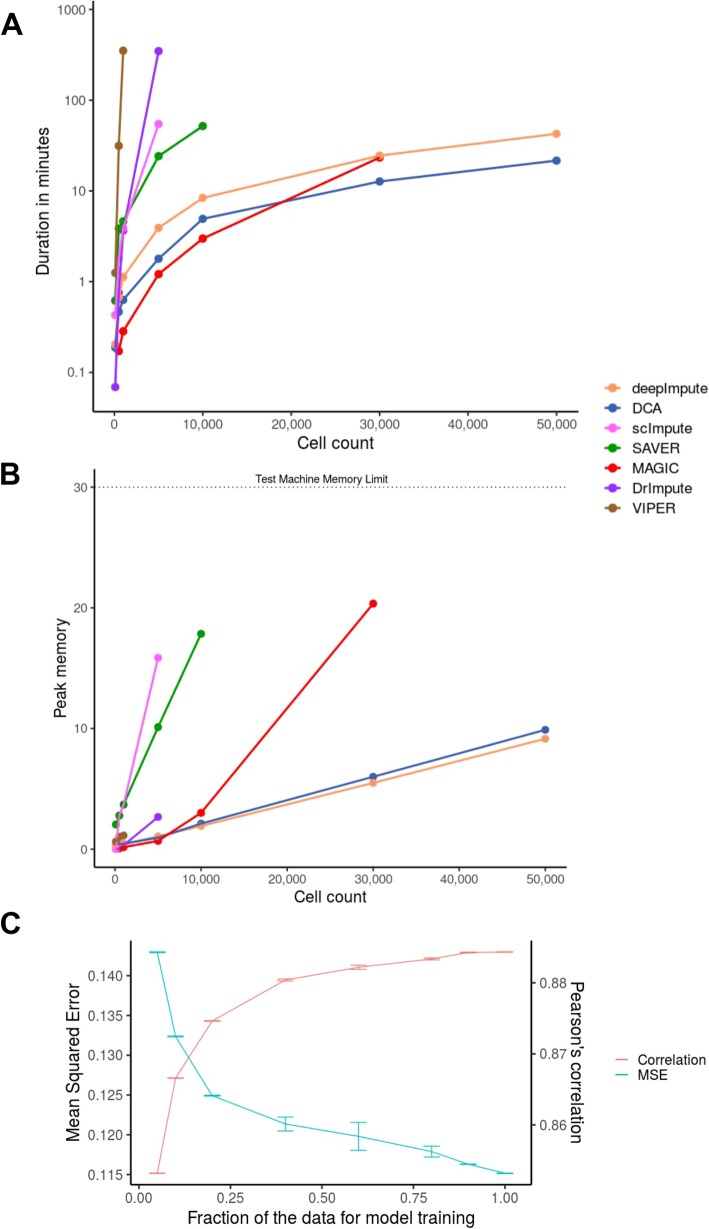
Single-cell RNA sequencing (scRNA-seq) offers new opportunities to study gene expression of tens of thousands of single cells simultaneously. We present DeepImpute, a deep neural network-based imputation algorithm that uses dropout layers and loss functions to learn patterns in the data, allowing for accurate imputation. Overall, DeepImpute yields better accuracy than other six publicly available scRNA-seq imputation methods on experimental data, as measured by the mean squared error or Pearson's correlation coefficient. DeepImpute is an accurate, fast, and scalable imputation tool that is suited to handle the ever-increasing volume of scRNA-seq data, and is freely available at https://github.com/lanagarmire/DeepImpute .

Keywords: Deep learning; DeepImpute; Dropout; Imputation; Machine learning; Neural network; RNA-seq; Single-cell.


Conflict of interest statement

The authors declare that they have no competing interests.

Figures

Fig. 1
Fig. 1
(Sub) Neural network architecture of DeepImpute. Each sub-neural network is composed of four layers. The input layer is genes that are highly correlated with the target genes in the output layer. It is followed by a dense hidden layer of 256 neurons dense layer and a dropout layer (dropout rate = 20%). The output layer consists of a subset of target genes (default N = 512), whose zero values are to be imputed
Fig. 2
Fig. 2
Accuracy comparison between DeepImpute and other competing methods. a Scatter plots of imputed vs. original data masked. The x-axis corresponds to the true values of the masked data points, and the y-axis represents the imputed values. Each row is a different dataset, and each column is a different imputation method. The mean squared error (MSE) and Pearson’s correlation coefficients (Pearson) are shown above each dataset and method. The rankings of these methods are shown below the figure in color coding. b Bar graphs of cell-cell and gene-gene level MSEs between the true (masked) and imputed values, based on those in a. Asterisk indicates statistically significant difference (P < 0.05) between DeepImpute and the imputation method of interest using the Wilcoxon rank-sum test. Color labels for all imputation methods are shown in the figure (c). Ranking of each method for all four datasets for both overall MSE and Pearson's correlation coefficient
Fig. 3
Fig. 3
Comparison among imputation methods using RNA FISH data. a Scatter plots of GINI coefficients from the imputed (or raw) vs. FISH data. The x-axis is the “true” GINI coefficient as determined by FISH experiments, and the y-axis is the imputed (or raw) GINI coefficient. The Pearson’s correlation coefficients (Pearson) and mean squared error (MSE) are shown for each method. Colors represent different genes: KDM5A (blue), LMNA (yellow), MITF (Green), TXNRD1 (red), and VGF (brown). b Gene distributions for seven imputation methods: DeepImpute (blue), DCA (yellow), MAGIC (green), SAVER (red), scImpute (purple), VIPER (brown), raw (pink), and FISH (gray) data
Fig. 4
Fig. 4
Comparison on effect of imputation on downstream function analysis of the experimental data (GSE102827). a UMAP plots of DeepImpute, DCA, MAGIC, SAVER, and raw data (scImpute, DrImpute, and VIPER) failed to run due to the large cell size of 48,267 cells). Colors represent original cell type labels as annotated. b Accuracy measurements of clustering using various metrics: adjusted Rand index (adjusted_rand_score), adjusted mutual information (adjusted_mutual_info_score), Fowlkes–Mallows Index (Fowlkes-Mallows), and Silhouette coefficient (Silhouette score). Higher values indicate better clustering accuracy. Bar colors represent different methods: DeepImpute (blue), DCA (orange), MAGIC (green), SAVER (red), and raw data (brown)
Fig. 5
Fig. 5
Comparison on effect of imputation on downstream function analysis of simulated data using Splatter. This simulation dataset is composed of 4000 genes and 2000 cells, split into 5 cell types (proportions: 5%/5%/10%/20%/20%/40%). a UMAP plots of DeepImpute, MAGIC, SAVER, scImpute, DrImpute, and raw data. Each color represents one of the 5 cell types. b Accuracy measurements of clustering using the same metrics as in Fig. 4b. Bar colors represent different methods as shown in the figure. c Accuracy measurements of differentially expressed genes by different imputation methods. The top 500 differentially expressed genes in each cell type are used to compare with the true differentially expressed genes in the simulated data, over a range of adjusted p values for each method. Colors represent different methods as shown in the figure
Fig. 6
Fig. 6
Speed and memory usage comparison among imputation methods, as well as the effect of subsampling training data on DeepImpute accuracy. a, b Speed and memory comparisons on the Mouse1M dataset. This dataset is chosen for its largest cell numbers. Color labels different imputation methods. a Speed average over 3 runs. The x-axis is the number of cells, and the y-axis is the running time in minutes (log scale) of the imputation process. b RAM memory usage. The x-axis is the number of cells, and the y-axis is the maximum RAM used by the imputation process. Because of the limited amount of memory or time, scImpute, SAVER, and MAGIC exceeded the memory limit respectively at 10k, 30k, and 50k cells, thus no measurements at these and higher cell counts. VIPER and DrImpute each exceeded 24 h on 1k and 10k cells; therefore, they too do not have measurements at these and higher cell counts. c The effect of subsampling training data on DeepImpute accuracy. Neuron9k dataset is masked and measured for performance as in Fig. 2. x-axis is the fraction of cells in the training data set, and y-axis labels are values for mean squared error (left) and Pearson’s correlation coefficient (right). Color labels are as indicted in the graph. Error bars represent the standard deviations over the 10 repetitions

References

    1. Usoskin D, Furlan A, Islam S, Abdo H, Lönnerberg P, Lou D, et al. Unbiased classification of sensory neuron types by large-scale single-cell RNA sequencing. Nat Neurosci. 2015;18:145. doi: 10.1038/nn.3881. - DOI - PubMed
    1. Villani A-C, Satija R, Reynolds G, Sarkizova S, Shekhar K, Fletcher J, et al. Single-cell RNA-seq reveals new types of human blood dendritic cells, monocytes, and progenitors. Science. 2017;356:eaah4573. doi: 10.1126/science.aah4573. - DOI - PMC - PubMed
    1. Zeisel A, Muñoz-Manchado AB, Codeluppi S, Lönnerberg P, La Manno G, Juréus A, et al. Cell types in the mouse cortex and hippocampus revealed by single-cell RNA-seq. Science. 2015;347:1138–1142. doi: 10.1126/science.aaa1934. - DOI - PubMed
    1. Jaitin DA, Kenigsberg E, Keren-Shaul H, Elefant N, Paul F, Zaretsky I, et al. Massively parallel single-cell RNA-seq for marker-free decomposition of tissues into cell types. Science. 2014;343:776–779. doi: 10.1126/science.1247651. - DOI - PMC - PubMed
    1. Kriegstein A, Pollen AA, Nowakowski TJ, Shuga J, Wang X, Leyrat AA, et al. Low-coverage single-cell mRNA sequencing reveals cellular heterogeneity and activated signaling pathways in developing cerebral cortex. 2014. - PMC - PubMed

Publication types