. 2019 Dec;31(12):2947-2972.
doi: 10.1105/tpc.19.00320. Epub 2019 Oct 18.

A Promiscuous CYP706A3 Reduces Terpene Volatile Emission from Arabidopsis Flowers, Affecting Florivores and the Floral Microbiome

Affiliations

A Promiscuous CYP706A3 Reduces Terpene Volatile Emission from Arabidopsis Flowers, Affecting Florivores and the Floral Microbiome

Benoît Boachon et al. Plant Cell. 2019 Dec.

Abstract

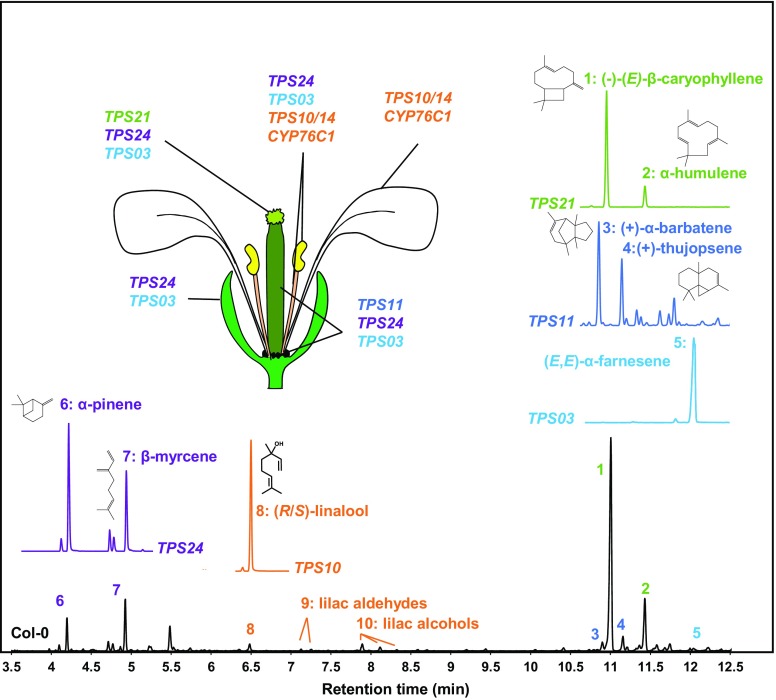
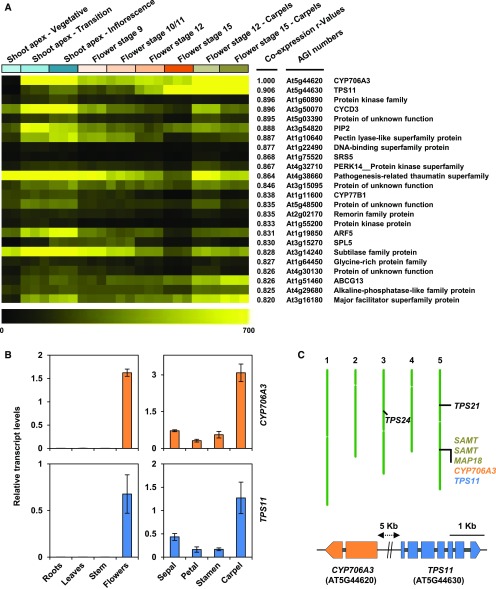
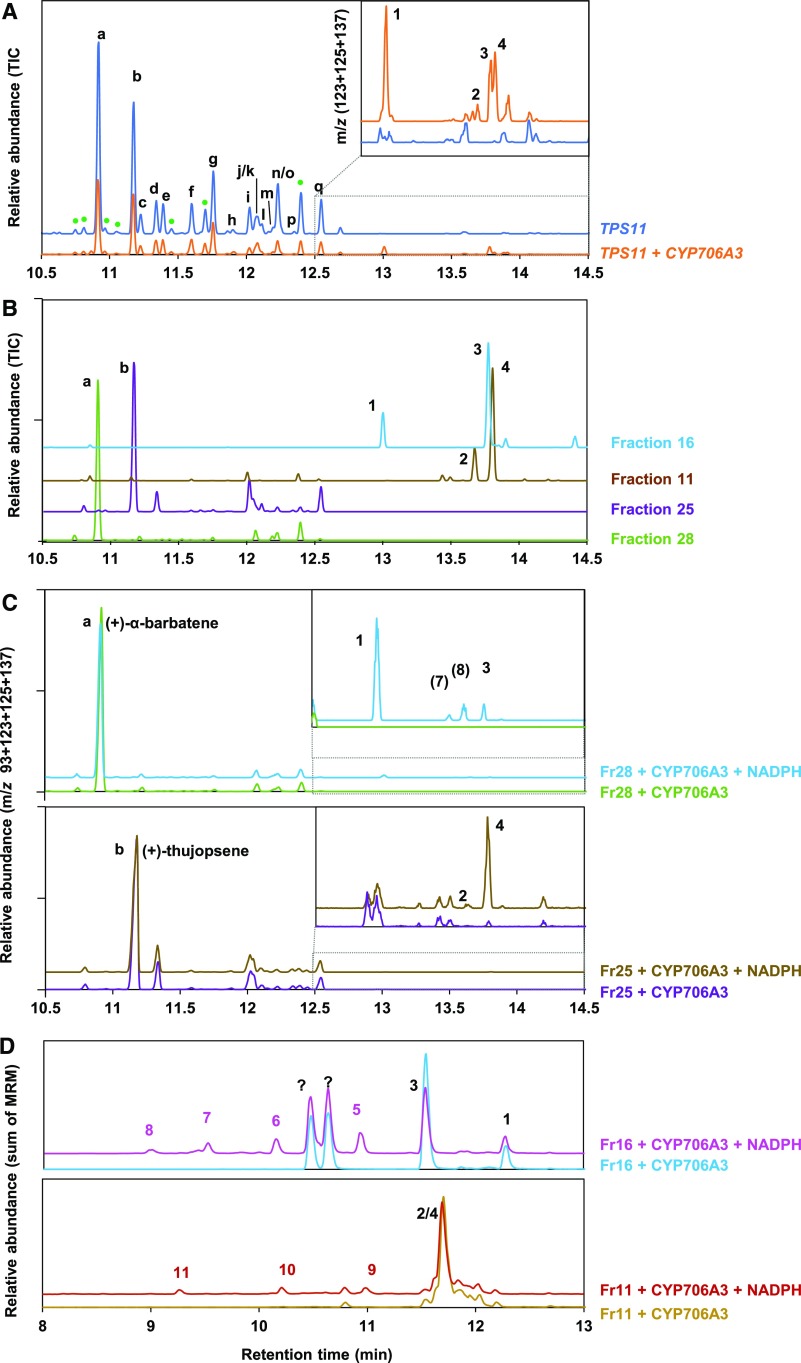
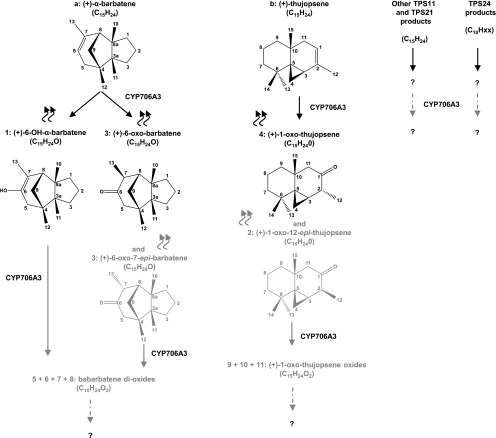
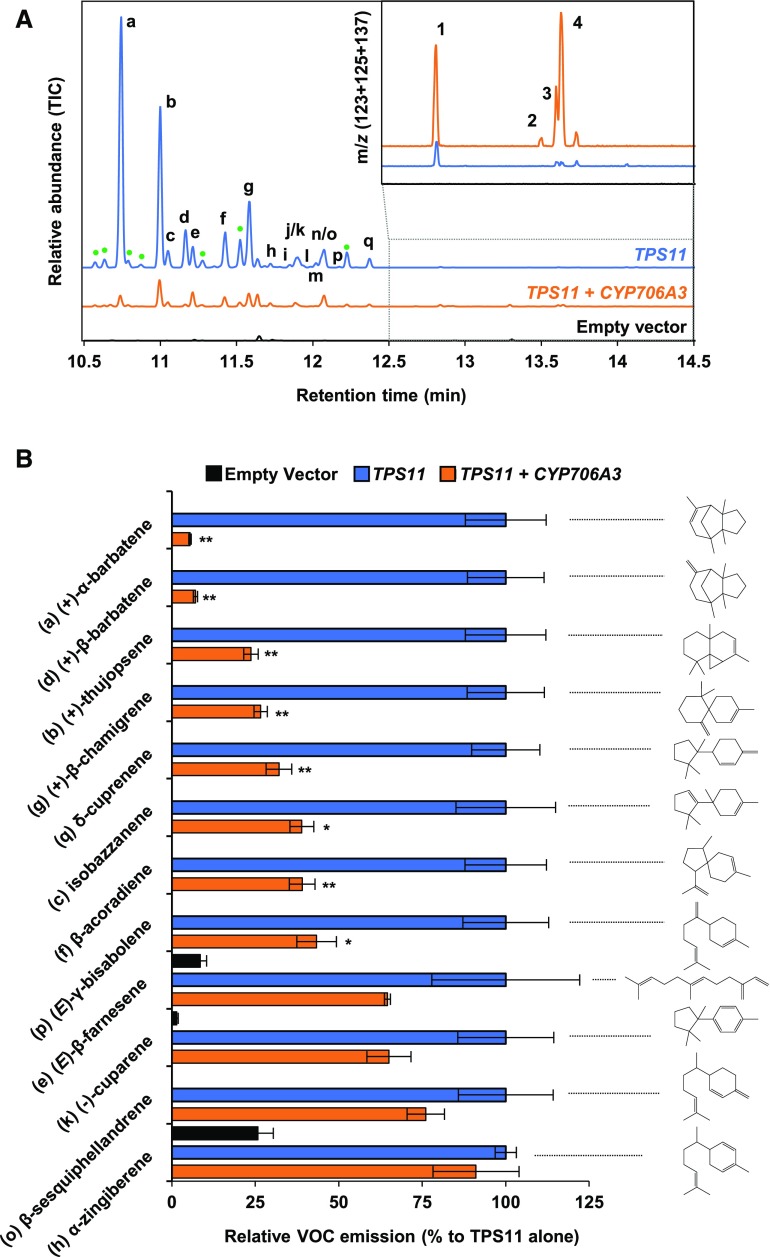
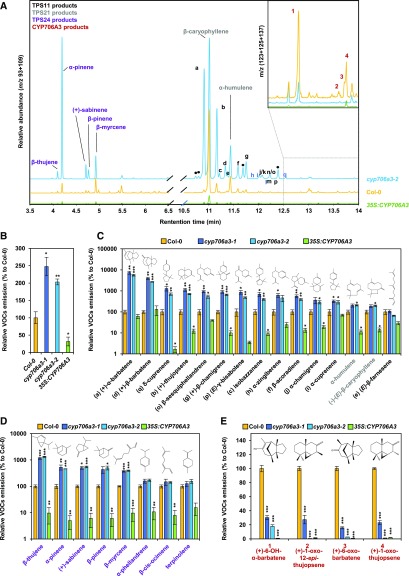
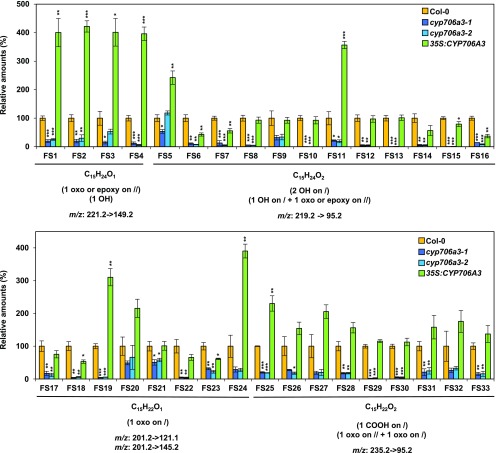
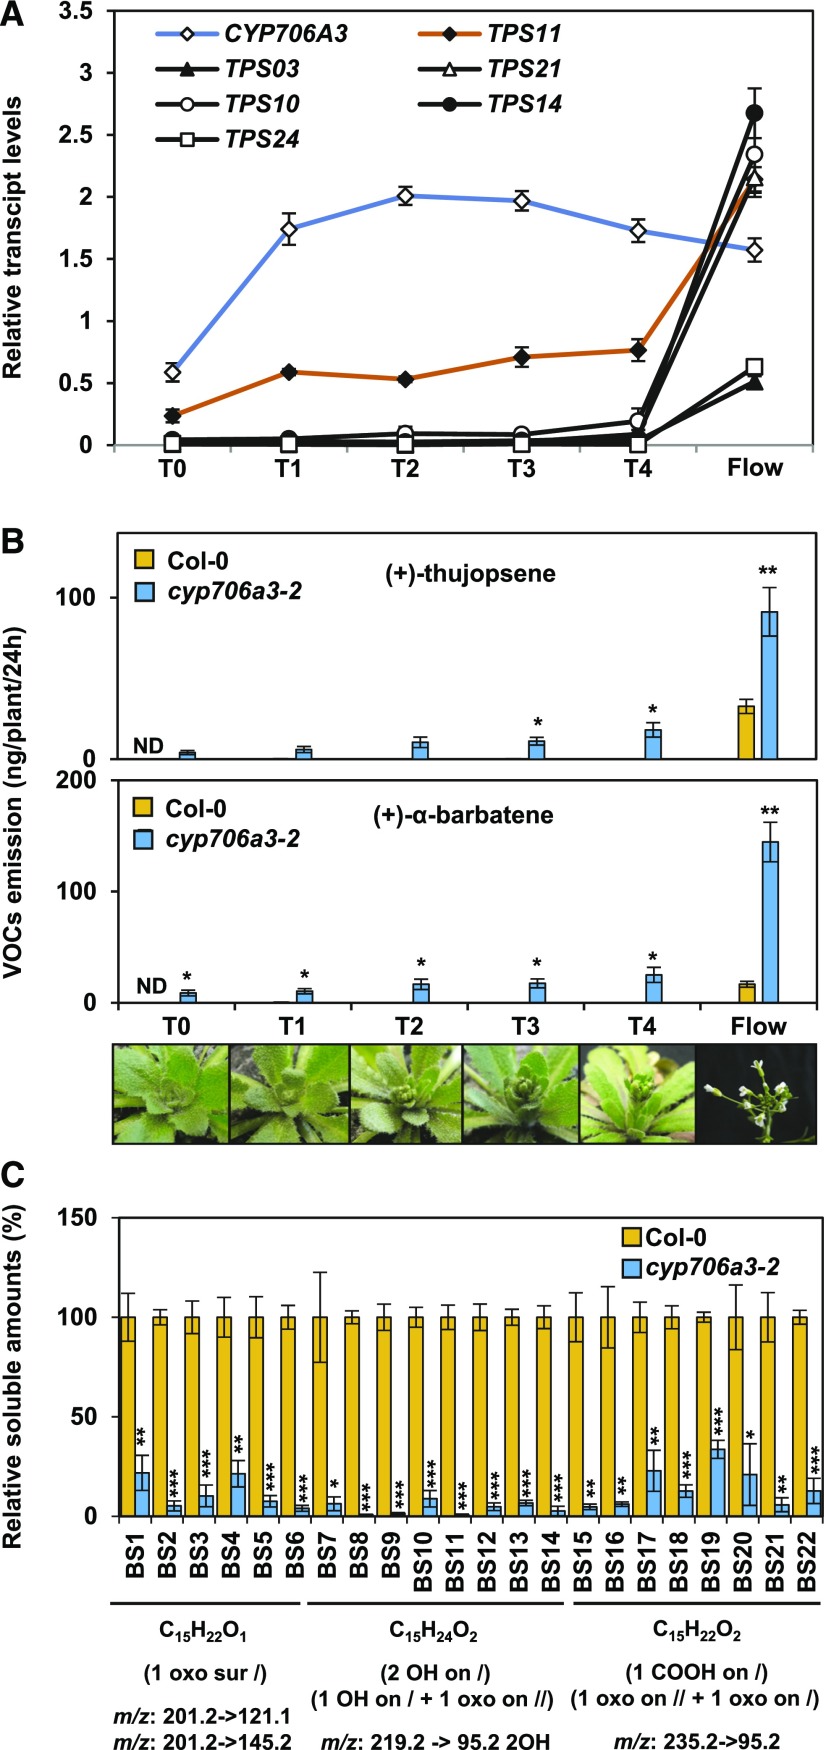
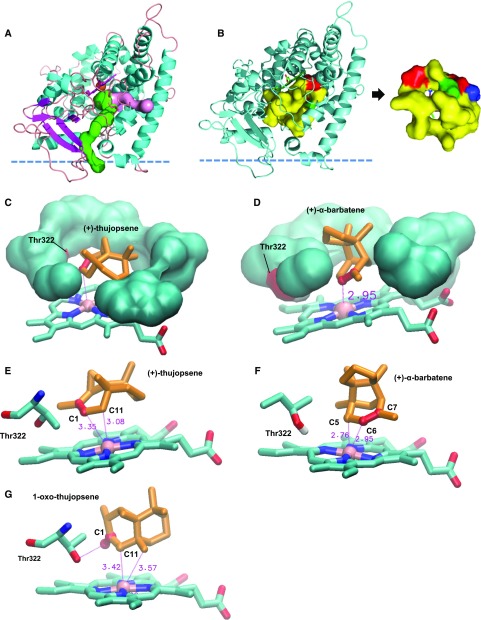
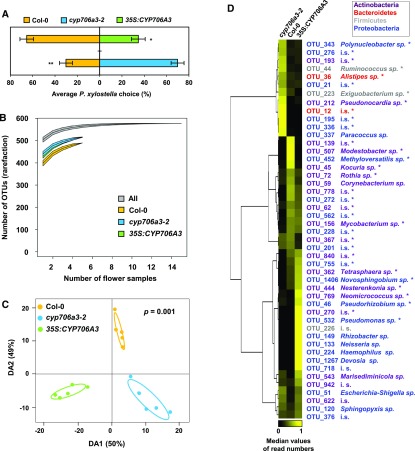
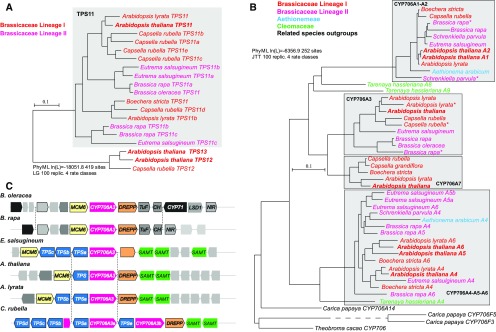
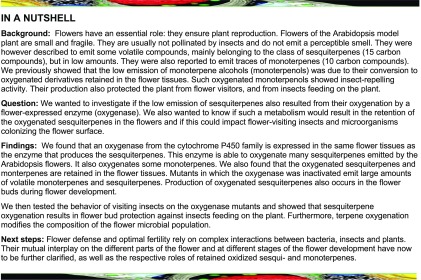
Flowers are essential but vulnerable plant organs, exposed to pollinators and florivores; however, flower chemical defenses are rarely investigated. We show here that two clustered terpene synthase and cytochrome P450 encoding genes (TPS11 and CYP706A3) on chromosome 5 of Arabidopsis (Arabidopsis thaliana) are tightly coexpressed in floral tissues, upon anthesis and during floral bud development. TPS11 was previously reported to generate a blend of sesquiterpenes. By heterologous coexpression of TPS11 and CYP706A3 in yeast (Saccharomyces cerevisiae) and Nicotiana benthamiana, we demonstrate that CYP706A3 is active on TPS11 products and also further oxidizes its own primary oxidation products. Analysis of headspace and soluble metabolites in cyp706a3 and 35S:CYP706A3 mutants indicate that CYP706A3-mediated metabolism largely suppresses sesquiterpene and most monoterpene emissions from opening flowers, and generates terpene oxides that are retained in floral tissues. In flower buds, the combined expression of TPS11 and CYP706A3 also suppresses volatile emissions and generates soluble sesquiterpene oxides. Florivory assays with the Brassicaceae specialist Plutella xylostella demonstrate that insect larvae avoid feeding on buds expressing CYP706A3 and accumulating terpene oxides. Composition of the floral microbiome appears also to be modulated by CYP706A3 expression. TPS11 and CYP706A3 simultaneously evolved within Brassicaceae and form the most versatile functional gene cluster described in higher plants so far.plantcell;31/12/2947/FX1F1fx1.


Figures

Figure 1.
Figure 1.
Flower-Expressed Terpene Synthases in Col-0 Arabidopsis and Resulting Flower-Emitted Terpenoids. Top: GC-MS chromatograms of products generated by different TPSs expressed in N. benthamiana. Expression in specific flower organs is indicated. Bottom: Representative GC-MS chromatogram of headspace collected from Col-0 flowers focusing on major mono- and sesquiterpenes (m/z: 93) produced by flower-expressed TPSs.
Figure 2.
Figure 2.
CYP706A3 and TPS11 Are Coexpressed and Physically Clustered on Chromosome 5 in Arabidopsis. (A) Expression heatmap of the 25 genes most coregulated with CYP706A3. Analysis was performed using the BAR Expression Angler tool and the AtGenExpress extended Tissue Compendium data set (Toufighi et al., 2005). The heatmap shows expression levels in selected flowers’ tissues: vegetative shoot apex; transition and inflorescence tissues; flower stages 9, 10/11, 12, 15; and carpels of flower stages 12 and 15. Pearson correlation coefficients (r values) of each gene coexpressed with CYP706A3, AGI numbers of the genes, and gene annotations from The Arabidopsis Information Resource are shown. (B) Relative transcript levels of CYP706A3 and TPS11 in plant (left) and flower (right) organs. Relative transcript levels were determined by RT-qPCR (details in Methods). Results represent means ± se of four biological replicates (pooled tissues from individual plants). (C) Map of the CYP706A3 and TPS11 gene cluster on chromosome 5 (top) and representation of introns/exons and genomic distances between both genes (bottom). The genomic localizations of TPS24, TPS21, and cluster-neighboring genes are also indicated. Numbers 1 to 5 indicate chromosomes 1 to 5. Line represents chromosome 5 on which are located the exons (CYP706A3: orange-filed, TPS11: blue-filled boxes) and introns (gray-filled boxes).
Figure 3.
Figure 3.
Yeast-Expressed CYP706A3 Oxidizes TPS11 Products. (A) GC-MS chromatograms of headspace collected from cultures of yeast expressing TPS11 or from mixtures of yeast expressing TPS11 or CYP706A3. Chromatograms show the relative abundance of total ion current (TIC) and the sum of extracted ion current as insets (m/z 123 + 125 + 137). See Methods for detailed protocol. (B) GC-MS chromatograms of fractions purified from (A) and containing TPS11 and CYP706A3 products. (C) GC-MS chromatograms of ethyl acetate extracts from incubations of purified TPS11 products [fraction 28 containing (+)-α-barbatene (top) or fraction 25 containing (+)-thujopsene (bottom)] with microsomal membranes prepared from yeast expressing CYP706A3 in the presence or absence (negative control) of NADPH. Chromatograms show the sum of extracted ion current (m/z 93 + 123 + 125 + 137). Insets show expanded chromatogram scale. CYP706A3-dependent metabolism of TPS11 products is probably underestimated due to low solubility of substrates in the incubation buffer. (D) LC-MS/MS chromatograms of methanol extracts from incubations of purified CYP706A3 primary products [fraction 16 containing barbatene oxides (1) and (3; top) or fraction 11 containing thujopsene oxides (2) and (4; bottom)] with microsomal membranes prepared from yeast expressing CYP706A3 in the presence or absence (negative control) of NADPH. Chromatograms show the sum of different multiple reaction monitoring (MRM) listed in Supplemental Table 6. TPS11 products are indicated with letters: (a) (+)-α-barbatene, (b) (+)-thujopsene, (c) isobazzanene, (d) (+)-β-barbatene, (e) (E)-β-farnesene, (f) β-acoradiene, (g) (+)-β-chamigrene, (h) α-zingiberene, (i) α-cuprenene, (j) α-chamigrene, (k) (-)-cuparene, (l) 1,2-dihydrocuparene, (m) (-)-zingiberene, (n) 1,2-dihydrocuparene, (o) β-sesquiphellandrene, (p) (E)-γ-bisabolene, and (q) δ-cuprenene. The products were identified based on a comparison of their MS and RT with libraries and published work (Tholl et al., 2005). CYP706A3 products are indicated by numbers and defined in Figure 4. Peaks labeled with question marks could not be identified, but their mass suggests that they are oxygenated sesquiterpenoids. These peaks appeared only after storage. See Supplemental Figures 3 and 4 for more extensive data.
Figure 4.
Figure 4.
Reactions Catalyzed by CYP706A3 on Floral TPS Products. Wavy arrows indicate volatile compounds. Black arrows indicate primary and NADPH-dependent activities of CYP706A3 on TPS11 [(+)-α-barbatene and (+)-thujopsene], TPS21, and TPS24 products confirmed in vitro. Primary products 1, 2, 3 and 4 (in black and gray) were validated by NMR spectroscopy and represent the major CYP706A3 products emitted from Arabidopsis flowers. Gray arrows indicate secondary NADPH-dependent activities of CYP706A3 on primary products derived from (+)-α-barbatene and (+)-thujopsene obtained in vitro. Raw formulae of secondary products in gray were deduced from LC-MS spectra. Dashed-dotted gray arrows indicate CYP706A3 putative activities deduced from flower metabolic profiling. Unidentified compounds are indicated by question marks.
Figure 5.
Figure 5.
Transient Coexpression in N. benthamiana Reveals CYP706A3 Activity on Multiple TPS11 Products. Headspace was collected on four leaves for 24 h, 3 d after agroinfiltration (see detailed protocol in Methods). (A) Representative GC-MS chromatograms of headspace from N. benthamiana transiently expressing the empty vector, TPS11 alone, or coexpressing TPS11 and CYP706A3. Chromatograms show the relative abundance of total ion current (TIC) and the sum of extracted ion current in the inset (m/z 123 + 125 + 137). (B) Relative quantification of emitted TPS11 products in the headspace of N. benthamiana expressing TPS11 alone and coexpressing TPS11 and CYP706A3 (only compounds for which quantification was not biased by low emission or coelution with compounds having similar mass spectra are shown). Histograms represent relative emission levels from 3 biological replicates (pooled leaves from individual transformed plants) ±se compared with levels of the same sesquiterpene emitted by N. benthamiana leaves expressing TPS11 alone (set at 100%). Statistically significant differences between leaves expressing TPS11 alone and leaves coexpressing TPS11 and CYP706A3 are indicated (two-tailed Student’s t test: *P < 0.05; **P < 0.01). Compounds are sorted from the most to the least transformed by CYP706A3. Chemical structure of each compound is shown on the right. Absolute quantifications and additional data are provided in Supplemental Table 1. Statistics can be found in Supplemental Data Set 2.
Figure 6.
Figure 6.
Flower-emitted VOCs in CYP706A3 Mutants. (A) GC-MS chromatograms of headspace collected from flowers of Col-0, cyp706a3, and CYP706A3 overexpressing lines. Chromatograms show the relative abundance of the sum of extracted ion current (m/z 93 + 109) to display the major mono- and sesquiterpenes. Chromatograms in the inset show the relative abundance of the sum of extracted ion current (m/z 123 + 125 + 137) to highlight the major CYP706A3 primary and volatiles products. (B) to (E) GC-MS relative quantification of total VOCs emissions (B), TPS11 and TPS21 products (C), TPS24 products (D), and CYP706A3 oxygenated products 1, 2, 3, and 4 (E). VOCs emitted by flowers of different lines were compared with those emitted by Col-0 (100%). Note that the y axis in (C) and (E) are in logarithmic scale. Compounds in (C) and (D) are sorted from the most to least increased in insertion mutants. Data are means ± se of three biological replicates (pooled inflorescences from individual plants). Statistically significant differences relative to Col-0 are indicated (two-tailed Student’s t test: *p < 0.05, **p < 0.01, ***p < 0.001). Statistics can be found in Supplemental Data Set 2.
Figure 7.
Figure 7.
Soluble Products of CYP706A3-Dependent Sesquiterpene Oxygenation Detected in Flower Tissues. Sesquiterpene oxides from wild-type and CYP706A3 mutant plants were quantified in flower methanol extracts. LC-MS/MS using multiple reaction monitoring of specific MS/MS transitions was targeted to identify sesquiterpene oxides resulting from single or multiple oxidations. For each compound differentially detected in mutant lines, the specific MS/MS transitions used are shown, as well as the expected raw formula. Data are given as means ± se of three biological replicates (pooled inflorescences from individual plants) and expressed relative to Col-0 set at 100%. Statistically significant differences relative to Col-0 are indicated (two-tailed Student’s t test: *P < 0.05, **P< 0.01, ***P < 0.001). Statistics can be found in Supplemental Data Set 2. Representative chromatograms and identification of numbered sesquiterpene oxides are shown in Supplemental Figure 14. FS, flower soluble compounds.
Figure 8.
Figure 8.
The TPS11/CYP706A3 Cluster Is Active in Developing Floral Buds. (A) Relative expression of CYP706A3 and of major flower-expressed terpene synthase genes (Figure 1) during floral transition and inflorescence development evaluated by RT-qPCR. (B) Quantification of (+)-thujopsene (top) and (+)-α-barbatene (bottom) emission from wild-type and cyp706a3-2 mutant plants at the same development stages as in (A). VOCs were collected for 24 h from four plants per sample at the six stages of flower development shown in the photographs below from floral transition (T0) to opened inflorescence (Flow). T indicates the different transition phases. (C) LC-MS/MS quantification of soluble sesquiterpene oxides identified in methanol extracts of stage T4 buds from wild-type and cyp706a3-2 mutant plants (as described in Figure 7). For each compound, specific MS/MS transitions used are indicated, as well as expected raw formulae. Representative chromatograms and identification of the numbered sesquiterpene oxides are shown in Supplemental Figure 16. BS, bud soluble compounds. Data in (B) are given as means ± se (n = 4 individual plants). Data in (A) and (C) are given as means ± se of three biological replicates (pooled inflorescences from individual plants). Statistically significant differences relative to Col-0 are indicated (two-tailed Student’s t test: *P < 0.05, **P < 0.01, ***P < 0.001). Statistics can be found in Supplemental Data Set 2.
Figure 9.
Figure 9.
3D Structural Model of the CYP706A3 Active Site and Comparative Docking of Relevant Substrates. Structural model of AtCYP706A3 (segment 38-519) showing potential channels for substrate access, active site topology/characteristics, and docking positions for (+)-α-barbatene, (+)-thujopsene, and (+)-1-oxo-thujopsene determined by Autodock4. (A) Overall structure displaying the two main channels (represented in surface mode in pink and green) with bottleneck values of 1.4 Å, positive hydropathy indexes, and logP values higher than 1. The predicted position of the membrane surface calculated by the PPM server of the OPM database (https://opm.phar.umich.edu/ppm_server) is schematized by the horizontal dashed line. The most hydrophobic channel (green) connects directly to the membrane bilayer while the other channel (pink) connects the active site to the interfacial medium. (B) Display of the small internal cavity mostly delineated by hydrophobic residues (in yellow, surface mode). Two apertures are visible, corresponding to egress channels. Polar (green) and charged (red) residues correspond to Thr322 and Asp314, respectively. Thr322 is the only nonhydrophobic residue in contact with the active site cavity. (C) View of (+)-thujopsene buried in the small hydrophobic pocket. Only the first crown of interacting residues is displayed. The only polar residue Thr322 of the cavity is shown on the left (red surface). The thujopsene double bond is indicated in red. (D) View of (+)-α-barbatene in the small hydrophobic pocket. Only the first crown of residues is displayed. The only polar residue Thr322 of the cavity is shown on the left (red surface). The barbatene double bond is indicated in red. Distance (≈3Å) between the oxidation site and heme iron is indicated. (E) Predominant docking pose of (+)-thujopsene, with high affinity energy binding of –9.2 kcal.mol–1. The two atoms closest to the heme iron are C1 and C11, in full agreement with oxidation site. Distances to heme iron are indicated in red with dotted lines, and double bond C1-C2 is shown in red. (F) Predominant docking pose of (+)-α-barbatene, with high affinity energy binding of –9.39 kcal.mol–1. Two atoms (red ball-and-stick) closest to heme iron (pink) C5 and C6 are at equivalent distances. The polar side chain of Thr322 is displayed. (G) Predominant docking pose of (+)-1-oxo-thujopsene, with high affinity energy binding of –9.8 kcal.mol–1. The keto group (C1=O), shown in red, is oriented on the same side as the polar side chain of Thr322.
Figure 10.
Figure 10.
The Cluster Oxidation Products Influence Florivore Behavior and Floral Microbial Populations. (A) Feeding preference of larvae of Plutella xylostella for buds from Col-0, cyp706a3-2, and 35S:CYP706A3 in dual-choice test. Data represent the average proportion of consumed buds for 30 individual insects (±se). Statistically significant differences are indicated (Wilcoxon: *p = 0.0265, **p = 0.0019). (B) Diversity of OTUs present on Col-0 flowers was lower than those of cyp706a3-2 and 35S:CYP706A3 when analyzed using a Chao rarefaction test. Graph shows OTUs accumulation curves for each flower line when increasing the number of flower samples analyzed (rarefaction). Data are means ± se from 5 biological replicates (pooled inflorescences from 5 individual plants): Col-0 = 538 ± 13, cyp706a3-2 = 565 ± 13, and 35S:CYP706A3 = 571 ± 15. Curve thickness represents ± se. (C) Abundance of OTUs (counts) detected on the flowers of Col-0, cyp706a3-2, and 35S:CYP706A3 was analyzed by a PLS-DA using the three lines as discriminant factor. Graph shows the difference in overall bacterial communities for each of five replicates from the three different lines. A cross-validation test with 999 permutations confirms the significant difference between bacterial communities among lines (P = 0.001). (D) Differential flower-associated bacterial populations between Col-0, cyp706a3-2, and 35S:CYP706A3 flowers. Heatmap represents the relative abundance of specific OTUs being significantly different between a pair of lines based on a Wilcoxon rank sum test (n = 5, P < 0.05). OTUs that significantly differed between all lines are marked with an asterisk (Kruskal-Wallis rank sum test, n = 5, P < 0.05). OTUs are hierarchically clustered based on the average number of reads per flower line with uncentered correlation. Each row gives the median proportional number of reads in each of the flower lines, that is, each row sums up to 1 to facilitate comparison between lines and OTUs despite differences in total read counts. Each color represents a phylum (Actinobacteria, Bacteroidetes, Firmicutes, or Proteobacteria) as indicated in the box. Taxonomic designation was based on the percentage of identity to reference sequences in the SILVA database and indicated at the genus level unless unknown (i.s., incertae sedis). Detailed taxonomic identification is presented in Supplemental Table 4. Statistics can be found in Supplemental Data Set 2.
Figure 11.
Figure 11.
Evolution of the TPS11/CYP706A3 gene cluster in Brassicaceae. TPS11 (A) and CYP706A (B) phylogeny in Brassicales. Protein sequences were retrieved using a homology search with Arabidopsis TPS11 or CYP706A3 sequences as a template, from the Phytozome website (http://phytozome.jgi.doe.gov/), the BrassicaDB page (http://brassicadb.org/brad), or David Nelson’s website (http://drnelson.uthsc.edu/CytochromeP450.html), and used to build the tree using PhyML on Gblocks sets defined on the multiple alignment of protein sequences using Seaview (http://doua.prabi.fr/software/seaview). Alignments and global trees used to generate the figure are available in Supplemental Data Sets 4 to 7. (A) Phylogeny of TPS11. TPS sequences closest to TPS11 in Capsella and Arabidopsis are used as an outgroup. (B) Phylogeny of the available sequences assigned to the CYP706A subfamily of Brassicales and some closest homologs were used as an outgroup. If not specifically named yet, sequences were referred to according to their position in the different branches of the tree. Bootstrap values for the different branches are available in Supplemental Data Sets 5 and 7. (C) Structure of the TPS11/CYP706A3 locus. Species possessing a CYP706A3 homolog were aligned at the genome level to show potential gene clusters. TPS11 and homologs were given different names corresponding to their position in the phylogenetic tree below. Conserved features and neighboring genes were highlighted by similar box shape, color, or putative annotation. Shown are CYP706A3 and duplicates (magenta); TPS11 and duplicates (blue); SAMT (green): S-adenosyl methyltransferase domain; MCM6 (yellow): DNA replication licensing factor; DREPP (orange): PF05558 DREPP plasma membrane polypeptide; TuF (gray): elongation factor Tu; CH (gray): charged multivesicular body protein 2A; LSD1 (gray); NiR: unnamed nitrate dehydrogenase. Light gray boxes: no annotation available. Scale bar = substitutions per site.
None

Comment in

References

    1. Abdalsamee M.K., Müller C. (2015). Uncovering different parameters influencing florivory in a specialist herbivore. Ecol. Entomol. 40: 258–268.
    1. Abel C., Clauss M., Schaub A., Gershenzon J., Tholl D. (2009). Floral and insect-induced volatile formation in Arabidopsis lyrata ssp. petraea, a perennial, outcrossing relative of A. thaliana. Planta 230: 1–11. - PMC - PubMed
    1. Alonso J.M., et al. (2003). Genome-wide insertional mutagenesis of Arabidopsis thaliana. Science 301: 653–657. - PubMed
    1. Bassard J.-E., et al. (2012). Protein-protein and protein-membrane associations in the lignin pathway. Plant Cell 24: 4465–4482. - PMC - PubMed
    1. Benkert P., Künzli M., Schwede T. (2009). QMEAN server for protein model quality estimation. Nucleic Acids Res. 37: W510-4. - PMC - PubMed

Publication types

MeSH terms