. 2019 Nov 27;39(48):9478-9490.
doi: 10.1523/JNEUROSCI.0182-19.2019. Epub 2019 Oct 18.

Protein Kinase C and Calmodulin Serve As Calcium Sensors for Calcium-Stimulated Endocytosis at Synapses

Affiliations

Protein Kinase C and Calmodulin Serve As Calcium Sensors for Calcium-Stimulated Endocytosis at Synapses

Ying-Hui Jin et al. J Neurosci. .

Abstract

Calcium influx triggers and facilitates endocytosis, which recycles vesicles and thus sustains synaptic transmission. Despite decades of studies, the underlying calcium sensor remained not well understood. Here, we examined two calcium binding proteins, protein kinase C (PKC) and calmodulin. Whether PKC is involved in endocytosis was unclear; whether calmodulin acts as a calcium sensor for endocytosis was neither clear, although calmodulin involvement in endocytosis had been suggested. We generated PKC (α or β-isoform) and calmodulin (calmodulin 2 gene) knock-out mice of either sex and measured endocytosis with capacitance measurements, pHluorin imaging and electron microscopy. We found that these knock-outs inhibited slow (∼10-30 s) and rapid (<∼3 s) endocytosis at large calyx-type calyces, and inhibited slow endocytosis and bulk endocytosis (forming large endosome-like structures) at small conventional hippocampal synapses, suggesting the involvement of PKC and calmodulin in three most common forms of endocytosis-the slow, rapid and bulk endocytosis. Inhibition of slow endocytosis in PKC or calmodulin 2 knock-out hippocampal synapses was rescued by overexpressing wild-type PKC or calmodulin, but not calcium-binding-deficient PKC or calmodulin mutant, respectively, suggesting that calcium stimulates endocytosis by binding with its calcium sensor PKC and calmodulin. PKC and calmodulin 2 knock-out inhibited calcium-dependent vesicle mobilization to the readily releasable pool, suggesting that PKC and calmodulin may mediate calcium-dependent facilitation of vesicle mobilization. These findings shed light on the molecular signaling link among calcium, endocytosis and vesicle mobilization that are crucial in maintaining synaptic transmission and neuronal network activity.SIGNIFICANCE STATEMENT Vesicle fusion releases neurotransmitters to mediate synaptic transmission. To sustain synaptic transmission, fused vesicles must be retrieved via endocytosis. Accumulating evidence suggests that calcium influx triggers synaptic vesicle endocytosis. However, how calcium triggers endocytosis is not well understood. Using genetic tools together with capacitance measurements, optical imaging and electron microscopy, we identified two calcium sensors, including protein kinase C (α and β isoforms) and calmodulin, for the most commonly observed forms of endocytosis: slow, rapid, and bulk. We also found that these two proteins are involved in calcium-dependent vesicle mobilization to the readily releasable pool. These results provide the molecular signaling link among calcium, endocytosis, and vesicle mobilization that are essential in sustaining synaptic transmission and neuronal network activity.

Keywords: calmodulin; capacitance measurement; electron microscopy; endocytosis; pHluorin imaging; protein kinase C.


Figures

Figure 1.
Figure 1.
PKC knock-out mouse generation and immunostaining. A, Schematic illustration of the generation of PKCβ−/− mice. PKCβ gene has five exons, three of which (3, 4, and 5) are shown. Targeted embryonic stem (ES) cells (Prkcbtm1a(EUCOMM)Wtsi line EPD0233_5_F09) were obtained from The International Mouse Phenotyping Consortium and were injected into C57BL/6J blastocysts to generate chimeras. Chimeric mice were then bred with C57BL/6J to generate PKCβ targeted germline mice (PKCβ+/loxP). PKCβ+/loxP mice were bred with CMV-Cre mice (The Jackson Laboratory, 006054) to delete exon 4, generating PKCβ−/+ mice, which were used to establish the PKCβ−/− mouse line. Mouse genotypes were determined by PCR. B, Antibody staining of PKCα and vGluT1 in P9 WT and PKCα−/− calyces (“overlay”). C, Antibody staining of PKCβ and vGluT1 in P9 WT and PKCβ−/− calyces (“overlay”). D, Left, PKCα immunostaining staining intensity (FPKCα; a.u., arbitrary units; mean + SEM) in P7–P10 WT (14 calyces, 4 mice) and PKCα−/− calyces (15 calyces, 4 mice). **p < 0.01 (t test). Right, PKCβ immunostaining staining intensity (FPKCβ) in P7–P10 WT (24 calyces, 3 mice) and PKCβ−/− calyces (16 calyces, 3 mice). **p < 0.01 (t test).
Figure 2.
Figure 2.
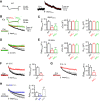
PKCα or PKCβ knock-out inhibits slow endocytosis at calyces. A, Sampled ICa (left) and Cm (right) induced by depol20ms (arrow) in a WT calyx. The red curve is a mono-exponential fit of the Cm decay with a τ of 19.1 s. (B) ICa (mean + SEM) and Cm (mean + SEM) induced by depol20ms (arrow) in WT (black, 9 calyces, 9 mice, abbreviated as 9c/9m), PKCα−/− (14c/14m, red) and PKCβ−/− (6c/6m, green) calyces. Data from P7–P10 mice at 22–24°C; SEM plotted every 2 ms for ICa and 1 s for Cm (applies to all similar graphs). C, Ratedecay, the capacitance jump (ΔCm) and the ICa charge (QICa) induced by depol20ms in WT (9c/9m), PKCα−/− (14c/14m) and PKCβ−/− (6c/6m) calyces (P7–P10, 22–24°C). Bar graphs are plotted as mean + SEM (applies to all bar graphs) *p < 0.05; **p < 0.01; t test compared with WT (applies to all bar graphs). D, E, Similar to B and C, respectively, except that the stimulus was 20 APe at 100 Hz (WT, 8c/8m; PKCα−/−, 10c/10m; PKCβ−/−, 8c/8m; P7–P10, 22–24°C). F, G, Cm and Ratedecay (mean + SEM) induced by depol20ms (arrow) in WT (black, 7c/7m) and PKCα−/− calyces at 34–37°C (F; WT, 7c/7m; PKCα−/−, 4c/4m; P7–P10 mice) or at P13–P14 mice (G: WT, 7c/7m; PKCα−/−, 9c/9m; 22–24°C). (H) Cm and Ratedecay (mean + SEM) induced by depol20ms in control (Ctrl, 11c/11m) or in the presence of BIS (11c/11m) or PMA (8c/8m) at 22–24°C in P7–P10 mice.
Figure 3.
Figure 3.
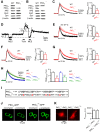
PKCα or PKCβ knock-out inhibits rapid endocytosis and vesicle mobilization to the readily releasable pool at calyces. AH, Similar arrangements as Figure 2A–H, respectively, except that the stimulus was depol20msX10 (AC, FH) or 200 APe at 100 Hz (D,E) for inducing rapid endocytosis. A, Red curve is a biexponential fit of the Cm decay with a τ of 1.4 s and 14.3 s, respectively (ICa not shown). B, C, WT, 9c/9m; PKCα−/−, 14c/14m; PKCβ−/−, 6c/6m. D, E, WT, 8c/8m; PKCα−/−, 11c/11m; PKCβ−/−, 8c/8m. F, WT, 6c/6m; PKCα−/−, 4c/4m. G, WT, 7c/7m; PKCα−/−, 8c/8m. H, Ctrl, 11c/11m; BIS, 11c/11m; PMA, 8c/8m. I, Left, Sampled Cm induced by depol20msX10 (each arrow: 1 depol20ms) from WT, PKCα−/− and PKCβ−/− calyces. ΔCm induced by the first depol20ms was normalized. Middle and right, ΔCm (middle) and accumulated ΔCm (ΣΔCm, right) induced by each of the 10 depol20ms during depol20msX10 in WT (9c/9m), PKCα−/− (14c/14m) and PKCβ−/− (6c/6m) calyces. Data (mean ± SEM) are normalized to ΔCm induced by the first depol20ms. ΣΔCm was significantly higher for the WT group (*p < 0.05; **p < 0.01).
Figure 4.
Figure 4.
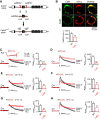
PKC and its calcium-binding domain are required for endocytosis at hippocampal synapses. A, B, Western blot of PKCα, PKCβ, adaptor protein 2 (AP2), clathrin heavy chain (CHC), dynamin (Dyn), and β-actin in WT, PKCα−/− (A), and PKCβ−/− (B) hippocampal culture. Results in A and B were repeated by 2–4 times. C, FSypH traces (normalized to baseline, left) and Ratedecay (right) induced by Train40Hz (bar) in WT (n = 14 experiments) or PKCα−/− (n = 28 experiments) hippocampal culture at 22–24°C. Data plotted as mean + SEM; *p < 0.05; **p < 0.01, t test (applies to all similar graphs). Throughout the study, each experiment contained 20–30 boutons; 1–3 experiments were taken from 1 culture; each culture was from 3–5 mice; each group was from 4–12 cultures. D, Applying MES solution (pH:5.5, bars) quenched FSypH (mean + SEM) to a similar level (lowest dash line) before and after a 10 s train of stimuli in PKCα−/− boutons (n = 6 experiments, 22–24°C). ΔS, SypH at resting plasma membrane quenched by MES. EG, Similar to C, but at 34–37°C (E), in PKCβ−/− culture (F), or after a 10 s train at 20 Hz (G). E, WT, n = 6 experiments; PKCα−/−, n = 6. F, WT, n = 14; PKCβ−/−, n = 5. G, WT, n = 16; PKCα−/−, n = 22. H, FSypH traces and Ratedecay induced by Train40Hz (bar) in WT boutons (n = 14), PKCα−/− boutons (PKCα−/−, n = 28), PKCα−/− boutons rescued with WT PKCα (containing mCherry for recognition, PKCα−/−+PKCα, n = 7), and in PKCα−/− boutons rescued with PKCαD/A and mCherry (PKCα−/−+PKCαD/A, n = 8). I, Protein sequence of PKCα and PKCαD/A C2 domain. The Ca2+-coordinating aspartates of PKCα (bold) were mutated to alanines (red) in PKCαD/A. J, We expressed PKCα-GFP (left two panels) or PKCαD/A-GFP (right two panels) in HEK293T cells and monitored the subcellular distribution of the kinase. The Ca2+ ionophore, ionomycin (10 μm, 15 min), induced translocation of PKCα-GFP toward the plasma membrane, but did not alter the intracellular distribution of PKCαD/A-GFP. Such results were observed in 3 experiments (each experiment had 2–3 cells). K, Left, PKCα−/− neurons rescued with WT PKCα (containing mCherry for recognition, PKCα−/−+PKCα), or with PKCαD/A and mCherry (PKCα−/−+PKCαD/A). Right, Fluorescence intensity of mCherry (FmCherry) in PKCα−/−+PKCα neurons (n = 10) and PKCα−/−+PKCαD/A neurons (n = 13). FmCherry was measured from both soma and branches.
Figure 5.
Figure 5.
PKCα knock-out affects endocytosis examined with EM at hippocampal synapses. A, EM images of WT and PKCα−/− hippocampal boutons at rest (Rest) and at 0 min (K+), 3 min and 10 min after 1.5 min 90 mm KCl application. For Rest, HRP was included for 1.5 min; for KCl application, HRP was included only during KCl application (see labels). B, C, Number of HRP(+) vesicles (B) and the bulk endosome area (C) per square micrometer of synaptic cross-section are plotted versus the time before (Rest) and at 0 min (K+), 3 min, and 10 min after the end of KCl application in WT and PKCα−/− hippocampal cultures (mean + SEM, each group was from 100–132 synaptic profiles from 4–12 mice). The temperature before fixation was 22–24°C. ***p < 0.001; **p < 0.01; *p < 0.05 (t test). D, E, Similar to B and C, respectively, except that the temperature was 37°C before fixation.
Figure 6.
Figure 6.
CaM 2 knock-out inhibits slow endocytosis, rapid endocytosis, and vesicle mobilization to the readily releasable pool at calyces. A, Generation of Calm2loxP mice (Calm2: Calmodulin 2 gene). sgRNAs were designed by using CRISPR Design (https://zlab.bio/guide-design-resources) to identify unique target sites throughout the mouse genome. sgRNAs were transcribed in vitro using the MEGAshortscript T7 Transcription Kit (Life Technologies) from synthetic double-strand DNAs purchased from IDT (Integrated DNA Technologies) and purified using MEGAclear kit (Life Technologies). A mixture of Cas9 mRNA (TriLink Biotechnologies, 100 ng/μl), sgRNAs (50 ng/μl), and ssDNA templates (100 ng/μl, synthesized by IDT) was injected into the cytoplasm of one cell-stage fertilized embryos harvested from C57BL/6J mice (The Jackson Laboratory, 000664). Viable two-cell stage embryos were transferred into the oviducts of female surrogates to generate founder mice. Founders with loxP inserts were identified by PCR and sequencing, and were subsequently bred with C57BL/6J mice to generate heterozygous mice. The primers used to identify the 5′ and 3′ loxP insertions were Calm2 mtF: 5′-CCATGAACCTTGAACCTGTAGGATCCA-3′ and Calm2 mtR: 5′-ATGCTACATTCAACTTGTCACCATTCGAATTCA-3′. B, Top, Antibody staining of CaM and vGluT1 (labeling calyx) in a P9 WT (upper) and a CaM2−/− (lower) calyx (images superimposed in the right). Bottom, CaM staining intensity (mean + SEM, a.u., arbitrary unit) in P7–P10 WT (47 calyces, 4 mice) and CaM2−/− calyces (53 calyces, 4 mice). **p < 0.01 (t test). C, ICa, Cm and Ratedecay (mean + SEM) induced by depol20ms (arrow) in WT (8c/8m, black) and CaM2−/− (9c/9m) calyces (P7–P10, 22–24°C). D, Similar to C, but with depol20msX10 (WT, 8c/8m; CaM2−/−, 9c/9m). E, F, Similar to C and D, respectively, but at 34–37°C. E, WT, 6c/6m; CaM2−/−, 6c/6m. F, WT, 6c/6m; CaM2−/−, 6c/6m. G, H, Similar to C and D, respectively, but from P13–P14 calyces. G, WT, 7c/7m; CaM2−/−, 8c/8m. H, WT, 7c/7m; CaM2−/−, 8c/8m.
Figure 7.
Figure 7.
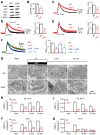
Calmodulin and its calcium binding domain are required for endocytosis at hippocampal synapses. A, Western blot of CaM, AP2, clathrin heavy chain (CHC), dynamin (Dyn), and β-actin in WT and CaM2−/− brain. B, CaM Western blot intensity (CaM Int, a.u.) from WT or CaM2−/− culture. C, FSypH traces (normalized to baseline) and Ratedecay induced by Train40Hz (bar) in WT (n = 14 experiments) or CaM2−/− (n = 8) hippocampal culture at 22–24°C (mean + SEM). D, Similar to C, but at 34–37°C (WT, n = 6; CaM2−/−, n = 4). E, Similar to C, but after a 10 s train at 20 Hz (WT, n = 16; CaM2−/−, n = 7). F, FSypH traces and Ratedecay induced by Train40Hz in WT hippocampal boutons (n = 14 experiments, with SypH transfection), CaM2−/− boutons (n = 8, with SypH transfection), CaM2−/− boutons transfected with a plasmid containing CaM and mCherry (mCherry for recognition, SypH was cotransfected, n = 4, CaM2−/−+CaM), and CaM2−/− boutons transfected with a plasmid containing CaM1234 and mCherry (n = 4, CaM2−/−+M). Temperature was 22–24°C. G, EM images of WT and CaM2−/− hippocampal boutons at rest (Rest) and at 0 min (K+), 3 min and 10 min after 1.5 min application of KCl and HRP (same arrangements as in Fig. 5A). H, I, The number of HRP(+) vesicles (H) and the bulk endosome area (I) per square micrometer of synaptic cross-section are plotted versus the time before (Rest) and at 0 min (K+), 3 min, and 10 min after KCl/HRP application in WT and CaM2−/− hippocampal cultures (22–24°C). Data are expressed as mean + SEM; each group was from 100–132 synaptic profiles from 4–12 mice. J, K, Similar to H and I, respectively, except that the temperature was 37°C.

Similar articles

Cited by

References

    1. Artalejo CR, Henley JR, McNiven MA, Palfrey HC (1995) Rapic endocytosis coupled to exocytosis in adrenal chromaffin cells involves Ca2+, GTP, and dynamin but not clathrin. Proc Natl Acad Sci U S A 92:8328–8332. 10.1073/pnas.92.18.8328 - DOI - PMC - PubMed
    1. Balaji J, Armbruster M, Ryan TA (2008) Calcium control of endocytic capacity at a CNS synapse. J Neurosci 28:6742–6749. 10.1523/JNEUROSCI.1082-08.2008 - DOI - PMC - PubMed
    1. Borst JG, Soria van Hoeve J (2012) The calyx of Held synapse: from model synapse to auditory relay. Annu Rev Physiol 74:199–224. 10.1146/annurev-physiol-020911-153236 - DOI - PubMed
    1. Chanaday NL, Kavalali ET (2018) Time course and temperature dependence of synaptic vesicle endocytosis. FEBS Lett 592:3606–3614. 10.1002/1873-3468.13268 - DOI - PubMed
    1. Chiang HC, Shin W, Zhao WD, Hamid E, Sheng J, Baydyuk M, Wen PJ, Jin A, Momboisse F, Wu LG (2014) Post-fusion structural changes and their roles in exocytosis and endocytosis of dense-core vesicles. Nat Commun 5:3356. 10.1038/ncomms4356 - DOI - PMC - PubMed

Publication types