. 2019 Dec 2;216(12):2869-2882.
doi: 10.1084/jem.20182044. Epub 2019 Oct 18.

Creatine uptake regulates CD8 T cell antitumor immunity

Affiliations

Creatine uptake regulates CD8 T cell antitumor immunity

Stefano Di Biase et al. J Exp Med. .

Abstract

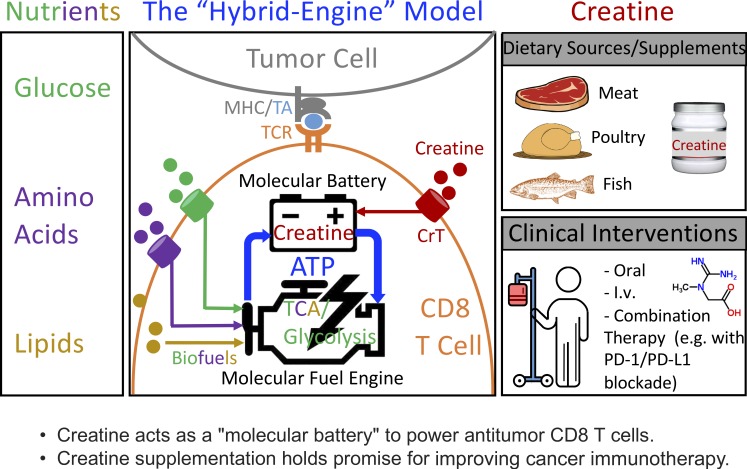
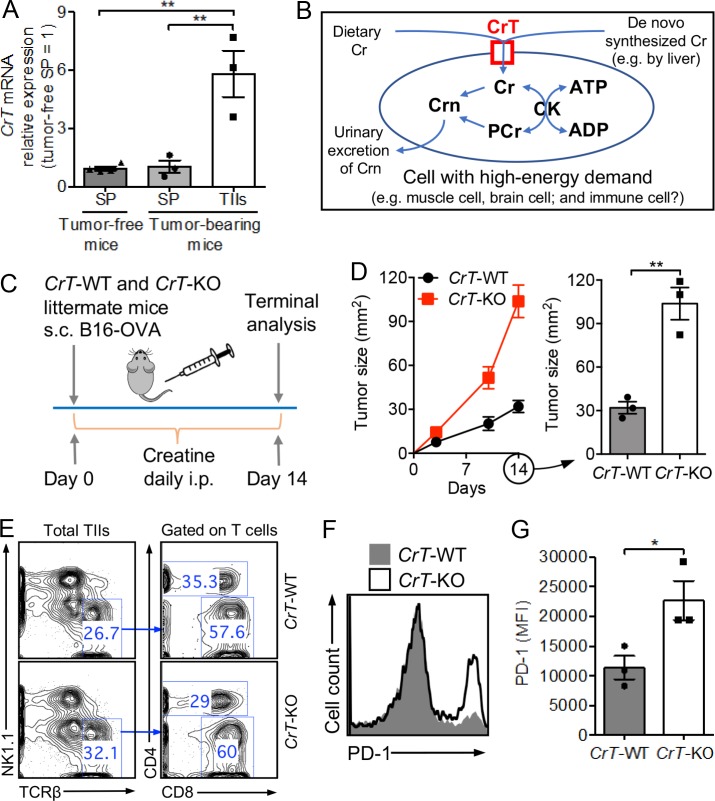
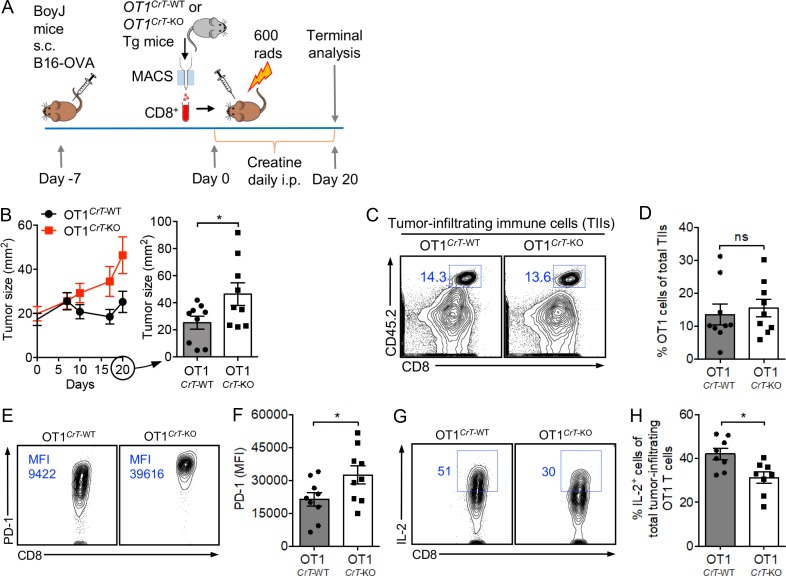
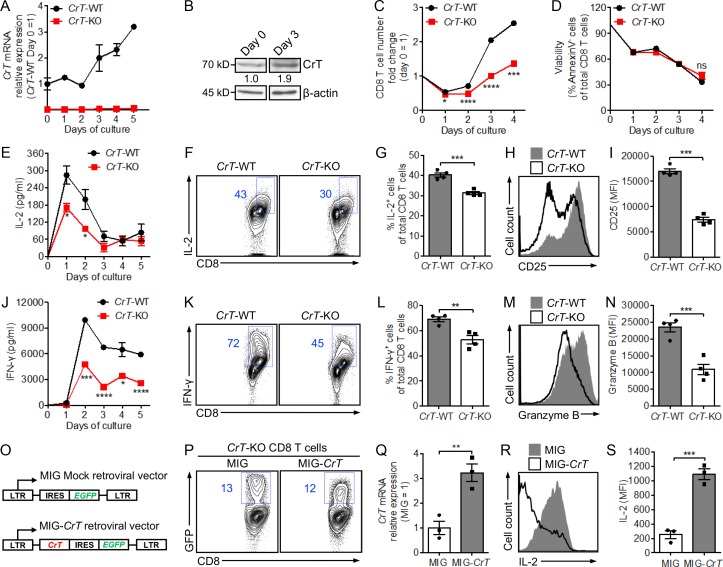
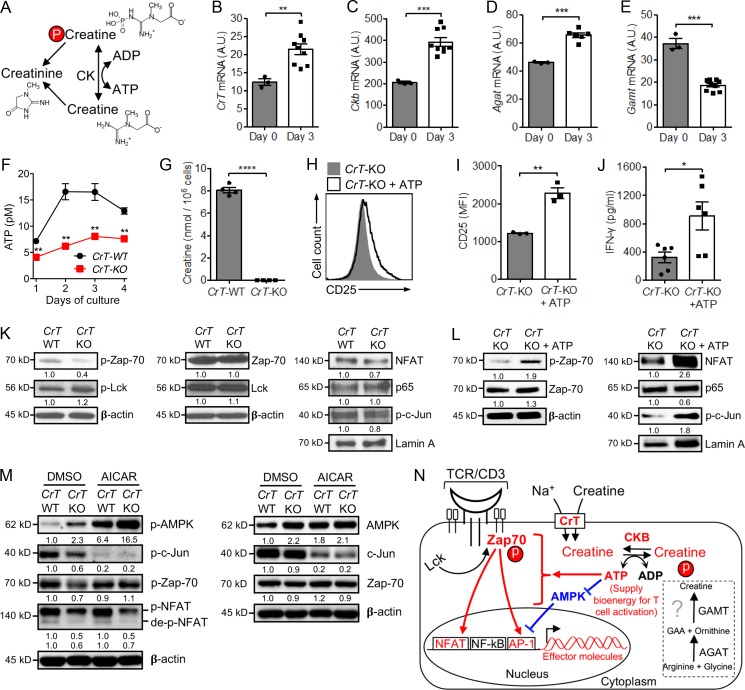
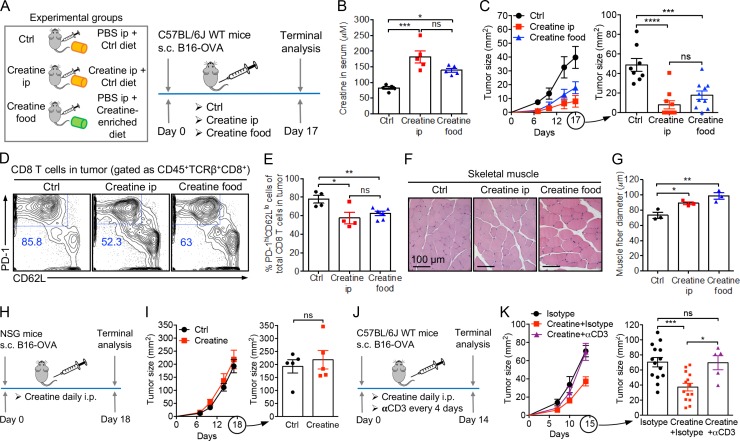
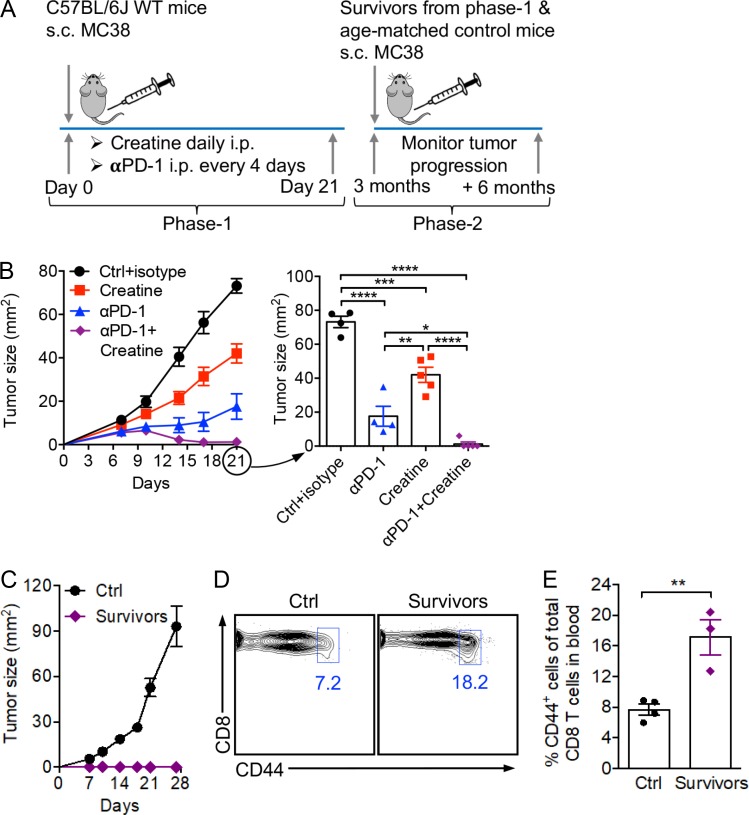
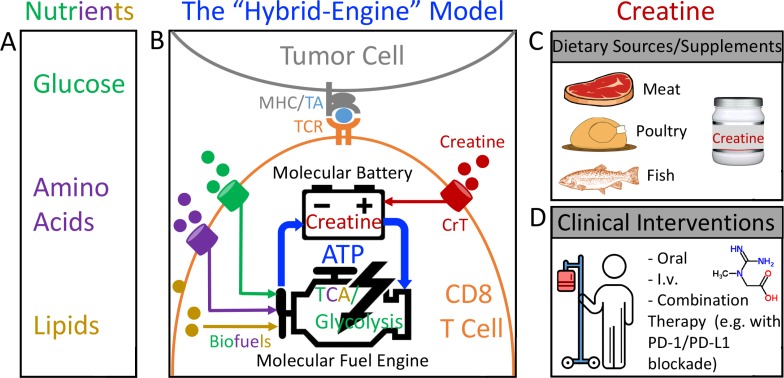
T cells demand massive energy to combat cancer; however, the metabolic regulators controlling antitumor T cell immunity have just begun to be unveiled. When studying nutrient usage of tumor-infiltrating immune cells in mice, we detected a sharp increase of the expression of a CrT (Slc6a8) gene, which encodes a surface transporter controlling the uptake of creatine into a cell. Using CrT knockout mice, we showed that creatine uptake deficiency severely impaired antitumor T cell immunity. Supplementing creatine to WT mice significantly suppressed tumor growth in multiple mouse tumor models, and the combination of creatine supplementation with a PD-1/PD-L1 blockade treatment showed synergistic tumor suppression efficacy. We further demonstrated that creatine acts as a "molecular battery" conserving bioenergy to power T cell activities. Therefore, our results have identified creatine as an important metabolic regulator controlling antitumor T cell immunity, underscoring the potential of creatine supplementation to improve T cell-based cancer immunotherapies.


Figures

None
Graphical abstract
Figure 1.
Figure 1.
CrT-KO mice show impeded control of tumor growth. (A) Creatine transporter (CrT or Slc6a8) mRNA expression in spleen (SP) cells and TIIs in a mouse B16-OVA melanoma model (n = 3–4) measured by qPCR. Cells were collected on day 14 after tumor challenge. (B) Diagram showing creatine uptake and creatine-mediated bioenergy buffering in cells with high-energy demand. Cr, creatine; PCr, phospho-creatine; Crn, creatinine; CK, creatine kinase. (C–G) Study of B16-OVA tumor growth in CrT-WT or CrT-KO littermate mice. (C) Experimental design. (D) Tumor growth (n = 3). (E–G) On day 14, tumors were collected from experimental mice, and TIIs were isolated for further analysis. (E) FACS plots showing the detection of tumor-infiltrating CD4 and CD8 T cells (gated as TCRβ+CD4+ and TCRβ+CD8+ cells, respectively). (F) FACS plot showing PD-1 expression on tumor-infiltrating CD8 T cells. (G) Quantification of F (n = 3). Representative of two (A) and three (C–G) experiments, respectively. Data are presented as the mean ± SEM. *, P < 0.05; **, P < 0.01 by one-way ANOVA (A) or Student’s t test (D and G). See also Fig. S1.
Figure 2.
Figure 2.
Creatine uptake deficiency directly impairs antitumor T cell immunity. B16-OVA tumor growth in BoyJ mice was studied. BoyJ mice received adoptive transfer of OVA-specific OT1 Tg CD8 T cells that were either WT or KO of CrT gene (OT1CrT-WT or OT1CrT-KO cells, respectively). (A) Experimental design. (B) Tumor growth (n = 9). (C–H) On day 20, tumors were collected from experimental mice, and TIIs were isolated for further analysis. (C) FACS plots showing the detection of tumor-infiltrating OT1 T cells (gated as CD45.2+CD8+ cells). (D) Quantification of C (n = 9). (E) FACS plots showing PD-1 expression on tumor-infiltrating OT1 T cells. (F) Quantification of E (n = 9). (G) FACS plots showing intracellular IL-2 production of tumor-infiltrating OT1 T cells. Before intracellular cytokine staining, TIIs were stimulated with PMA and ionomycin in the presence of GolgiStop for 4 h. (H) Quantification of G (n = 8). Representative of two experiments (A–H). Data are presented as the mean ± SEM. ns, not significant; *, P < 0.05 by Student’s t test. See also Fig. S2.
Figure 3.
Figure 3.
Creatine uptake regulates CD8 T cell response to antigen stimulation. (A–N) CD8 T cells were purified from CrT-WT or CrT-KO mice and stimulated in vitro with plate-bound anti-CD3 (5 µg/ml; n = 3–4). The analyses of CrT mRNA expression (A), CrT protein expression (B), cell proliferation (C), cell survival (D), effector cytokine production (E–G and J–L), activation marker expression (H and I), and cytotoxic molecule production (M and N) are shown, either over a 4- to 5-d time course (A, C, D, E, and J) or 48 h after anti-CD3 stimulation (F–I and K–N). (O–S) CrT-KO CD8 T cells were stimulated in vitro with anti-CD3 and transduced with a MIG-CrT retrovector (O; n = 3). The analyses of retrovector transduction rate (P), CrT mRNA expression (Q), and IL-2 effector cytokine production (R and S) 96 h after stimulation are shown. Representative of two (O–S) and three (A–N) experiments, respectively. Data are presented as the mean ± SEM. ns, not significant; *, P < 0.05; **, P < 0.01; ***, P < 0.001; ****, P < 0.0001 by Student’s t test. See also Fig. S3.
Figure 4.
Figure 4.
Creatine uptake modulates CD8 T cell activation by regulating T cell ATP/energy buffering. (A) Schematic of creatine-mediated ATP/energy buffering. (B–E) CrT-WT CD8 T cells were stimulated with anti-CD3 and analyzed for mRNA expression of creatine transporter (CrT; B), Ckb (C), and two enzymes controlling the de novo synthesis of creatine, Agat (D) and Gamt (E). n = 3–9. A.U., artificial unit relative to Ube2d2. (F and G) CrT-WT and CrT-KO CD8 T cells were stimulated with anti-CD3 and analyzed for intracellular levels of ATP over time (F) and creatine at 48 h (G). n = 4. (H–J) CrT-KO CD8 T cells were stimulated with anti-CD3, with or without ATP supplementation (100 µm) in the culture medium, and analyzed for surface CD25 activation marker expression (H and I) and IFN-γ effector cytokine production (J) at day 3. n = 3–6. (K) Western blot analysis of TCR signaling events in CrT-WT and CrT-KO CD8 T cells. CrT-WT and CrT-KO CD8 T cells were stimulated with anti-CD3 for 48 h, rested at 4°C for 2 h, then restimulated with anti-CD3 for 30 min followed by Western blot analysis. (L) Western blot analysis of TCR signaling events in CrT-KO CD8 T cells with or without ATP supplementation. CrT-KO CD8 T cells were stimulated with anti-CD3 for 48 h, rested at 4°C for 2 h, then restimulated with anti-CD3 for 30 min in the presence or absence of ATP supplementation (100 µm) followed by Western blot analysis. (M) Western blot analysis of TCR signaling events in CrT-WT and CrT-KO CD8 T cells with or without AICAR treatment. CrT-WT and CrT-KO CD8 T cells were pretreated with AICAR (2 mM) for 30 min, then stimulated with anti-CD3 for 20 min followed by Western blot analysis. DMSO, solvent used to dissolve AICAR. (N) Schematic model showing creatine uptake regulation of T cell activation signaling events. The demonstrated pathways are highlighted in red and blue. Representative of two experiments (B–M). Data are presented as the mean ± SEM. *, P < 0.05; **, P < 0.01; ***, P < 0.001; ****, P < 0.0001 by Student’s t test. See also Fig. S4.
Figure 5.
Figure 5.
Creatine supplementation for cancer immunotherapy. (A–G) Studying the therapeutic potential of creatine supplementation in a B16-OVA melanoma model. (A) Experimental design. (B) Creatine levels in serum (n = 5). (C) Tumor progression (n = 8–10). (D–G) On day 17, tumors and muscles were collected from experimental mice for further analysis. (D) FACS plots showing the phenotype of tumor-infiltrating CD8 T cells. (E) Quantification of D (n = 4–6). (F) H&E-stained skeletal muscle sections. Scale bar: 100 µm. (G) Quantification of F (n = 3). (H and I) Studying the requirement of an intact immune system for cancer therapy effects. (H) Experimental design. (I) Tumor progression (n = 5). NSG, NOD/SCID/γc−/− immunodeficient mice. (J and K) Studying the requirement of T cells for creatine cancer therapy effects. I.p. injection of an anti-CD3 depleting antibody (αCD3, clone 17A2) was used for in vivo depletion of T cells. (J) Experimental design. (K) Tumor progression (n = 5–9). Representative of two (H–K) and three (A–G) experiments. Data are presented as the mean ± SEM. ns, not significant; *, P < 0.05; **, P < 0.01; ***, P < 0.001; ****, P < 0.0001 by one-way ANOVA (B, C, E, G, and K) or Student’s t test (I). See also Fig. S5.
Figure 6.
Figure 6.
Creatine supplementation for combination cancer therapy. Studying the therapeutic potential of creatine supplementation in combination with anti–PD-1 (αPD-1) treatment in an MC38 colon cancer model. (A) Experimental design. (B) Tumor progression at phase-1 (n = 4–5). (C) Tumor progression at phase-2 (n = 3–4). (D) Detection of memory CD8 T cells (gated as CD8+CD44hi) in blood of tumor-bearing mice at phase-2. (E) Quantification of D (n = 3–4). Representative of two experiments (A–E). Data are presented as the mean ± SEM. *, P < 0.05; **, P < 0.01; ***, P < 0.001; ****, P < 0.0001 by one-way ANOVA (B) or Student’s t test (E). See also Fig. S5.
Figure 7.
Figure 7.
The hybrid engine model: an updated view of the molecular machinery that powers antitumor T cell immunity. (A) Nutrients that serve as the biofuels, which can be limiting in the tumor microenvironment. (B) The hybrid engine model. To analogize the hybrid car, a tumor-targeting CD8 T cell utilizes a “molecular fuel engine,” such as aerobic glycolysis and/or tricarboxylic acid cycle, to convert nutrients/biofuels into bioenergy in the form of ATP, while using creatine as a “molecular battery” to store bioenergy and buffer the intracellular ATP level to power T cell antitumor activities. (C) Creatine can be obtained from creatine-rich dietary resources, mainly red meat, poultry, and fish, as well as from dietary supplements. (D) However, the best cancer therapy benefits would come from clinical intervention by administering creatine to cancer patients following specially designed dosing strategies.

References

    1. Baumeister S.H., Freeman G.J., Dranoff G., and Sharpe A.H.. 2016. Coinhibitory Pathways in Immunotherapy for Cancer. Annu. Rev. Immunol. 34:539–573. 10.1146/annurev-immunol-032414-112049 - DOI - PubMed
    1. Bengsch B., Johnson A.L., Kurachi M., Odorizzi P.M., Pauken K.E., Attanasio J., Stelekati E., McLane L.M., Paley M.A., Delgoffe G.M., and Wherry E.J.. 2016. Bioenergetic Insufficiencies Due to Metabolic Alterations Regulated by the Inhibitory Receptor PD-1 Are an Early Driver of CD8(+) T Cell Exhaustion. Immunity. 45:358–373. 10.1016/j.immuni.2016.07.008 - DOI - PMC - PubMed
    1. Chang C.H., and Pearce E.L.. 2016. Emerging concepts of T cell metabolism as a target of immunotherapy. Nat. Immunol. 17:364–368. 10.1038/ni.3415 - DOI - PMC - PubMed
    1. Chang C.H., Qiu J., O’Sullivan D., Buck M.D., Noguchi T., Curtis J.D., Chen Q., Gindin M., Gubin M.M., van der Windt G.J., et al. . 2015. Metabolic Competition in the Tumor Microenvironment Is a Driver of Cancer Progression. Cell. 162:1229–1241. 10.1016/j.cell.2015.08.016 - DOI - PMC - PubMed
    1. Couzin-Frankel J. 2013. Breakthrough of the year 2013. Cancer immunotherapy. Science. 342:1432–1433. 10.1126/science.342.6165.1432 - DOI - PubMed

Publication types

MeSH terms